HAL Id: inserm-00349229
https://www.hal.inserm.fr/inserm-00349229
Submitted on 25 Dec 2008
HAL is a multi-disciplinary open access
archive for the deposit and dissemination of
sci-entific research documents, whether they are
pub-lished or not. The documents may come from
teaching and research institutions in France or
abroad, or from public or private research centers.
L’archive ouverte pluridisciplinaire HAL, est
destinée au dépôt et à la diffusion de documents
scientifiques de niveau recherche, publiés ou non,
émanant des établissements d’enseignement et de
recherche français ou étrangers, des laboratoires
publics ou privés.
Analysis of Cardiac Micro-Acceleration Signals for the
Estimation of Systolic and Diastolic Time Intervals in
Cardiac Resynchronization Therapy
Lionel Giorgis, Alfredo Hernandez, Amel Amblard, Lotfi Senhadji, Serge
Cazeau, Gaël Jauvert, Erwan Donal
To cite this version:
Lionel Giorgis, Alfredo Hernandez, Amel Amblard, Lotfi Senhadji, Serge Cazeau, et al.. Analysis
of Cardiac Micro-Acceleration Signals for the Estimation of Systolic and Diastolic Time Intervals in
Cardiac Resynchronization Therapy. Computers In Cardiology, Sep 2008, Bologna, Italy. pp.393-396.
�inserm-00349229�
Analysis of Cardiac Micro-Acceleration Signals for the Estimation of Systolic
and Diastolic Time Intervals in Cardiac Resynchronization Therapy
L Giorgis
1, AI Hernandez
2,3, A Amblard
1, L Senhadji
2,3, S Cazeau
4, G Jauvert
4, E Donal
2,3,51
Sorin Group ELA Medical, Le Plessis-Robinson, F-92357, France
2
INSERM, U642, Rennes, F-35000, France
3
Universit´e de Rennes 1, LTSI, Rennes, F-35000, France
4
Groupe Inparys, Saint Cloud, F-92210, France
5
CHU Rennes, Service de Cardiologie et Maladies Vasculaires, Rennes, F-35000, France
Abstract
Heart sounds, measured via cardiac micro-acceleration (CMA), carry valuable information about the mechanical and hemodynamic function of the heart. The aim of the present study is to estimate systolic and diastolic time in-tervals from CMA features, extracted by segmentation of the first two heart sounds, i.e. onset, maximum energy and end instants. CMA, ECG and echocardiographic au-dio signals were acquired simultaneously on 60 patients under different hemodynamic conditions. Linear models, fitted between CMA features and echo timings, were eval-uated with their correlation coefficient, model error and coefficient stability. Models for mitral valve closing, aor-tic valve closing and opening instants showed satisfactory results, whereas the estimation of the opening instant of the mitral valve was more difficult. This work suggests the potential utility of CMA for monitoring cardiac function and defining optimal, adaptive pacing configurations.
1.
Introduction
Cardiac Resynchronization Therapy (CRT) is indicated for patients suffering from drug-refractory congestive heart failure (CHF) associated with inter-ventricular dyssyn-chrony [1]. The implantation of a bi-ventricular stimulator makes it possible to re-synchronize the electrical activation of both ventricles. In order to maximize the cardiac me-chanical function for a given patient, the atrio-ventricular (AV) and inter-ventricular (VV) activation delays of the de-vice have to be optimized.
This optimization process is a difficult task that often involves an echo-Doppler acquisition, in order to evaluate the ventricular mechanical function, while scanning differ-ent values for AV and VV delays. This cumbersome tech-nique is not applied systematically and is only done at rest, in supine position. Instead, the possibility of using a
car-diac acoustic signal to monitor the mechanical function of the heart would be interesting from several points of view: i) it will ease the application of the optimization stage, re-ducing costs, ii) it will allow the evaluation on different conditions (rest, exercise, etc.), and iii) it could eventually be embedded into a pacemaker in order to perform an au-tomatic and adaptive CRT optimization.
The study of cardiac acoustic signals has shown to be useful for the evaluation of the mechanical function of the heart. Methods for the analysis of the phonocardio-gram (PCG) or the seismocardiophonocardio-gram (SCG) have been proposed to extract useful information and to perform heart sounds segmentation [2–5]. The arrival of Doppler echocardiography significantly reduced the clinical use of these signals, but the precision and reproducibility of echo-Doppler measurements have been repeatedly criticized [6]. This fact might lead to a renewed interest in quantitative analysis of cardiac acoustic signals, especially in the field of CRT [7].
In this context, previous studies have shown that the measurement of heart sounds via endocardial acceleration (EA) (see Fig 1), developed by Sorin Group CRM, may be valuable for an online follow-up of the cardiac mechani-cal function. In particular, the peak to peak amplitude of first component of the EA signal (EA1) is well correlated to the maximum rate of rise of left ventricular pressure [8] and has been successfully used to optimize CRT [1].
The present study focuses on a non-invasive cardiac micro-acceleration (CMA) device, based on an external version of the EA sensor, placed on the chest of the pa-tient. The potential use of CMA in the context of CRT is evaluated by a quantitative comparison between extracted CMA timings and Doppler-based time intervals. An eval-uation methodology is proposed to assess the performance of different heart sounds segmentation algorithms.
2.
Methods
2.1.
Protocol
This study is based on a non-interventional multi-centre, prospective registry, including 51 CHF patients, and 9 healthy subjects.
Each patient recording was collected during a routine follow-up including echocardiographic measurements. 51 heart failure patients, with implanted CRT pacemakers have been studied. In order to change the systolic and di-astolic time intervals, different pacing configurations were tested: i) biventricular pacing, ii) right ventricular (RV) pacing, iii) left ventricular (LV) pacing, and, when possi-ble, iv) spontaneous rhythm. For some patients, different AV and VV delays were tested.
Echo stress tests were performed on 9 healthy volun-teers at rest, during exercise (cycling), and during recov-ery. These subjects are important, because focusing on CRT patients only would lead to a limited exploration of the possible values of the studied parameters. For exam-ple, healthy subjects show shorter left pre-ejection interval (LPEI) values and shorter cardiac cycles during controlled exercise.
For each configuration, a simultaneous recording of CMA, 2-Lead ECG and pulsed-wave Doppler audio sig-nal, taken from the audio output of a GE Vivid7, were ac-quired with a Biopac MP35 acquisition system at 10kHz. The CMA sensor was clipped with a standard surface ECG electrode on the sternum of the patient and analogically fil-tered in the [15-100Hz] range. Data was processed off-line with custom Matlab signal processing routines.
2.2.
Gold standard Doppler measurements
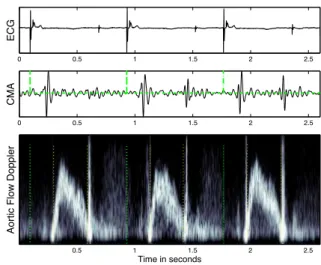
ECG signals were used to segment CMA and Doppler signals into cardiac cycles. We performed an automatic beat detection from ECG signals, and then manually veri-fied and corrected the results. This first step, yet simple, is a real improvement regarding the method used in every day clinical practice. We attached much importance to the ac-curacy and reproducibility of the Doppler measurements. Mitral and aortic blood flow were reconstructed from the Doppler audio signal by applying short-time FFT, with a Hamming window of 64 samples (Fig. 1). To ease the annotations, a flow envelogram was estimated by first in-tegrating the Doppler velocities at each time sample and then applying a moving-average filter.
Four valvular events were annotated by a trained opera-tor and validated by an expert echocardiographist: i) tM C = tREF to mitral valve closing, ii) tAO (LPEI) = tREF to aortic valve opening, iii) tAC = tREF to aortic valve closing, iv) tM O = tREF to mitral valve opening, where tREF is either the beginning of the pacing spike or the
be-0 0.5 1 1.5 2 2.5 EC G 0 0.5 1 1.5 2 2.5 C MA Ao rt ic F lo w D o p p le r Time in seconds 0.5 1 1.5 2 2.5
Figure 1. ECG, CMA and aortic flow Doppler. The be-ginning of each beat, the opening and closing of the aortic valve appear as dotted lines on the lower panel.
ginning of the Q wave in spontaneous rhythms. When the echo measurements confidence on a segment was judged too low by the echocardiographist, the segment of data was rejected from the database.
2.3.
Extraction of CMA timings
For each configuration, 15 cycles of CMA signal, oc-curring during the acquisition of the pulsed wave Doppler, are considered for standard ensemble averaging of the two main components of the CMA signal, EA1 and EA2 (cor-responding respectively to the first and second heart sound in the PCG), separately: i) the phase shifts that maxi-mize the correlation between each cycle are calculated, ii) the cycles are aligned according to a reference component (first cycle of the analysis window) and iii) the two aver-age components EA1 and EA2 are computed. Only highly correlated cycles are averaged.
Envelograms are computed on this average CMA cycle, by applying both the Shannon and Homomorphic trans-forms. These transforms have already been applied to the segmentation of PCG signals [3, 4].
Finally, a threshold-based segmentation algorithm is ap-plied to the envelograms. Again, EA1 and EA2 envel-ograms are normalized and processed separately, in or-der to estimate their start and end instants (tEAxStartand
tEAxEnd respectively) and their instant of maximum
en-ergy (tEAxmaxenergy). Scanning different values of w
(de-fined as the duration of the moving-average window for the Shannon transform and the low-pass filter cut-off fre-quency for Homomorphic envelograms) and threshold (from 0.1 to 0.7 by steps of 0.1) generates different CMA instants.
2.4.
Performance assessment
We first removed outlier points (typically outside the 30ms model error boundaries). A linear model (tV. = a · f eat + b, where tV. is the reference event for valve V and f eat is a CMA feature) was then estimated by standard RMSE minimization. Two complementary ap-proaches were used to evaluate each model:
• Single-pass: a single model is estimated per feature on
N points (all patients and configurations included). This model is globally evaluated with its correlation coefficient rL, its average absolute error µerr, and the percentage of
points outside the 20ms error limit %out.
• Monte-Carlo: on the entire database (DB), we generate
27 different pairs of learning DB (60 % of the DB), on which the model is estimated, and test DB (40 % of the DB), on which the model is evaluated. In each case, rT
and the model error are calculated. We can then estimate the average correlation coefficient µrT and the stability of
the models for each feature: the standard deviation of each model’s coefficient (a and b) is calculated (σaand σb).
3.
Results and discussion
The best CMA feature for each one of the 4 reference echo timings are detailed in Table 1, with their correspond-ing optimal segmentation parameters. It is worth to note that these optimal parameters vary for different echo tim-ings, even if the same CMA feature is selected. For tAO, we specified 2 different CMA features because they pro-vide similar performance.
• Valves Closing Times (tM C and tAC): tM C can
be estimated accurately from several tEA1Startfeatures :
µerr = 12ms, rL = 0.89 and %out = 16. Similarly,
several tEA2Start timings are good estimators of tAC:
µerr = 9ms, rL= 0.98 and %out = 7. Figure 2 presents
an example of the estimation of tAC from tEA2Startby
using a Homomorphic envelogram with w = 15Hz and threshold = 0.6.
Moreover, these models are very stable: σa values for
tM C models are relatively low (2.6 % variations of their corresponding a value) and for tAC models (0.6 % varia-tions). The same stability is observed on the b coefficients for tM C and tAC models (σb= 3ms).
• Valves Opening Times (tM O and tAO): a satisfactory
estimation of the absolute value of tAO with the present extracted CMA timings was difficult to obtain, in compar-ison with those obtained for valve closing instants, but the best model involving a tEA1Start feature presents
over-all interesting properties: µerr = 17ms, rL = 0.86 and
%out = 35. This can be explained by the fact that several complex physiopathological phenomena (including tM C and tAO) are at the origin of EA1 (as for the first heart sound in the PCG) and their relative time of occurrence
may vary in an intra and inter-patients fashion. However, a good correlation exists between tEA1Start(see Fig. 3) or
tEA1maxenergy and the Doppler LPEI, as shown in Table 1.
Concerning tM O, we are not currently able to locate this particular time instant in the CMA signal. In this case, the presence of healthy subjects at rest and performing ex-ercise has a great influence on the correlation rL = 0.9,
despite a high model error µerr = 27ms and a
signifi-cant proportion of patients out of the 20ms error bound-aries %out = 62.
The Monte Carlo analysis demonstrates that these models are more unstable, especially on tM O. σa are high for
tAO models (8% variations of their respective a value for tEA1Startand 11% for tEA1maxenergy) and tM O models
(8 % variations). This is particularly true for the b coeffi-cients on tAO (σb = 14ms for tEA1Start and 21ms for
tEA1maxenergy) and tM O models (σb= 46ms).
It should be observed that tEA1Startfeatures correlate well
to both tAO and tM C, despite the lack of a significant cor-relation between these two Doppler instants (r = 0.59). This may be due to the fact that i) tEA1Start detection
instants are more stable than those of tEA1maxenergy
(re-spectively σa = 0.094 and 0.118) and ii) the delay
sepa-rating tM C and tAO (the isovolumic contraction time) is absorbed by the model’s coefficients (b = 37ms for tAO and 5ms for tM C). This phenomenon is similar to the one observed on tAC (small model error) and tM O (large model error), except that here the two Doppler instants are significantly correlated (r = 0.87). 250 300 350 400 450 500 550 250 300 350 400 450 500 CMA feature (ms) tAC (ms)
Learning data base Outliers Model
Figure 2. tAC model estimation from tEA2Start
3.1.
Conclusion
Results clearly demonstrate the feasibility of estimat-ing the mitral and aortic valve closestimat-ing instants from car-diac micro-acceleration features and suggest their poten-tial application in a clinical context. Regarding tAO, we
Table 1. Model performances
CMA feature Method w thres. N µerr σerr rL %out µrT σa σb
tM C tEA1Start Shannon 40ms 0.4 172 12 ms 8 ms 0.89 16 0.88 0.025 0.003
tAO tEA1Start Shannon 80ms 0.6 170 17 ms 13 ms 0.86 35 0.81 0.094 0.014
tAO tEA1maxenergy Shannon 150ms - 170 17 ms 14 ms 0.83 37 0.78 0.118 0.021
tAC tEA2Start Homomorphic 15Hz 0.6 172 9 ms 7 ms 0.98 7 0.96 0.006 0.003
tM O tEA2Start Shannon 80ms 0.2 182 27 ms 17 ms 0.9 62 0.83 0.098 0.046 50 100 150 200 80 100 120 140 160 180 200 220 240 260 280 CMA feature (ms) tAO (ms)
Learning data base Outliers Model
Figure 3. tAO model estimation from tEA1Start
obtained suitable models for two different types of EA1 features. Ongoing work is directed to the improvement of the estimation of mitral valve opening instant. The pro-posed algorithms showed to be robust with respect to envi-ronmental noise and artifacts, usually present on this kind of surface acoustic signals. It would now be relevant to evaluate the stability of the CMA timings during a given hemodynamic configuration, on successive groups of car-diac cycles.
We chose echocardiographic measurements as a gold standard, despite its drawbacks, (i.e. operator dependency, position of the transducer, limited number of beats), be-cause it is still recognized by the physician community as a reference method. These limitations have to be kept in mind, even though we significantly enhanced the reliabil-ity of this reference with specific signal processing tools.
To conclude with, the clinical potential of these CMA features seems really promising, and, combined with ap-propriate implantable sensors and stimulators, could set the grounds for a significant advance in CRT.
Acknowledgements
This work was supported by Sorin Group CRM.The au-tors gratefully acknowledge the assistance of P. Lotton in CHU Rennes, M. Heurteau and L. Graindorge from Sorin Group for their support for data collection.
References
[1] Dupuis JM, Kobeissi A, Vitali L, Gaggini G, Merheb M, Rouleau F, Leftheriotis G, Ritter P, Victor J. Programming optimal atrioventricular delay in dual chamber pacing using peak endocardial acceleration: comparison with a standard
echocardiographic procedure. Pacing Clin Electrophysiol
Jan 2003;26(1 Pt 2):210–213.
[2] Durand LG, Pibarot P. Digital signal processing of the
phonocardiogram: review of the most recent advancements. Crit Rev Biomed Eng 1995;23(3-4):163–219.
[3] Liang H, Lukkarinen S, Hartimo I. Heart sound segmenta-tion algorithm based on heart sound envelogram. In Proc. Computers in Cardiology 1997. 7–10 Sept. 1997; 105–108. [4] Gill D, Gavrieli N, Intrator N. Detection and identification
of heart sounds using homomorphic envelogram and self-organizing probabilistic model. In Proc. Computers in Car-diology. Sept. 25–28, 2005; 957–960.
[5] Marcus FI, Sorrell V, Zanetti J, Bosnos M, Baweja G, Perlick D, Ott P, Indik J, He DS, Gear K. Accelerometer-derived time intervals during various pacing modes in patients with biventricular pacemakers: comparison with normals. Pacing Clin Electrophysiol Dec 2007;30(12):1476–1481.
[6] Chung ES, Leon AR, Tavazzi L, Sun JP, Nihoyannopoulos P, Merlino J, Abraham WT, Ghio S, Leclercq C, Bax JJ, Yu CM, Gorcsan J, Sutton MSJ, Sutter JD, Murillo J. Results of the predictors of response to crt (prospect) trial. Circulation May 2008;117(20):2608–2616.
[7] Zuber M, Toggweiler S, Quinn-Tate L, Brown L, Amkieh
A, Erne P. A comparison of acoustic cardiography and
echocardiography for optimizing pacemaker settings in car-diac resynchronization therapy. Pacing Clin Electrophysiol Jul 2008;31(7):802–811.
[8] Plicchi G, Marcelli E, Parlapiano M, Bombardini T. Pea i and pea ii based implantable haemodynamic monitor: pre clinical studies in sheep. Europace Jan 2002;4(1):49–54.
Address for correspondence: Lionel Giorgis
LTSI Universit´e de Rennes 1 Campus de Beaulieu Bat. 22 -35042 RENNES - FRANCE - lionel.giorgis@sorin.com