HAL Id: hal-01134429
https://hal.archives-ouvertes.fr/hal-01134429
Submitted on 23 Mar 2015HAL is a multi-disciplinary open access
archive for the deposit and dissemination of sci-entific research documents, whether they are pub-lished or not. The documents may come from teaching and research institutions in France or abroad, or from public or private research centers.
L’archive ouverte pluridisciplinaire HAL, est destinée au dépôt et à la diffusion de documents scientifiques de niveau recherche, publiés ou non, émanant des établissements d’enseignement et de recherche français ou étrangers, des laboratoires publics ou privés.
Effect of bubble’s arrangement on the viscous torque in
bubbly Taylor- Couette flow
Georges Ndongo Fokoua, Céline Gabillet, Adrien Aubert, Catherine Colin
To cite this version:
Georges Ndongo Fokoua, Céline Gabillet, Adrien Aubert, Catherine Colin. Effect of bubble’s arrange-ment on the viscous torque in bubbly Taylor- Couette flow. Physics of Fluids, American Institute of Physics, 2015, 27, pp.034105-1 à 034105-34. �10.1063/1.4915071�. �hal-01134429�
Science Arts & Métiers (SAM)
is an open access repository that collects the work of Arts et Métiers ParisTech researchers and makes it freely available over the web where possible.
This is an author-deposited version published in: http://sam.ensam.eu Handle ID: .http://hdl.handle.net/10985/9419
To cite this version :
Georges NDONGO FOKOUA, Céline GABILLET, Adrien AUBERT, Catherine COLIN - Effect of bubble’s arrangement on the viscous torque in bubbly Taylor Couette flow Physics of Fluids -Vol. 27, p.034105-1 à 034105-34 - 2015
Effect of bubble’s arrangement on the viscous torque in bubbly Taylor-Couette flow
G. Ndongo Fokoua,1) C. Gabillet,1,a) A. Aubert,1) C. Colin,2) 1
IRENav, Institut de Recherche de l’Ecole Navale, Lanvéoc Poulmic, Brest, France
2
University of Toulouse, INPT-UPS, Institut de Mécanique des Fluides de Toulouse-CNRS, 31400, Toulouse-France
An experimental investigation of the interactions between bubbles, coherent motion and viscous drag in a Taylor-Couette flow withthe outer cylinder at rest is presented. The cylinder radii ratio η is 0.91. Bubbles are injected inside the gap through a needle at the bottom of the apparatus. Different bubbles sizes are investigated (ratio between the bubble diameter and the gap width ranges from 0.05 to 0.125) for very small void fraction (α0.23%). Different flow regimes are studied corresponding to Reynolds number Re based on the gap width and velocity of the inner cylinder, ranging from 6.102 to 2.104. Regarding these Re values, Taylor vortices are persistent leading to an axial periodicity of the flow. A detailed characterization of the vortices is performed for the single-phase flow. The experiment also develops bubbles tracking in a meridian plane and viscous torque of the inner cylinder measurements. The findings of this study show evidence of the link between bubbles localisation, Taylor vortices and viscous torque modifications. We also highlight two regimes of viscous torque modification and various types of bubbles arrangements, depending on their size and on the Reynolds number. Bubbles can have a sliding and wavering motion near the inner cylinder and be either captured by the Taylor vortices or by the outflow areas near the inner cylinder. For small buoyancy effect, bubbles are trapped, leading to an increase of the viscous torque. When buoyancy induced bubbles motion is increased by comparison to the coherent motion of the liquid, a decrease in the viscous torque is rather observed. The type of bubble arrangement is parameterized by the two dimensionless parameters C and H introduced by Climent et al. [E. Climent, M. Simonnet and J. Magnaudet, Phys. Fluids 19, 083301(2007)]. Phase diagrams summarizing the various types of bubbles arrangements, viscous torque modifications and axial wavelength evolution are built.
Keywords: bubble dispersion, viscous torque, Taylor vortices
I. INTRODUCTION
In the context of naval hydrodynamics, bubble injection in the turbulent boundary layer of ship’s hull appears as a promising solution to reduce the hull viscous resistance. However, despite several attempts in this field, the physical mechanisms implied into the bubbly drag reduction are to the best of our knowledge, not completely understood1. Consequently, it is still non straightforward to extrapolate results obtained for small scale models to large scale ship’s hull model. Moreover, a bubble injection system that is appropriate for a typical ship’s hull and a specific velocity range can be no more fitted when it is carried out for a different ship hull and/or other velocity ranges2. Therefore, there is still a need to develop theoretical research and applied experiments oriented to a better understanding of bubbly drag reduction.
a)
A Taylor-Couette flow can be considered as a valuable configuration to study bubble induced modifications of the viscous drag. It is a closed system and characterizing the viscous drag implies to measure the viscous torque applied on the inner cylinder. Moreover, for moderate to high Reynolds numbers, the Taylor-Couette flow has several similarities with the turbulent boundary layer flow that develops over a flat plate. In particular, in the very near wall region of inner and outer cylinders, there is an inner layer of constant shear stress and negligible curvature effect characterized by a linear evolution of the azimuthal velocity with respect to the distance from the wall3. Farther from the wall, the azimuthal velocity follows a logarithmic law as observed in turbulent channel flows and for high Reynolds numbers (Re>106), the slope asymptotically tends to the Von Karman constant4. Furthermore, in the transition regime, the occurrence of Taylor contra-rotating vortices (with associated inflow/outflow jets regions) is very similar to the energetic turbulent structures, taking place in the very near wall region over a flat plate5.
In a Taylor-Couette flow, several contributions to the bubble dynamics can be observed such as the mean azimuthal flow, the large scale Taylor vortices, waviness and its modulation for low Reynolds numbers and small scale turbulent structures for moderate to high Reynolds numbers. Thus injecting bubbles in such a flow is a valid direction to explore, because bubbles can interact with these different kinds of structures and can lead, for very specific conditions, to viscous torque reduction. In the literature, the bubbly drag reduction in the Taylor-Couette flow was studied for the outer cylinder at rest.
In the case of bubbles smaller than the Kolmogorov length scale, a torque reduction was observed for the modulated wavy vortex flow. For this particular regime, such reduction is rather linked to an inhomogeneity of the bubble distribution, following the waviness motion, this leading to a stabilization of the flow, as if the effective Reynolds number weredecreased6.
For bubbles larger than the Kolmogorov length scale, torque reduction is likely to be associated either with a de-structuration of the Taylor vortices by the bubble upward motion in the case of weak turbulent and turbulent Taylor vortex flow7,8 or associated with the deformation of the bubbles in the case of the high Reynolds numbers (Re>8 105)9-12. According to Murai et al.7, there is a Reynolds number range, for which the relative contribution of the Taylor vortices to the global flow and the contribution of the bubble deformation are too small to bring about torque reduction, thus leading on the contrary to a torque increase. Nevertheless, a common point when viscous torque reduction was observed is the existence of a void fraction peak near the inner cylinder wall. It is then worth trying to characterize the bubble dispersion in this typical flow and trying to understand the link between the bubble dispersion and the viscous drag increase or decrease at the inner cylinder.
Numerical analysis of the bubble dispersion for the first instabilities was firstly performed by DNS and one way coupling13. In this framework, bubbles were considered as passive tracers. Preferential accumulation of the bubbles in the axial and radial directions was discussed as a function of dimensionless parameters which compare the respective contributions of buoyancy, Taylor vortex trapping and inner cylinder wall’s attraction induced by the mean azimuthal flow. Based on the same approach, Chouippe et al.3 conducted numerical study of bubble dispersion in turbulent Taylor-Couette flow. For very small bubbles, the size of which was of the order of the viscous length scale, it appears that the small scale turbulence can also play a role, by trapping bubbles inside the low shear stress streaks near the inner cylinder. But two-way coupling calculations performed by Sugiyama et al.8 highlighted that numerical results of the bubble dispersion near the wall are very sensitive to the modelling of the lift force coefficient. Overall, the numerical prediction of the bubble accumulation near the inner cylinder wall is over-evaluated, without taking into account bubble-bubble interactions3. This stresses the need
for the development of the appropriate experiments that will study the bubble distribution in Taylor-Couette flow.
Dispersion of bubbles in a Taylor-Couette flow was studied experimentally for different geometries (different radii ratios) and different Reynolds number ranges. For the weak turbulent flow and turbulent Taylor vortex flow, it was highlighted that bubbles have preferential accumulation regions, depending on the bubble size to the gap width ratio (db/d)
and the Reynolds number: either in the Taylor vortices or in the outflow region near the inner cylinder7,14-16. For the turbulent flow, there is a preferential accumulation near the inner cylinder with a homogeneous axial distribution12.
In the case of experimental study of bubble dispersion inside Taylor-Couette flow, as the void fraction was characterized by intrusive method (optical probes), very few profiles of void fraction has been so far studied in the literature12,15,17,18. Optical probes can measure the radial distribution of the void fraction at a given axial position but they do not enable to characterize the axial distribution when it is subjected to the Taylor vortices. Therefore, performing fine measurements of the void fraction axial and radial distribution, when bubbles are injected inside a Taylor-Couette flow, according to the flow conditions (radii ratio, bubble size to gap ratio, Reynolds number) is of interest. This will favour a better understanding of the bubble-induced modifications of the wall shear stress.
The objective of this paper is to shed more light in the mechanisms of bubble interactions with the wall shear stress in a Taylor-Couette flow by focussing on the link between the bubble dispersion and the viscous torque. For this purpose, the viscous torque is measured at the inner cylinder and bubble tracking in the gap is achieved. The studies are carried out in an experimental setup of same geometry as in Mehel17 and Mehel et al.15,19, corresponding to a radius ratio of 0.91. The Reynolds number range [6.102, 2.104] investigated in this study is larger than in Mehel15, 17, 19. Two typical bubbles diameters db (db/d=0.125 and 0.05, d being the
gap) are tested. In order to enable the characterization of the bubble dispersion by visualisations, the global void fraction was willingly limited to a small value (α<0.23%), smaller than in Mehel15, 17, 19.
This paper is organized as follows. The next section is devoted to the description of the experimental facility. Characterization of the flow structure and viscous torque measurements in the single-phase flow are also shown and discussed in this section. The section ends with a description of a specific measurement technique for tracking of bubbles. Section 3 is devoted to the characterization of the two-phase flow: we present the void fraction distributions, the Eulerian velocity fields of the gas-phase measured in a meridian plane and the viscous torque measured in two-phase flow. Section 3 also develops a comparison of our results with related work, discussions about bubbles localization are made and the phase diagrams, which summarize the various types of bubbles arrangement, are built. Lastly section 4 concludes the paper and outlines further work.
II. DESCRIPTION OF THE EXPERIMENTAL SETUP AND SINGLE-PHASE CHARACTERISTICS
A. Experimental device
Figure 1 shows a sketch of the experimental setup. The experiments were carried out in a vertical Circular Couette-Taylor device, composed of concentric inner and outer cylinders. The outer cylinder was at rest. The radius of the inner and outer cylinders are Ri=200 mm and
Ro=220 mm respectively, the height L of the inner cylinder is 886mm. The device’s geometry is
characterized by a radius ratio η=
0 i
R
R equal to 0.91 and a clearance ratio Γ= d L
of 44.3. The gap, the width of which being d=20mm, was filled with a mixture of water and glycerol, with a free surface 1cm above the inner cylinder. The device is the same as the one used in Mehel17, set apart that the motor is displaced from the bottom to the top of the device, to ensure a better seal and make easier the installation of a torquemeter. The bubble generation system isalso different (bubble injection instead of ventilation by the free surface or gaseous cavitation in Mehel17). A further modification with respect to Mehel17lies in the fact that the device can be enclosed into a Plexiglas box, filled with the same mixture as in the gap, in order to limit optical distortion effect.
The Reynolds number of the flow Re is defined as:
1 Re d Rii The Taylor number is defined as follows. It enables a correction of the Reynolds number, taking into account the curvature effect:
2 1 Re2 TaThe Reynolds number was varied by both changing the angular velocity of the rotating inner cylinder Ωi (radian/s) and the viscosity of the mixture (mixture of 65% glycerol or 40%
glycerol). For the geometry at stake, the critical values of Re and Ta, characteristic of the first instability, are Rec=137 and Tac =187517, respectively. Attention was paid to reproduce the
same start up procedure to achieve a given Reynolds number as in Mehel et al.19, leading to same state of the flow for the single-phase flow.
Regarding the two-phase flow, air injection began before the start-up of the motor. A similar procedure of the acceleration of the inner cylinder has been applied in a two-phase flow as in a single-phase flow. Individual bubbles were generated through a needle in a box filled with the mixture at rest localised at the bottom of the apparatus. This leads to a continuous air supply localized at a single point in the azimuthal direction below the annulus. The injection pressure was controlled by a manometer of accuracy ±0.01bar. Different needles diameters were used (ɸc=20µm and ɸc=180µm), leading to different mean bubble size (db between 1mm and
2.5mm), depending on the water glycerol mixture used. The injection was characterized by video recording apart for different conditions. The results on injection pressure, bubble size, air injection flow rate are summarized in Table I.
Vb is the bubble rising velocity, determined in infinite and still mixture, based on the bubble
size, a viscosity of the mixture at 20°C and a modellingof the drag force coefficient following the formulation of Maxworthy et al.20. Vi is the inner cylinder rotational velocity. For the
smallest needle, the air flow rate Qg was determined by video recording of the bubble size and
frequency at detachment. For the largest needle, Qg was measured with an airflow meter
(Gilmont instrument, ref. GF-4001). As can be seen, the global air injection rate Qg was very
small, in order to achieve individual bubbles tracking by visualisations inside the gap. <α> is deduced here from the air flow rate and the bubble rising velocity, it is representative of the global void fraction obtained in still mixture in the gap.
FIG. 1 Sketch of the experimental setup
TABLE I Characteristics of the bubble injection for the different air injection conditions
Mix c (µm) P (bar) db (µm) Qg x10 -8 (m3/s) Vb (m/s) <α>x10-4 (20°C) (m2/s) Re Vb/Vi 65% 180 1.08 2500 66.7 0.092 2.89 18.17 632 0.077 ±0.01 ±90 ±1.6 X10⁻⁶ to to 20 6.5 1000 4.3 0.022 0.77 18.17 3162 0.16 ±0.01 ±47 ±0.8 X10⁻⁶ 40% 180 1.2 2500 66.7 0.21 1.28 5.14 1897 0.11 ±0.01 ±90 ±1.6 X10⁻⁶ to to 20 6.5 1000 2.7 0.054 0.2 5.14 2x10⁴ 0.43 ±0.01 ±47 ±0.6 X10⁻⁶
B. Specific instrumentation dedicated to viscous torque measurements
The torquemeter (KISTLER, reference 4503A) is composed of strain gauges. It was mounted on the shaft,which drives the rotation of the inner cylinder. The measurement range was chosen according to the Reynolds number value: it was set to [0-4Nm] for Re<104, otherwise it was set to [0-20Nm]. The torquemeter ensures the measurement of the torque with a global accuracy of ±0.1% of the measurement range, taking into account linearity and hysteresis errors. The systematic error due to temperature drift in the range [15°C-25°C] is 0.015% of the measurement range per degree. It leads to a possible systematic error less than 0.5% of the measured value. Data are collected by a 24 bits acquisition board, the output voltage level being in the range 0-10V.
For a measurement time of 60s, and a sampling frequency of 1 kHz, the statistical convergence of the time averaged torque was ensured with a maximum relative uncertainty of ±0.17% (confidence level of 95%).
The measured torque includes both the contribution of the mechanical torque due to connection between the shaft and the inner cylinder and the contribution of the viscous torque exerted by the flow on the inner cylinder. The mechanical torque was characterized as a function of the rotational velocity for the gap filled with air and subtracted to the global measured torque.
C. Characterization of the viscous torque in single-phase flow
The normalized viscous torque G (Eq. (3)) obtained in single-phase flow is plotted with respect to the Reynolds number in Appendix A for the different mixtures. Comparison is made with the correlation of Wendt21 applied for a value of η=0.91. The torque expands as a power scaling law of the Reynolds number. For Re<104, the power scaling law is GRe1.53 for the mixtures of 40% and 65% plotted together. Compared to Wendt21, the power is slightly higher (2%). Beyond Re = 104, Wendt21 proposes a power scaling law GRe1.7 which is confirmed by our experiments.
3 2 L T G The studies of Eckhardt et al.22,23and van Gils et al.24 drawn the analogy between turbulence in Taylor-Couette flow and Rayleigh-Bernard convection. In this framework, it is possible to introduce a Nusselt number Nu, associated to the viscous torque and representative of the transverse current of the azimuthal motion. The Nusselt number is expected to be less sensitive to the geometry than the normalized torque G. Nu is defined as:
4lam
G G Nu
Glam being the normalized torque of the analytical Couette solution:
5 1 2 2 2
i i lam R GFor high Reynolds number, the Nusselt number is expected to scale with the Reynolds number as: Nu~Re0.78 independently of the radius ratio, which corresponds to the so called ultimate regime11. For lower Reynolds numbers, numerical investigation of Ostilla et al.25 proposed a local power scaling as: Nu~Re0.66, with a change in the local scaling above Ta>3. 106 for η=0.909. For Reynolds number in the same range as in our study, testing different radius ratio, Chouippe et al.3 obtained numerically a scaling law following Nu=0.04Re0.617, in agreement with the results of Merbold et al.26 showing a power scaling as: Nuw~Res0.62 for 3.103Re8.104.
Figure 2 displays the Nusselt number with respect to the Reynolds number measured for our geometry in single-phase flow. It highlights two local power scaling laws, the exponent being different according to the Reynolds range: exponent is close to 0.53 for 200Re1000 and 0.62 for 1800Re2.104, in agreement with the results of Merbold et al.26and Chouippe et al.3.
FIG.2 Dependency of the Nusselt number on the Reynolds number, plotted in log-log coordinates. For the mixture of 65%, Re number ranges from 632 to 3162. For the mixture of 40%, Re number ranges from 1897 to 2.104
D. Characterization of the single-phase flow structure
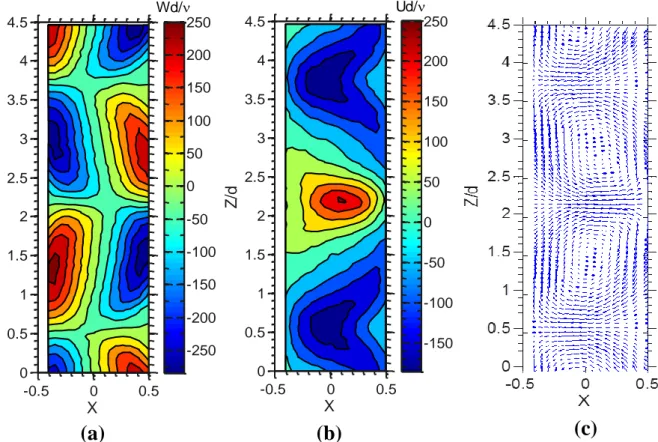
As an indication of the flow structure for Re=2214/Ta=49 104, figure 3 displays the maps of the axial and radial components of the mean velocity obtained in single-phase flow, by particle image velocimetry (PIV) in a meridian plane. The PIV system from Dantec Dynamics, composed of two-cavities pulsed laser new wave Gemini Solo 2 associated with a High sense PIV/LIF camera and a lens Sigma 105mm was used. The field of view is 1.1d x 4.5d leading to ascale’s factor of73µm/pixel. The mixture was seeded with 1-50µm fluorescent particles. PIV processing was applied for a 32pixels x 32pixels window (ie: 0.11d x 0.11d) with an overlap of 50%. PIV images were finally processed to correct optical distortion (same optical correction applied as for bubble tracking, the procedure isdescribed in appendix D).
Figure 3 shows a visualization of the contra-rotating Taylor vortices and the inflow and outflow jets, relatively to the inner cylinder. The maps show an axial periodicity of the flow, which is characterized by the axial wavelength of 3.25d for this Reynolds number and this geometry.
For the single phase-flow, the axial component of the velocity induced by the Taylor vortices W, as well as the associated axial wavelength λ were characterized by PIV. Evolutions of normalized λ with respect to the Reynolds number are shown in Fig. 21 of Appendix B.
FIG. 3 Maps of the average velocity in single-phase flow obtained by PIV in a meridian plane (radial-vertical plane). Mixture 65%, Re=2214/Ta=49 104, this structure of the flow corresponds to weak turbulence. (a): axial velocity, (b radial velocity, (c): velocity field.On these maps, the radial and axial positions are normalized by d and the velocity components are normalized by /d. The dimensionless radial position X is defined as X=r-(Ro+Ri)/2d, the zero position being the middle of the
gap and X=-0.5 being the position of the inner cylinder.
E. Specific measurement technique dedicated to bubble tracking and gas-phase Eulerian characterization in a meridian plane
A dichroic lamp ABI 4J446 GU5,3EXN/C, providing a continuous ombroscopic lighting of 50W, associated with a photron Fastcam SA3 camera (8 bits, 1024 x 1024 pix2) and a Sigma 105 mm macro lens (f2.8) were used to visualize the bubbles in a meridian plane aligned with a radius (plane (r-z)). The focusing meridian plane was localized at the opposite side from the bubble injection point. The shutter speed was adjusted to 1/6000 s. The sampling frequency fe
was adjusted between 250Hz and 500Hz, following a linear evolution with respect to the inner cylinder’s rotational velocity. With these values of the sampling frequency, the bubble displacement in the meridian plane is larger than one pixel and smaller than a bubble diameter. It enables to follow bubbles along their trajectories during at least 20 time steps, before they
X Z /d -0.5 0 0.5 0 0.5 1 1.5 2 2.5 3 3.5 4 4.5 Wd/ -250 -200 -150 -100 -50 0 50 100 150 200 250 X Z /d -0.5 0 0.5 0 0.5 1 1.5 2 2.5 3 3.5 4 4.5 Ud/ -150 -100 -50 0 50 100 150 200 250
(a)
(b)
(c)
leave the depth of field imposed in this study. A sketch of the setup is shown in Fig. 4.
For this configuration, the device was enclosed into an optical correction box, filled with the same mixture as in the gap. The size of the viewing window was reduced to 512 x 1024 pix2 (ie: 1.88d x 3.77d in the radial and axial direction, respectively), the size of the pixel being 72-75 µm, according to the glycerol mixture used. As the axial length of the field of view can be less than the axial wavelength, the camera can be displaced axially and the images can be recomposed.
The spatial resolution was quantified based on the line spread function, defined as the derivative of the intensity in the direction normal to a sharp edge. For this purpose, a reference pattern made of alternative black and white lines (25 lines per inch, see Appendix E) was used. The effective spatial resolution was deduced from the width at half the maximum value of the line spread function, ie: 294 µm, making possible to detect with a good contrast bubbles larger than 588 µm.
FIG. 4 Top view of the setup for bubbles tracking. V is the azimuthal velocity of each bubble in laminar flow, r is the real
radial position, is the angular position of the bubble in the azimuthal direction, XA is the radial position in the camera’s
frame and e represents the depth of field on either side of the meridian plane (the overall depth of field being 2e)
For the Taylor-Couette configuration, it was necessary to reduce the contribution of the azimuthal velocity of the bubbles to the radial velocity measured in the camera’s frame. Thus, we developed an original procedure, which enabled to reduce the depth of field to 2e = 2.8 cm, instead of 12 cm. For this depth of field, the contribution of the azimuthal velocity to the determination of measured radial velocity was reduced to 7% and the relative error of radial positioning was less than 0.3%. This procedure was based on the application of specific threshold laws on the grey levels evolution of each bubble along its trajectory. The thresholds were calibrated based on bubble trajectories in the laminar flow. The processing associated to bubble detection, bubble trajectories building, depth of field discrimination, and laminar calibration is discussed in details in Appendix C. Validation of the Lagrangian bubble characteristics (size and velocities components is also addressed in this Appendix).
The Eulerian properties of the gas, such as the void fraction distribution as well as the mean Eulerian velocity field in the meridian plane were deduced from the bubble Lagrangian tracking. For this purpose, the field of view was regularly meshed. The procedure is deeply described in Appendix D.
The mesh size was quite adjusted to the bubble size, leading to spatial resolutions of 0.05d and 0.11d, for the needles diameter of ɸc=20µm and ɸc=180µm, respectively. For this spatial
resolution and for a measurement time larger than 6s (ie: several thousands of images according to the sampling frequency), statistical convergence of the mean values was ensured. The uncertainties due to statistical convergence as well as the deviation errors expected for the Eulerian variables are summarized in Table IV and Table V of Appendix D. Validation of the void fraction measurement is also addressed in the same Appendix.
In order to correct optical distortion, a correction was applied on void fraction and Eulerian velocity maps. The procedure which is described in Appendix E, leads to a global uncertainty on the radial positioning less than 424 µm (0.02d).
III. CHARACTERIZATION OF THE TWO-PHASE FLOW
This section starts with a discussion on the dimensionless parameters characterizing the localisation of the bubbles in the gap. Next, the overall arrangement of the bubbles is presented. We also discuss the Eulerian structure of the gas-phase based on the void fraction maps and velocity fields, time-averaged in the meridian plane. The local arrangement of the bubbles in the gap is discussed based on the analysis of the Eulerian maps. For the two-phase flow, modifications of the axial wavelength, upward gas velocity and modifications of the viscous torque applied on the inner cylinder are also quantified. The end of the section is devoted to the phase diagram of the bubble arrangement as a function of dimensionless parameters. Based on this phase diagram, the link between the bubble arrangements, and the observed trends for the bubble induced axial wavelength and torque modification is discussed.
A. Two phase-flow parameters characterizing the local arrangement of the bubbles in the gap
Based on the control parameters of the two-phase flow, dimensionless parameters such as Re, Fr= i i R g V ,η and d db
are commonly considered as the influent parameters characterizing the two-phase flow. Fr is representative of the ratio between two forces applied on the bubbles in different directions (radial added mass force driven by the rotation of the inner cylinder and axial buoyancy force) and thus is not suited for describing bubble equilibrium positions in the flow. A similar conclusion can be drawn for the Reynolds number, which doesn’t compare inertia and viscous force applied on a bubble but rather on a volume of fluid. Thus, even if these parameters are directly obtained from the operating conditions, they do not have physical meaning, in terms of bubble localisation in the gap.
Considering the main forces applied on the bubbles, in the radial and axial directions, Climent et al.13 introduced dimensionless parameters to numerically characterize the bubble accumulation into a Taylor-Couette flow for the first instabilities. This approach was extended for the turbulent Taylor vortex flow by Chouippe et al.3. The comparison between the centripetal force induced by the Taylor vortices and the centripetal force due to the inner cylinder rotational velocity, defined as parameter H, makes possible to characterize the radial accumulation of the bubbles. It appears that an important value of parameter H (Eq. (6)) leads
to a bubble trapping inside the Taylor vortices, whereas a small value is in agreement with accumulation of the bubbles near the inner cylinder. H depends on the Reynolds number and the geometry of the Taylor-Couette device η. For the geometry of this study, the evolution of H with regard to the Reynolds number in single phase-flow is shown in Fig. 22 of Appendix B. A large gap leads to a smaller value of H, as shown by numerical simulations of Chouippe et al.3, performed in single-phase flow.
6 4 2 d R V W H i i The ratio between the axial velocity of the Taylor vortices and the bubble rising velocity, defined as parameter C (Eq. (7)) is expected to characterize the axial localisation of the bubbles. Indeed, a small value of C is representative of important buoyancy effects. If C is very small by comparison to 1, it can lead to bubbles rising regardless of the coherent motion, if C is in the order of 1, it can bring about a bubble accumulation either in the Taylor vortices or in the outflow region near the inner cylinder, according to the value of H. With an important value of C, one can expect an axially uniform accumulation of the bubbles near the inner cylinder.
7b
W W C
Assuming that bubbles are being captured when the axial pitch of their helical trajectory adjusts the value of the axial wavelength, bubbles may be trapped when parameter H satisfies the following condition:
8 2 2 2 2 2 C R d d H i Here β denotes the ratio between the azimuthal velocity of the bubbles and the azimuthal velocity of the inner cylinder. β depends on the localisation of the bubbles in the gap, when being trapped and on the drift velocity of the bubbles. For bubbles trapped in the core of the vortices, the azimuthal drift velocity is expected to be negligible 14,17, leading to a coefficient β of the order of 0.5, regardless of the geometry, the Reynolds number and the bubble size. A new parameter Hnew, is obtained by normalizing the parameter H as follows:
9 2 d HR Hnew iThe parameter Hnew takes into account the influence of the geometry on the bubble capture by
the vortices, through the variation of the axial wavelength. The axial wavelength is overall the more sensitive to the Reynolds number, when the gap is smaller.
The parameters C and H (or Hnew) only characterize the interactions between the bubbles and
the large scales of the flow. In the case of turbulent flow, another parameter db+ (Eq. (10),
be introduced. As a first approximation, db+ can be based on the viscous length scale, deduced
from the friction velocity (Eq. (11). A small value of db+ will entail a bubble capture by the
small scale turbulent structures, rather in the streaks of minimum wall shear stress, near the inner cylinder, as observed by the numerical calculations of Chouippe et al.3,27. For the turbulent Taylor vortex flow, the streaks of minimum wall shear stress are rather localised in the outflow region, with a periodical axial arrangement of 100 viscous length28.
10 * u d db bWith u*, the friction velocity taking into account curvature effects. u* is defined as:
11 * i i u i is the wall shear stress at the inner cylinder, deduced from the dimensionless torque G:
12 2 2 2 i i R G B. Overall arrangement of the bubbles in the gap
1. Effect of the Reynolds number
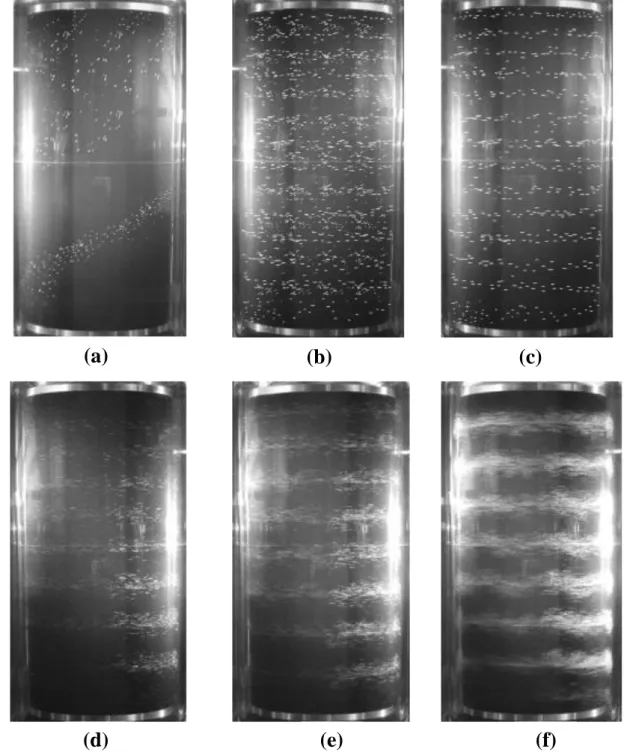
Figure 5 depicts instantaneous pictures of the bubble global arrangement in the setup for different Reynolds number, in the mixture of 40% glycerol, the size of bubbles being 1 mm. The visualization system was localized at the opposite side from the bubble injection system. It enables to visualize the entire height of the annulus, with a large view angle.The white traces are the bubbles scattering the light. The inner cylinder which, was painted in black to improve the contrast appears as a dark background. The following remarks can be made through these visualizations:
FIG. 5Visualizations of the two-phase arrangement as a function of Re number. Traces of bubbles are visible for several wavelengths over the height of the device by integrating an exposure time of 20ms. Mixture 40%, db=100047µm
Vb=0.054m/s (a) : Re=3162/Ta=106, (b) : Re=5060/Ta=2.56 106, (c) : Re=7906/Ta=6.25 106, (d) : Re=11068/Ta=1.23 107, (e) :
Re=17393/Ta=2.03 107, (f) : Re=20000/Ta=4 107
Without any flow, the bubbles have a purely upward trajectory. The rotation of the inner cylinder will cause the inclination of their path, which implies a helical movement (Fig. 5(a)). For low rotational speed of the inner wall, bubble rising velocity is higher than the inner cylinder velocity so, despite the presence of the Taylor vortices, bubbles do not organize into any clear structure (Fig. 5(b)). When the rotational velocity of the inner cylinder is increased, a clear organized structure of the bubbles distribution occurs. Bubbles distribute periodically in the axial direction as a horizontal string (Fig. 5(c)). The string spacing could be identified as the
(a)
(b)
(c)
(a)
(b)
(c)
overall axial wavelength, assuming that the flow is not axially stratified. Comparison of Fig. 5(d), Fig. 5(e) and Fig. 5(f), shows that an increase of the Reynolds number leads to both a thickening of the bubble strings and an increase of the bubble accumulation into the strings.
For high Re number, we have evidenced the occurrence of a transient phenomenon characterized by a spiral accumulation pattern of the bubbles. This phenomenon is due to a collective effect of the bubbles. It can lead to coalescence of a vortices pair, as observed by Yoshida et al.16. This transient phenomenon, which is very localized in time, has not been analyzed in this work. For this purpose, in case of high Reynolds numbers for which the phenomenon was expected, all the measurements (torque measurements and bubbles tracking) were performed during the time sequence while bubbles were organised as horizontal strings.
2. Effect of the rising velocity of the bubbles
Figure 6 illustrates the effect of the rising velocity of the bubbles on their dispersion in the gap. It can be observed that, the higher the rising velocity of the bubbles is, the less they accumulate into horizontal strings. Comparison between Fig.5(a) and Fig.6(b), as well as comparison between Fig.6(a) and Fig.6(c) shows evidence that bubble trapping by the flow structure occurs for a larger Reynolds number when increasing the bubble rising velocity.
The study of overall arrangement of the bubbles shows that, while the overall visualization of the bubbles can highlight the string structure, it does not allow to locate precisely the bubbles in the gap. It is therefore necessary to make an individual tracking of the bubbles, which is the purpose of next sections.
FIG. 6 Visualizations of the two-phase arrangement for different rising velocity of the bubbles at Re=3162/Ta=106. (a): Mixture 65%, db=250090µm, Vb=0.092m/s, (b): Mixture 65%, db=100047µm, Vb=0.022m/s (c): Mixture 40%,
C. Structure of the Eulerian distribution of the gas in a meridian plane
1. General features
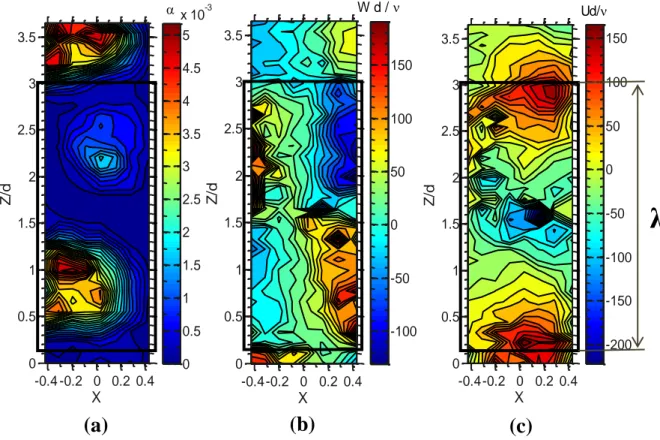
Figure 7 shows an example of void fraction and velocity components distributions, obtained when bubbles are trapped by the Taylor vortices. This allows us to highlight some general features of the gas-phase mean Eulerian flow.
Alternation of the sign of the axial velocity evidences the entrapment of the bubbles inside the contra-rotative Taylor vortices. It can be also observed an asymmetry between positive and negative axial velocities of the gas-phase, the positive velocity being greater, due to a buoyancy effect. Alternation of the sign of the radial velocity outlines the inflow and outflow jets relative to the inner cylinder.
Comparison with Fig. 3, highlights that the gas-phase averaged flow has a drift velocity by comparison to the single-phase liquid flow.
FIG. 7 Eulerian maps of the gas-phase, Mixture 65%, db=100047µm , Re=2214/Ta=4.9 105. (a): void fraction, (b): axial
velocity, (c): radial velocity. (Integration area is shown on the viewing window)
Based on the local phase averaged axial velocity of gas, a criterion for bubble capture by the vortices can be defined. Bubbles were considered to be trapped into strings when the axial gas-phase velocity exhibits negative values. This criterion has been applied to discriminate bubble capture from no bubble capture. The critical Reynolds number leading to bubble capture is given in Table II for the different configurations of the experiments (different bubble sizes and different mixtures). Similar critical values for bubble capture were obtained based on the views of the bubble global arrangement.
λ
X Z /d -0.4 -0.2 0 0.2 0.4 0 0.5 1 1.5 2 2.5 3 3.5 0 0.5 1 1.5 2 2.5 3 3.5 4 4.5 5 x 10⁻³ X Z /d -0.4-0.2 0 0.2 0.4 0 0.5 1 1.5 2 2.5 3 3.5 W d / -100 -50 0 50 100 150 X Z /d -0.4-0.2 0 0.2 0.4 0 0.5 1 1.5 2 2.5 3 3.5 Ud/ -200 -150 -100 -50 0 50 100 150(a)
(b)
(c)
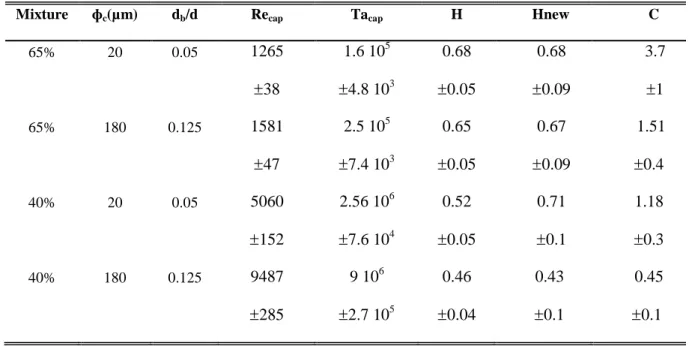
TABLE II Values of the dimensionless parameters leading to bubble capture, for the different configurations of the experiments
Mixture ɸc(µm) db/d Recap Tacap H Hnew C
65% 20 0.05 1265 1.6 105 0.68 0.68 3.7 38 4.8 103 0.05 0.09 1 65% 180 0.125 1581 2.5 105 0.65 0.67 1.51 47 7.4 103 0.05 0.09 0.4 40% 20 0.05 5060 2.56 106 0.52 0.71 1.18 152 7.6 104 0.05 0.1 0.3 40% 180 0.125 9487 9 106 0.46 0.43 0.45 285 2.7 105 0.04 0.1 0.1
There is no unique value of parameter C at the capture. For H>0.25, the capture can occur for a value of C<2 at the contrary of Climent et al.13 observation.
2. Different kinds of local arrangement of the bubbles
The objective of this part is to study the effect of buoyancy (through varying the viscosity of the mixture and the bubble size), as well as the effect of the Reynolds number on the bubble arrangement in the gap. Unfortunately, it is not possible to test experimentally the influence of these variables separately. Indeed, for a given bubble size, C increases as H decreases with the increasing of the Reynolds number. Table III reports the two-phase flow configurations, for which the Eulerian cartographies of the gas-phase are displayed. These flow conditions were selected, because the gas Eulerian cartographies of each of them illustrated the various types of bubble arrangement observed in the framework of the present study. Cases 1 to 3 exhibit different arrangements for same bubble size and same viscosity, when increasing the Reynolds number. Case 4 corresponds to same bubble size as the previous cases but with an increase of the Reynolds number and an increase of the rising velocity by changing the viscosity. Case 5 illustrates the influence of the bubble size for same Reynolds number and same viscosity. Case 6 corresponds to a condition of high Reynolds number and large bubbles, thus leading to large void fraction.
TABLE III Dimensionless parameters characterizing the two-phase flow for different operating conditions for which mean Eulerian cartography of the gas-phase volume fraction and velocity components are displayed (<α>r,z denotes the measured
gas-phase volume fraction integrated radially and axially, upon the axial wavelength; it has been determined only in case of bubble capture by the vortices, for which it is also representative of what happens in the azimuthal direction)
Mix db (µm) Re Ta Wd/ C H Hnew db+ <α>r,z (%) Arran- gement Case 65% 1000 949 9 113 1.52 0.72 1.07 3.77 - Wavering 1 ±47 x104 65% 1000 2214 4.9 268 3.53 0.61 0.63 7.12 0.14 Up-Down 2 ±47 x105 65% 1000 2846 8.1 341 4.39 0.58 0.60 8.59 0.16 Up-Down 3 ±47 x105 -Outflow 40% 1000 5060 2.56 577 1.13 0.52 0.71 4.63 0.06 Up 4 ±47 x106 40% 2500 5060 2.56 577 0.29 0.52 0.71 11.12 - Upward- 5 ±90 x106 Sliding 40% 2500 9487 9 1027 0.46 0.46 0.51 17.84 0.23 Up- 6 ±90 x106 Outflow
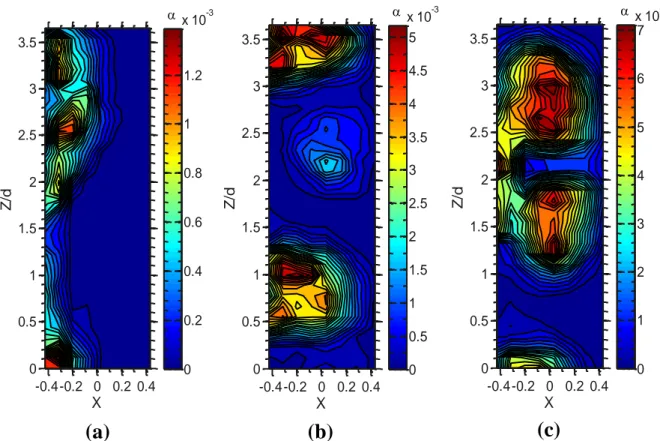
Figures 8 and 9 show the void fraction distribution and the velocity field for the cases 1, 2 and 3 referenced in Table III.
For case 1, bubbles accumulate along the inner cylinder. This could be explained by the centripetal force acting on the bubbles due to rotation of the inner cylinder. Taylor vortices which are already present in the liquid influence the trajectory of the bubbles. The bubbles are then pushed alternately toward the two cylinder walls, as it is shown through the velocity field; this movement could be associated to a wave. Despite the presence of the vortices, bubbles are not getting trapped. This configuration corresponds to what we have called wavering motion.
When the Reynolds number increases, (case 2), the void fraction distribution exhibits accumulation inside the two vortices located above and below the outflow area. Although an axial stratification is pointed out, axial periodicity of the arrangement is evidenced. The configuration is called capture up-down. Examination of the void fraction distribution and the gas-phase velocity field evidences preferential location of the bubbles close to the inner cylinder (for the bubbles captured by the vortex up) and close to the outer one (for those captured by the vortex down) in the region of downward velocity. Bubbles are statistically preferentially trapped by the anti-clockwise vortex above the outflow. Interesting enough is the bubble induced asymmetry of the vortices size: the size of the clockwise vortex being reduced, as well as the axial wavelength by comparison to the single-phase flow.
On both sides of the outflow/inflow region, bubbles are arranged with alternatively distances d1=0.46λ and d2=0.54λ, with λ the axial wavelength as represented in Fig. 10. This
arrangement is consistent with the position of stable equilibrium of the bubbles, obtained by writing the force balance applied on each bubble in a case of passive bubbles dispersion14.
With a further increase of the Reynolds number (case 3), three preferential locations of the bubbles in the gap were clearly observed. Bubbles are trapped in the two vortices on both sides of the outflow region and also in the outflow region near the inner cylinder. By comparison to case 2, the velocity field exhibits an enlargement of the outflow area, accompanied by an increase in the size of the clockwise vortex below the outflow. The configuration is called capture up-down-outflow.
Overall, the void fraction obviously increases with the augmentation of Re number, leading to more and more bubbles trapped.
FIG. 8 Void fraction distribution measured in the meridian plane by bubbles tracking for the different cases referenced in Table III, mixture of 65%, db=100047µm, illustration of the Reynolds number effect. (a): case 1, (b): case 2, (c): case 3
X Z /d -0.4-0.2 0 0.2 0.4 0 0.5 1 1.5 2 2.5 3 3.5 0 0.2 0.4 0.6 0.8 1 1.2 x 10⁻³ X Z /d -0.4-0.2 0 0.2 0.4 0 0.5 1 1.5 2 2.5 3 3.5 0 0.5 1 1.5 2 2.5 3 3.5 4 4.5 5 x 10⁻³ X Z /d -0.4-0.2 0 0.2 0.4 0 0.5 1 1.5 2 2.5 3 3.5 0 1 2 3 4 5 6 7 x 10⁻³
(a)
(b)
(c)
FIG. 9 Velocity field measured in the meridian plane by bubbles tracking for the different cases referenced in Table III, mixture of 65%, db=100047µm. (a): case 1, (b): case 2, (c): case 3
FIG. 10 Stable equilibrium positions of bubbles for a bubble capture up-down (case 2)
By varying the bubble rising velocity, either by changing the viscosity of the mixture or by changing the bubble size, it was possible to highlight other kinds of bubble arrangements in the gap. Figures 11 and 12 display the void fraction distribution and the gas-phase velocity field, measured for the cases 4, 5 and 6.
-0.4-0.2 0 0.2 0.4 0 0.5 1 1.5 2 2.5 3 3.5 4 X
Z
/d
100(a)
-0.4-0.2 0 0.2 0.4 0 0.5 1 1.5 2 2.5 3 3.5 4 XZ
/d
100(b)
-0.4-0.2 0 0.2 0.4 0 0.5 1 1.5 2 2.5 3 3.5 4 XZ
/d
100(c)
FIG. 11 Void fraction distribution measured in the meridian plane by bubbles tracking for the different cases referenced in Table III, mixture of 40%, illustration of the bubble rising velocity influence. (a): case 4, (b): case 5, (c): case 6
FIG. 12 Velocity field measured in the meridian plane by bubbles tracking for the different cases referenced in Table III, mixture of 40%, illustration of the bubble rising velocity influence. (a): case 4, (b): case 5, (c): case 6
X Z /d -0.4 -0.2 0 0.2 0.4 0 0.5 1 1.5 2 2.5 3 3.5 0 0.002 0.004 0.006 0.008 0.01 0.012 0.014 X Z /d -0.4 -0.2 0 0.2 0.4 0 0.5 1 1.5 2 2.5 3 3.5 0 0.002 0.004 0.006 0.008 0.01 X Z /d -0.4 -0.2 0 0.2 0.4 0 0.5 1 1.5 2 2.5 3 3.5 0 0.001 0.002 0.003 0.004 0.005 0.006 0.007 0.008 0.009 0.01
(a)
(b)
(c)
-0.4-0.2 0 0.2 0.4 0 0.5 1 1.5 2 2.5 3 3.5 4 XZ
/d
400(a)
-0.4-0.2 0 0.2 0.4 0 0.5 1 1.5 2 2.5 3 3.5 4 XZ
/d
400(b)
-0.4-0.2 0 0.2 0.4 0 0.5 1 1.5 2 2.5 3 3.5 4 XZ
/d
500(c)
For a larger bubble rising velocity (case 4), bubble capture in one vortex on two was observed rather than a capture up-down-outflow. For this configuration, bubbles were trapped (in the anti-clockwise vortex above the outflow at a radial position very close to the inner cylinder. This arrangement is referred as capture up.
For a same Reynolds number as case 4, but for a larger bubble size, axial trapping of the bubbles either by the inflow/outflow jets or by the vortices was no more evidenced, thus leading to bubbles preferentially sliding axially along the inner cylinder wall (case 5). This arrangement is called sliding motion.
In the case of important bubble rising velocity (large bubbles and small viscosity, case 6)), the void fraction distribution puts into light both an accumulation into a vortex and the jet outward the inner cylinder. For these conditions of the flow, the arrangement was characterized by bubble capture both in the anti-clockwise vortex and in the outflow region near the inner cylinder. This arrangement is called up-outflow.
Figure 13 summarizes the different types of bubble arrangements observed by time average in the meridian plane from cases 1 to 6. As the possible contribution of the azimuthal wave to bubble trapping is integrated in time, same kinds of arrangement are expected to be found whatever the azimuthal position.
FIG. 13 Schematic representation of the different bubble arrangements observed for time averaging in the meridian plane from case 1 to case 6, interpretation based on velocity field and void fraction maps
For all the measurement tests, we never observed the capture of bubbles inside the vortex down without a capture within the vortex up. Indeed, the centripetal force due to the rotation of the inner cylinder makes easier the preferential location of the bubbles close to the inner cylinder, in the downward flow inside the vortex up.
3. Axial wavelength of the gas-phase
Figure 14 exhibits the evolution of the local axial wavelength as a function of the Re number measured in single and phase flows, for different bubble sizes and mixtures. For the two-phase flow, the axial wavelength was determined using both cartographies of the void fraction and cartographies of the gas-phase velocity components. It was only determined for the configurations where bubbles are organised as horizontal periodic bubble rings due to bubble
capture.
FIG. 14 Evolution of the local axial wavelength with Re number for different bubble sizes and liquid mixtures. Local axial wavelength was measured as presented in Fig. 7 and estimated with an accuracy of 7%.
For small bubbles in the mixture of 65% glycerol, a small decrease in the axial wavelength was measured for Re< 2500, followed by a small increase for larger Reynolds. Same but more pronounced trends were observed for small bubbles in the mixture of 40%, the transition being detected at Re=9400. For large bubbles and both mixtures, the axial wavelength was always decreased.
4. Upward averaged axial velocity of the gas-phase
Figure 15 shows the evolution of the averaged axial velocity of the gas-phase (<WG>rz) with
respect to the Reynolds number. For this purpose, the local axial component of the velocity was integrated axially on an axial wavelength and radially. In order to compare different bubble sizes and different mixtures, it was normalized by the terminal rising velocity of the bubbles. The bubble capture induces an averaged upward velocity of the gas-phase, which decreases with the increase of Re and the increase of the bubble size. Generally speaking, it is smaller than 40% of the bubble rising velocity and smaller than 25% of the axial velocity of the Taylor vortices measured in the single-phase flow. For high Reynolds numbers, well beyond the occurrence of bubble capture, the normalized axial velocity reaches a constant value which depends only on the bubble size, regardless of the viscosity and the Reynolds number. (<WG>rz
FIG. 15 Evolution of the axial component of the upward gas-phase velocity, with Re number for different bubble sizes and liquid mixtures. Averaged axial velocity is determined by spatial integration as shown in Fig. 7.
D. Evolution of the viscous torque in two phase-flow
We defined the dimensionless torque in two-phase flow, considering that the viscosity and density of the mixture are unchanged by comparison to the single-phase flow, for a given temperature (Eq. (13)). This assumption is supported by the fact that the global void fraction in the gap is very small. Based on the dimensionless torque, the torque relative difference (TRD) was determined to make the comparison between viscous torque measured in single-phase flow and the one measured in two-phase flow (Eq. (14)).
13 2 2 2 L T G L L
14 2 G G G TRD We display in Fig. 16 the TRD, with respect to the Reynolds number for the four experimental conditions studied (mixture 65% and 40%, db=100047µm and 250090µm). The
errors bars include the hysteresis, linearity drift error due to temperature drift relative to 20°C and statistical convergence errors. Several tests were performed at several days, to check the reproducibility of the experiments. The evolution of TRD according to Reynolds number shows that, depending on the inner cylinder velocity and the bubble rising velocity, an increase or a
decrease in the viscous torque could be observed. Some values of the TRD are as great as the error bars, but different tests demonstrate the reproducibility of the observed trends (increase or decrease by comparison to single phase-flow). It appears that for low values of the Reynolds number, a reduction of the viscous torque was observed which turned into a growth of the viscous torque, when increasing the Reynolds number.
For the mixture of 65% in the case of large bubbles, there was a small reduction of the viscous torque (about -5%) for the Reynolds number under 1500 (Re <1500) and an augmentation of the viscous torque (about +7%) above 1500.
For same mixture but small bubbles, the relative modifications of the torque are less important, the TRD values are in the range of the errors and do not allow to conclude on the modification of the viscous torque for Re<1500. Above this value of the Reynolds number, there was a slight increase of the viscous torque (less than 5%).
In the case of the 40% mixture, the viscous torque reduction at low values of Reynolds number is greater (-15% for the large bubbles and -30% for the small bubbles). For this mixture, the value of the transitional Reynolds number, leading to a null torque reduction or a torque augmentation, is around Re=12000 (ie: Ta=1.44 107), according to the bubble size.
Note that for a bubble size to gap width ratio db/d0.05, Murai et al.7 also highlighted a
transition from a decrease to an increase of the viscous torque when increasing the Reynolds number. For a mixture characterized by an intermediate value of the viscosity (50) by
comparison to our study, they pointed out an intermediate value of the Reynolds number characterizing the transition: Re=4000 (i.e.: Ta=3.28 106).
E. Phase diagrams
1. Phase diagram of the bubble arrangement
The type of arrangement in the gap can be very different, depending on the rotational velocity of the inner cylinder and the bubble rising velocity. It appears that bubbles tend to accumulate along the inner cylinder wall, within the core of the Taylor vortices and/or in the outflow area near the inner cylinder. Therefore, the type of bubble arrangement could be parameterized by the dimensionless parameters, introduced in part A.
Fig. 17 presents a phase diagram which summarizes the various types of bubbles arrangements as a function of parameters C and Hnew. C and Hnew were derived from the values
of the vortex induced axial velocity W measured in single phase flow. For the geometry of the study and for the operating conditions at stake (different bubble sizes and different mixtures), the evolutions of Hnew and C, with regard to the Reynolds number are displayed in Fig. 29 of
Appendix F.
FIG. 17Phase diagram of the bubble arrangements in the gap as a function of parameters C and Hnew. As defined previously,
big symbols refer to large bubbles (0.12<db/d<0.18) and small symbols refer to small bubbles (db/d=0.05). Full disks refer to
our study, triangles refer to Mehel17, blue empty square (C=0.45, Hnew=0.29) refers to Murai et al. 7
and brown full square (C=3.87, Hnew=0.35) refers to Yoshida et al.16(for geometry of 7,16, W and λ were estimated from reference14).
This phase diagram defines several areas that correspond to different types of bubble arrangements. Solid lines materialize the transition between the different arrangements and
dotted lines are imaginary transition lines plotted when data are missing to have well defined areas (a colour code outlines different configurations of bubble arrangements in agreement with the schematic representation of Fig. 13). This diagram also shows some experimental points from Refs. 7, 17 and 18. For these references, only measurement points for which the bubble arrangement was clear and for which the dimensionless parameters could be evaluated were taken into account.
A same phase diagram of the bubble arrangements, plotted as a function of parameters C and H, is shown in Fig. 30 of Appendix G. But it seems that the parameter Hnew leads to a better
universality of the bubble arrangements with regard to different flow geometries (i.e.: the results of bubble arrangements fit better with those of the literature, when considering Hnew
instead of H). At the transition from no capture to bubble capture, as expected from Eq. (8), Hnew rather expands as C2.
When considering the scenarii of bubble arrangements as function of H or as a function of Hnew, similar conclusions can be drawn.
For a very small value of the parameter C (C<0.5), no capture was observed. The contribution of the gravity effect is important so that the rising velocity of the bubbles is larger than the axial velocity induced by the Taylor vortices.
One can visualize that when bubbles are captured by the vortices (either for a configuration up or up-down), an increase of C (or a decrease of the bubble size) promotes bubble capture in the outflow. This is consistent with Mehel et al.19 who stated that large bubbles (db/d=0.16,
Re=2460, Hnew=0.62, C=1.59) were rather trapped in the vortex up whereas, small bubbles
(db/d=0.04, Hnew=0.62, C=31, not plotted in the diagram) were trapped in the outflow.
Therefore, for the values of Hnew and for larger values of C, one expect a bubble trapping in the
outflow, without capture in the vortices, as numerically observed by Chouippe et al.3,27.
From the diagram, it clearly appears that a decrease of Hnew (i.e.: an increase in the Reynolds
number) doesn’t favour the bubble trapping by the vortices. On the contrary, when Hnew is
reduced, an arrangement down shifts to an arrangement up, and then to an arrangement up-outflow. Therefore, for lower values of Hnew, one expect a localization of the bubbles only in
the outflow region near the inner cylinder, this configuration will be called outflow arrangement.
The configuration of outflow arrangement was not highlighted in our study. One can note that this was not observed by the numerical simulations of Climent et al.13which were not related to the small scales of the turbulence. However, it was evidenced by the numerical simulations of Chouippe et al.3,27 which demonstrated that the small scales of the turbulence could help bubbles to be attracted and captured near the wall by the streaks of the maximum azimuthal velocity (minimum viscous friction). This preferential localization needs bubbles to be sufficiently small (bubble size in the magnitude of the viscous length scale) and parameter H (or Hnew) low enough to promote the development of the streaks.
2. Influence of the bubble arrangement on the axial wavelength
In order to correlate the axial wavelength modification and the bubble arrangement type, the trends observed for the axial wavelength have been superimposed on the diagram of the bubble arrangements in Fig. 18.
FIG. 18 Superimposition of the phase diagram of the bubble arrangements in the gap and the trends of the evolution of the axial wavelength for our study. Sign + refers to the increase of the axial wavelength in two-phase flow and sign – refers to the reduction in two-phase flow compared to single-phase flow. These symbols are used for a relative change in the axial wavelength larger than 7%.
The arrangement capture up is associated to a decrease in the axial wavelength. Same is encountered for the capture up-down, this is in agreement with a reduction of the size of the clockwise vortex, as pointed out by Fig. 9(b). On the contrary, the capture up-down-outflow or up-outflow is likely to be associated to an increase in the axial wavelength.
This conclusion is consistent with the observation of Yoshida et al.16. Indeed, for the bubble sizes of 0.05 of the gap width, these authors observe an increase of the axial wavelength for a configuration capture up-down-outflow but, they related the augmentation of the axial wavelength to the capture of the bubbles inside the vortex down. Our results show that the increase in the axial wavelength is rather linked to the bubble entrapment by the outflow, in agreement with an enlargement of the outflow as observed when bubbles migrate into the outflow region (see Figs. 9(c)).
Our results confirm the observations made by Mehel et al.15. For an up-ouflow configuration, they noted an increase in the axial wavelength when the void fraction measured near the inner cylinder in the outflow region was larger than the void fraction measured in the core of the vortex up. The opposite trend was observed when the void fraction was promoted in the vortex core. As shown in Figs. 11(c), the results obtained in a case of capture up-outflow confirm that a void fraction inside the vortex up larger than the void fraction in the outflow, leads to a global decrease in the axial wavelength.
3. Influence of the bubble arrangement on the viscous torque
Murai et al.7 suggested that the transition from torque reduction to torque augmentation should be associated to an expansion of the bubble cloud in the radial and axial direction when bubbles are trapped by the vortices cores. To give credit to this assumption, it is worth analysing the trend (increase or decrease of the viscous torque) by superimposing the trend on the diagram of bubbles arrangement, which is the objective of this part. We have plotted together on the phase diagram of the bubble arrangements (Fig. 19) the different trends observed for the TRD sign.
Through this diagram, it clearly appears that without any capture, when bubbles slide near the inner cylinder wall or when they have a wavering movement because of the jets (inflow/outflow), the configuration is in favour of the reduction of the viscous torque. On the contrary, when bubbles are trapped by the Taylor vortices, this configuration tends to reduce the torque reduction, worse this can bring about a torque increase, as shown by the diagram.
FIG. 19 Superimposition of the phase diagram of the bubble arrangements in the gap and the trends of the evolution of the Torque Relative Difference (TRD) measured in our study. Sign + refers to an increase of viscous torque in two phase flow and sign – refers to the reduction. Symbols (+ or -) does not necessary have the same scale, large symbols (ie: large + or -) denote the values of TRD above the accuracy of the measurement and small symbols (small + or -), the values of TRD below this accuracy.
This diagram outlines that it is not axial bubble trapping by the flow which seems to be responsible for the torque increase, but rather the capture at several preferential axial localizations (up-down, up-outflow, up-down-outflow). This stresses the link between the expansion of the bubble cloud and the increase in the viscous torque, through an increase in the turbulent dispersion.
Another parameter of influence is the axial wavelength. Indeed, for a single-phase flow, Brauckmann and Eckhardt29 have put in evidence by DNS simulations that an increase of the axial wavelength can induce a significant reduction of the viscous torque. One can expect the contrary for a reduction of the axial wavelength.
IV. CONCLUSIONS
The research developed in this paper explores and studies the interactions between the dispersion of the bubbles, coherent motion and viscous torque in a Taylor-Couette flow. Bubbles of diameter 0.05d to 0.125d (d being the gap width) were injected, for very small void fraction (α0.23%). Two mixtures of water-glycerol were used, covering the ranges of Re numbers up to turbulent flow with persistence of the Taylor vortices. Several experimental techniques have been developed, a torquemeter was used to measure the global torque applied to the inner cylinder, while a video recording of bubble trajectories was used to determine the Eulerian distribution of the phase in a meridian plane (void fraction distribution and gas-phase averaged axial and radial velocity distributions). In order to take into account the specificity of the Taylor-Couette configuration, a specific image processing procedure has been applied on bubble trajectories, to limit the depth of field and the contribution of azimuthal motion of the bubbles to the determination of apparent radial position and radial velocity component. Our study maps for the first time, the void fraction and the gas-phase averaged velocity in a bubbly Taylor-Couette flow.
The first part consisted in the characterization of the single-phase flow. Obviously, there is a lack in viscous torque data for small gaps and Reynolds numbers range of the transitional regimes. This study brings complementary data. It provided power scaling laws of the Nusselt number, as a function of the Reynolds number, that were compared with related work, obtained for different geometries. The coherent structures were also characterized in a single-phase flow. The axial velocity component of the Taylor vortices was plotted as a function of the Reynolds number, as well as the axial wavelength, representative of the vortices size.
In the second part, based on void fraction and on Eulerian velocity maps of the gas-phase, different types of bubble arrangement averaged in time were put into light. The generated maps put into evidence a large amount of bubble arrangement types: bubbles can be trapped by the vortices or by one vortex on two or by the outflow and combinations of these arrangements are also possible, according to the flow conditions. Based on the characteristics of the Taylor vortices measured in single-phase flow, the dimensionless parameters C and H, defined by Climent et al.13 characterizing bubble trapping by the coherent motion, have been evaluated. A diagram summarizing the different types of bubbles arrangements was built, with regards to these parameters. Compared to other geometries, a better scaling of the bubbles arrangements was found taking into account the influence of the geometry on the bubble capture in a new definition of H (i.e.: Hnew).
For the bubbly Taylor-Couette flow, the viscous torque was compared to the one obtained in a single-phase flow. For the transitional regimes, it evidences two trends: a decrease in the viscous torque for small Reynolds number and an increase for large Reynolds numbers, the transition depending on the bubble size.
Superimposition of the viscous torque’s trend and the bubbles arrangements diagram allowed to link the observed trends of the viscous torque to the bubbles arrangement types and the evolution of the axial wavelength.