HAL Id: tel-02527172
https://tel.archives-ouvertes.fr/tel-02527172
Submitted on 1 Apr 2020HAL is a multi-disciplinary open access archive for the deposit and dissemination of sci-entific research documents, whether they are pub-lished or not. The documents may come from teaching and research institutions in France or abroad, or from public or private research centers.
L’archive ouverte pluridisciplinaire HAL, est destinée au dépôt et à la diffusion de documents scientifiques de niveau recherche, publiés ou non, émanant des établissements d’enseignement et de recherche français ou étrangers, des laboratoires publics ou privés.
Strategies of Cancer Immunotherapy : Model of Triple
Negative Breast Cancer
Masae Kishi
To cite this version:
Masae Kishi. Strategies of Cancer Immunotherapy : Model of Triple Negative Breast Cancer. Cancer. Université Paris Saclay (COmUE), 2019. English. �NNT : 2019SACLS070�. �tel-02527172�
Strategies of Cancer Immunotherapy:
Model of Triple Negative Breast Cancer
Thèse de doctorat de l'Université Paris-Saclay Préparée à l’Université Paris-Sud
École doctorale n°582 : cancérologie : biologie - médecine - santé (CBMS) Spécialité de doctorat : Sciences de la vie et de la santé
Thèse présentée et soutenue à Villejuif, le 15 mars 2019, par
Masae KISHI HERONT
Composition du Jury : Fawzia LOUACHE
Professeur, Université Paris-Saclay (INSERM U1170) Président
Anne CAIGNARD
Directeur de Recherche, Institut Cochin (INSERM U1016) Rapporteur
Christelle MONVILLE
Professeur, I-STEM (INSERM / UEVE U861) Rapporteur
Franck PAGES
Professeur, Université Paris Descartes (INSERM U1138) Examinateur
Virginie DANGLES-MARIE
Maître de Conférences, Institut Curie Examinateur
Frank GRISCELLI
Professeur, Université Paris Descartes (INSERM U935) Directeur de thèse
Annelise BENNACEUR GRISCELLI
Professeur, Université Paris Sud / Paris Saclay (INSERM U935) Co-Directeur de thèse
N
N
T:
2019S
A
C
L
S0
70
T
ABLE OF CONTENTS
Abstract ··· a List of figures ··· c List of tables ··· e List of annexes ··· g Abbreviations ··· i Acknowledgements ··· k INTRODUCTION ··· 11 Chapter 1: Triple Negative Breast Cancer ··· 1
1.1 Human Mammary gland ··· 1
1.2 Epidemiology of breast cancer ··· 2
1.3 Classification of breast cancer ··· 3
1.3.1 Molecular subtypes of breast cancer ··· 5
1.3.2 Triple negative breast cancer (TNBC) and Basal-like subtype ··· 9
1.3.3 Immune system and TNBC ··· 10
1.4 Breast cancer stem cells ··· 13
1.4.1 Cancer Stem Cell (CSC) ··· 13
1.4.2 Embryonic stem cell-like gene signature in TNBC ··· 15
1.4.3 Stemness molecular profile in breast cancer ··· 19
1.4.4 Breast cancer stem cells ··· 24
1.4.5 Tumor evolution of TNBC ··· 25
1.5 Treatment for TNBC··· 28
2 Chapter 2: Immunity and cancer ··· 32
2.1 Tumor microenvironment (TME) ··· 34
2.1.1 Overview ··· 34
2.1.2 Immune context in breast cancer ··· 37
2.2 Inflammation and cancer ··· 38
2.3 Innate immunity ··· 39
2.3.1 Macrophages ··· 41
2.3.2 Dendritic cells ··· 41
2.3.3 Myeloid-derived suppressor cells (MDSC) ··· 42
2.3.3.1 Murine MDSCs ··· 44
2.3.3.2 Human MDSCs ··· 44
2.3.3.3 MDSC infiltration in tumor ··· 44
2.3.3.4 Mechanisms of immunomodulatory functions by MDSCs ··· 45
2.3.3.6 Re-education potential of MDSCs ··· 46 2.3.4 NK cells ··· 47 2.4 Adaptive immunity ··· 48 2.4.1 T cells ··· 49 2.4.1.1 Cytotoxic T lymphocyte (CTL) ··· 51 2.4.1.2 Regulatory T cells ··· 53 2.4.1.2.1 Differentiation of Tregs ··· 53 2.4.1.2.2 Function of Tregs ··· 54
2.4.1.2.3 nTregs and iTregs in cancer ··· 55
2.4.1.3 Helper T cells ··· 56
2.4.1.3.1 Type 1 helper T (Th1) cells ··· 56
2.4.1.3.2 Type 2 helper T (Th2) cells ··· 57
2.4.1.3.3 T helper 9 (Th9) and T helper 17 (Th17) cells ··· 58
2.4.1.3.4 Plasticity of helper T cells ··· 58
2.4.1.3.5 TCR signal strength in mature T cell differentiation ··· 58
2.4.1.4 T cell memory ··· 59
2.4.1.5 Cross reaction, allo/xeno reaction by T cells ··· 60
1.1.1.1.1 Reactions against allo/xeno products ··· 60
1.1.1.1.2 Structural evidences ··· 61
2.4.2 B cells ··· 62
2.5 Cytokines ··· 63
2.6 Chemokines ··· 64
3 Chapter 3: Cancer immunotherapy ··· 67
3.1 History ··· 67
3.2 Therapeutic approaches ··· 69
3.2.1 Cytokines and Vaccines ··· 69
3.2.1.1 Protein/peptide-based vaccines ··· 70
3.2.1.2 DNA/RNA based vaccines ··· 71
3.2.1.3 Viral based vaccines ··· 71
3.2.1.4 Immunological perspective behind cancer vaccine ··· 71
3.2.2 Adoptive cell therapy ··· 72
3.2.2.1 Chimeric antigen receptor T (CAR T) cells ··· 73
3.2.3 Immune check point inhibitors ··· 74
3.2.3.1 Anti-CTLA4 antibodies ··· 79
3.2.3.2 Anti-PD1/PDL1 antibodies ··· 79
3.3 Cancer antigens ··· 80
3.3.1 Tumor-associated antigens (TAAs)··· 81
3.3.2 Differentiation antigens ··· 81
3.3.3 Cancer/testis antigens (CTAs) ··· 81
3.3.4 Oncofetal antigens ··· 81
3.3.5 Tumor specific antigens (TSAs) ··· 84
3.4 Vaccine adjuvants and immune response modifiers ··· 85
3.4.1 Epigenetic modulation of immune functions ··· 87
3.4.1.1 Histone modification ··· 87
3.4.1.2 The role of HDACs in immune system and the effects of HDAC inhibitors (HDACis) ··· 88
3.5 Immunotherapy in breast cancer treatment ··· 89
4 Chapter 4: Immunotherapy strategies using PSCs ··· 94
4.1 Characteristics of Pluripotent stem cells ··· 94
4.2 iPS cells ··· 95
4.2.1 Generation of iPS cells ··· 95
4.2.2 Characterization of ESC and iPSC ··· 95
4.3 Immunotherapy strategies using PSCs ··· 97
4.3.1 PSC as a source of cancer immunotherapy ··· 97
4.3.1.1 Generation of DCs from iPSCs ··· 97
4.3.1.2 Generation of T cells from iPSCs ··· 98
4.3.1.3 Generation of NK cells from iPSCs ··· 99
4.3.1.4 Generation of NKT cells from iPSCs ··· 99
4.3.2 Cancer vaccines using pluripotent stem cell ··· 97
RESULTS ··· 103
A- In vitro characterization of TNBC CSCs from 4T1 cell line ··· 105
B- Establishment of TNBC model ··· 115
C- Generation of transgene-free iPS cells from Balb/c mouse ··· 125
D-Article: Pluripotent Stem Cell-Based Cancer Vaccines Targeting Tumor Microenvironment and Metastatic Spread ··· 132
DISCUSSION Major findings and perspective ··· 196
General conclusion ··· 199
ANNEXES ··· 203
a
A
BSTRACT
Most of Triple Negative Breast cancers (TNBC) are basal-like, aggressive, and high grade. They are often at grade III at diagnosis and possess mesenchymal or embryonic-type gene signature. TNBCs are difficult to eradicate due in part to the presence of a rare population called "cancer stem cells (CSCs)" showing extensive capacity of self-renewal representing a property sharing with stem cells. Pluripotent stem cells (PSCs) and CSCs have been shown to share antigenic determinants and several teams have shown that it is possible to use PSCs as a vaccine material to induce a cellular and/or humoral immune response against CSCs. PSC-based vaccine (PSCV) approach has been previously evaluated on murine models of lung, colon and ovarian cancer.
My thesis work consisted in setting up a metastatic TNBC model in mice (syngeneic Balb/c) and evaluating the antitumor effect of PSCV in this model. 4T1 immunocompetent murine model was used as a model which closely mimic metastatic human TNBC. In relation to this research, the following subjects are discussed in this thesis: the description of the tumor microenvironment, the relationship between cancer and stem cells, and the cellular and molecular mechanisms of tumor immunosuppression in the context of TNBC. Knowledge of the mechanisms of immunosurveillance is a major element to understand before proposing any new approaches to immunotherapies.
We have demonstrated that PSCV in combination with a histone deacetylase inhibitor prevents the establishment of 4T1 tumors by developing a strong anti-tumor immune response. We have shown that this anti-tumor effect is associated with a reduction of regulatory T cells and Myeloid-derived suppressor cells, and an increase of cytotoxic CD8+
T cells in the tumor and spleen. In addition, the anti-tumor response was associated with a drastic reduction in metastatic spread and an improved survival rate in 4T1 breast cancer model. This active immunotherapy strategy was also effective in inhibiting the establishment of CSCs, with inducing a major modification of the tumor microenvironment.
By analysis of gene expression by transcriptome and RT-qPCR, we were able to show the presence of a significant increase of CXCL9, CXCL10 and CXCL13 transcripts in the tumors of mice that received the combined treatment. The chemokine ligand CXCL9 and CXCL10 are chemo-attractants for CD8+ T cells, Th1 cells and NK cells. CXCL13 plays an
important role in attracting lymphocytes to the tumor site and forming tertiary lymphoid structures. These results reveal that a part of the underlying mechanism of the observed
b
antitumor effect was by polarizing the tumor microenvironment to the attraction of T cells to the tumor and turning it to an active "hot" state. with the increased presence of effector immune cells.
We have also shown that the candidate vaccine is able to exert long-term effect, which was demonstrated by inhibiting tumor establishment at 6 and 9 months after vaccination with PSCV, showing the possibility of inducing long-lasting adaptive immunity with activation of the immune system and inhibition of suppressor cells.
We also observed the emergence of a small population of CSC within 4T1 tumors once implanted to the mammary fat pad of mice, underlying that the clinical strategy must consider the influence of microenvironment on cancer cells. Further, the increase of CSC in tumors is time-dependent after tumor implantation, emphasizing the importance of intervening as soon as possible to eradicate a possible presence of CSC in tumors.
This work proposes PSCV to be used for prophylactic purpose, or as a prevention of recurrence in patients with TNBC after the surgery.
c
L
IST OF FIGURES
Figure 1: Anatomical and histological illustrations of human mammary gland ··· 1
Figure 2: Differentiation hierarchy model from mammary stem cells to the differentiated cells. ·· 2
Figure 3: Breast cancer incidents and mortality. ··· 3
Figure 4: Histological stratification of breast cancer. ··· 4
Figure 5: Molecular intrinsic subtypes of breast cancer. Gene clustering, characters and prognosis ··· 7
Figure 6: Distribution of dinstinct molecular subtype in ··· 9
Figure 7: The prevalence of somatic mutations across human cancer types ··· 11
Figure 8: CSC model and Clonal evolution model ··· 13
Figure 10: Poorly differentiated breast cancers show an ES-like enrichment pattern. ··· 17
Figure 11: ES like gene signature in breast cancers ··· 19
Figure 13: Diversity and existence of multi-subtypes within DCIS tumor ··· 26
Figure 14: Copy number Evolution in Clonal Extinction and Resistant Patients ··· 27
Figure 15: Hallmarks of cancer: The revised perspective ··· 33
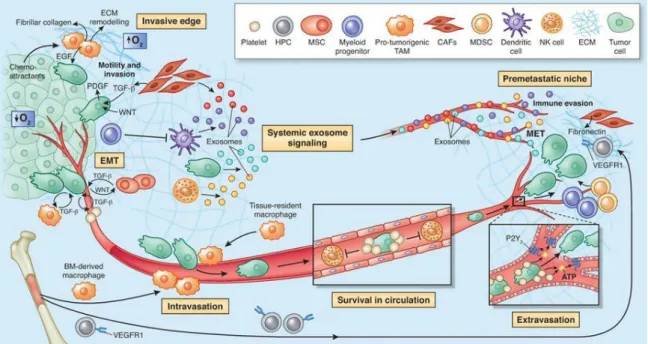
Figure 16: The microenvironment supports metastatic dissemination and colonization at secondary sites ··· 34
Figure 17: Changes that occur in myeloid cells in cancer ··· 43
Figure 19: Peripheral tolerance ··· 50
Figure 20: Relationship between TCR affinity and T cell activity for CD8 and CD4 T cells. ··· 51
Figure 21: Interaction of a cytotoxic lymphocyte with a target cell ··· 52
Figure 22: CD4+ thymocyte fate and regulatory T cell differentiation by TCR signal strength ··· 54
Figure 23: T helper-cell differentiation to Th1, Th2 and Th17 ··· 57
Figure 24: The promotion of tumor immunity by chemokines ··· 65
Figure 25: History of cancer immunology and immunotherapy. ··· 68
Figure 26: Engineered T cells: design of TCR versus CAR T cells. ··· 73
Figure 27: Multiple co-stimulatory and inhibitory interactions regulate T cell responses ··· 75
Figure 28: Customizing a patient-specific cancer vaccine. ··· 84
Figure 29: Morphology change after 4 days culture with cytokines.··· 109
Figure 30: The representative photos of the mammosphere culture. ··· 110
Figure 31: Mammosphere forming efficiency (MFE) and large sphere count ··· 111
Figure 32: Representative photo of MF culture of MF (N) and MFptt + TNF+TGF (N) ··· 111
Figure 33: CD44+CD24-/low population of 4T1 cells in MF and MF ptt+TNF+TGF cultures ··· 112
d
Figure 35: MHC I expression in bulk 4T1 and 4T1 mammosphere··· 114
Figure 36: Tumor volume in 4T1 tumorigenesis study ··· 117
Figure 37: Pathological observations in primary tumors and spleen ··· 117
Figure 38: GFP intensity measurement by FACS ··· 118
Figure 39: Cloning in 98 well plate: One 4T1-GFP-Luc cell in a well under (a) microscope and (b) fluorescent microscope. (c, d) The cell formed a small colony 4 days after seeding. 119 Figure 40: GFP expressions of 4T1-GFP-Luc clones (above) and subclones (below). ··· 120
Figure 41: GFP positive rate and median value of each clones. ··· 121
Figure 42: Analysis of the clones by bioluminescent imaging by IVIS. ··· 122
Figure 43: Tumor volume, tumor weight and bioluminescent images of 4T1-GFP-Luc clones ··· 123
Figure 44: Metastasis to the organs analyzed by bioluminescence detection of 4T1-GFP-Luc clones ··· 124
Figure 45: Reprogramming of primary fibroblasts obtained from Balb/c mouse. ··· 128
Figure 46: iPSC colonies observed after the infection of Adenovirus expressing Cre recombinase and GFP. ··· 129
Figure 47: PCR results after the process of transgene deletion ··· 130
Figure 48: Characterization of iPSC clones. ··· 131
e
L
IST OF TABLES
Table 1: TNM staging ··· 4
Table 2: Scoring criteria for histological grade determination of breast cancer by Nottingham Histological Score system. ··· 5
Table 3: Character of molecular subtypes of breast cancer ··· 8
Table 4: Gene analysis on mutational load and TIL according the molecular subtypes ··· 12
Table 5: Important molecular pathways and transcription programs in breast CSC ··· 20
Table 6: Systemic treatment recommendations for early breast cancer subtypes ··· 29
Table 7: Immune cell population in TME ··· 35
Table 8: Toll like receptors and their ligands ··· 40
Table 9: Regulation of MDSCs ··· 45
Table 10: Summary of the biological and molecular functions of T-cell costimulatory molecules · 76 Table 11: Summary of FDA approvals for immune checkpoint blockers ··· 78
Table 12: Types of tumor antigens and their advantages and disadvantages as therapeutic targets ··· 83
Table 13: TLR ligands used for cancer immunotherapy ··· 86
Table 14: Clinical trials of immune check point inhibitors in breast cancer ··· 90
Table 15: Clinical trials of vaccine for the prevention of breast cancer recurrence ··· 91
Table 16: Clinical trials of therapeutic cancer vaccine in breast cancer ··· 92
Table 17: Different methods of reprogramming factor delivery to generate iPSC ··· 96
Table 18: Pluripotent stem cell- based vaccine studies in animal models ··· 102
Table 19: Results of RT-PCR performed on different cancer cell lines demonstrating the expression of pluripotent markers. ··· 107
g
L
IST OF ANNEXES
Annex 1: Other factors consists of immune tumor microenvironment ··· 203
Annex 2: Immunological effect of conventional chemotherapeutics ··· 212
Annex 3: Immunological effect of targeted anticancer agents ··· 215
Annex 4: CSC, stem cell or mesenchymal stem cell markers tested and those descriptions ··· 217
Annex 5: Primer sequences used for RT-PCR ··· 219
Annex 6: List of the antibodies used in the experiments ··· 220
Annex 7: Supplementary data 1 (CSC marker CD44+CD24low/- expression in 4T1) ··· 221
Annex 8: Supplementary data 2 (Dendritic cell vaccination loaded with PSC antigens) ··· 222
i
A
BBREVIATIONS
ADCC : antibody-dependent cell-mediated cytotoxicity
AFP : α-fetoprotein
AJCC : American Joint Committee on Cancer
ALDH : Aldehyde dehydrogenases 1
APC : antigen-presenting cell
ARG1 : arginase 1
BC : Breast cancer
BLBC : Basal-like breast cancer
BRCA1/2 : breast cancer susceptibility gene 1/2
CAF : cancer associated fibroblast
CART : Chimeric Antigen Receptor T cells.
CCL : chemokine
CEA : carcinoembryonic antigen
CK : cytokeratin
CSC : Cancer stem cell
CSF-1 : colony-stimulating factor 1
CTLA4 : cytotoxic T-lymphocyte–associated antigen 4
CXCL : chemokine (C-X-C motif) ligand
CXCL9 : CXC-chemokine ligand 9
CXCR : CXC-chemokine receptor
DAMP : Damage-associated molecular pattern
DC : dendritic cells
DCIS : Ductal carcinoma in situ
EGFR : epidermal growth factor receptor
EMT : epithelial mesenchymal transition
ER : Estrogen receptor
ESC : embryonic stem cell
ESMO : European Society for Medical Oncology
FACS : fluorescence-activated cell sorting
FDA : Food and Drug Administration
FGF2 : fibroblast growth factor 2
GM-CSF : granulocyte–macrophage colony-stimulating factor
HER2 : human epidermal growth factor receptor 2
HLA : Human Leukocyte Antigen
CPI : Immune check point inhibitor
IDC : invasive ductal carcinoma
IFNγ : interferon-γ
IL : Interleukin
ILC : Innate lymphoid cell
iNKT : invariant natural killer T cell
iPSC : induced pluripotent stem cell
iTreg : induced regulatory T cell
j
MAIT : mucosal-associated invariant T cells
M-CSF : macrophage-colony-stimulating factor
MDSC : Myeloid-derived suppressor cell
MHC : major histocompatibility complex
MICA : MHC class I-related chain A
MIF : migration inhibitory factor
NK : Natural killer
nTreg : natural regulatory T
Oct4 : octamer-binding transcription factor 4
OS : overall survival
PAMP : Pathogen Associated Molecular pattern
pCR : Pathological Complete Response
PD-1 : Programmed cell death 1
PD-L1 : programmed cell death 1 ligand 1
PFS : progression-free survival
PI3K : phosphatidylinositol 3-kinase
pMHC : peptide-MHC complex
PR : Progesterone receptor
PRC : Polycomb-group repressive protein complex
PRRs : Pattern recognition receptors
PSCVs : pluripotent stem cell-based vaccines
G-MDSC : granulocytic-Myeloid-derived suppressor cell
siRNA : small interfering RNA
Mo-MDSC : monocytic-Myeloid-derived suppressor cell
Sox2 : SRY (sex determining region Y) -box 2
STAT1 : signal transducer and activator of transcription factor-1
TAM : Tumor-Associated Macrophages
TCR : T-cell receptor
TDLU : Terminal ductal lobular unites
Tfh : T follicular helper cells
TGF-β : transforming growth factor-β
Th : helper T cell
TIDCs : tumor infiltrating DCs
TILs : tumor-infiltrating lymphocytes
TIM3 : T cell immunoglobulin and mucin domain-containing protein 3
TLRs : Toll-like receptors
TLSs : tertiary lymphoid structures
TME : tumor microenvironment
TNBC : Triple negative breast cancer
TNF-α : Tumor necrosis factor-α
TNM : tumor node metastasis
Treg : regulatory T cell
TRM : tissue-resident memory T cells
k
A
CKNOWLEDGMENTS
First of all, I would like to express my greatest appreciation to Pr. Frank Griscelli for his guidance and continuous support during M2 study and my thesis. His strong knwoledge and intellectual support were precious for the experimental experiences obtained during my work. I express deep gratitude to Pr. Annelise Bennaceur Griscelli for accepting me in the Unit despite of my age, for her global support and for coaching me about the important and innovative ideas and feedbacks.
I am honor to present my thesis to an internationally recognized expert jury in the field of immunology, stem cells and experimental animal cancer models. I am grateful to Dr. Anne Caignard and Pr. Christelle Monville for accepting to analyse my work and for their precious guidances, Pr. Franck Pagès and Dr. Virginie Dangles-Marie for accepting to evaluate my work, and Pr. Fawzia Louache for accepting to be the chairwomen of the jury.
I would like to express great appreciation to my collaborators for this work: Special appreciation to Dr. Afag Asgarova for her huge helps and collaboration works. I enjoyed very much working and sharing the time together, even when the experiments were busy. Dr. Marie-Ghislaine de Goër for her kindness and supports to perform immunological experiments and analysis. Dr. Christophe Desterke for his important expertise in bioinformatics. Dr. Diana Chaker for her kind help in the experiments.
I thank very much Pr. Ali Turhan to welcome me in the Unit and for his precious advises during thesis. I am very thankful to all current and past members of the Team Unit, for their warm encouragements and sharing discussions during my thesis and scientific meetings. Dr. Jérôme Artus for taking his time to help me in stem cell culture for the experiments. Dr. Adlen Foudi, Dr. Herve Aloque for their knowledge in experimental protocols. Olivier Féraud, Dominique Divers and Theodoros Latsis from Stem Cell Bank of the Unit for Embryonic and iPS cell maintenance.
My heartful appreciation to all of my collegues. Lucie, Eva, Jinwook, Sarah, Lucas, Gladys, Patricia, Albert, Sandra, Sabrina, Estelle, Delia, Lara, Tony, Mathieu, Isabelle, Alexandre, Cécile. It was really great to share the time together, giving me always positive energies and wonderfully colorized my memories. I would also like to express my thanks to Dr. Xiao Mei Li, Dr. Yunhua Chang-Marchand and Dr. Sandrine Dulong from team 3 of the Unit and Dr. Ibrahim Casal and Gaëlle Duvallet from animal facility.
l
I would like to express my appreciation to the mentors, previous colleagues and friends in Japan. Dr. Kaori Mohr. My motivation for studying science is not like now without her. It was really lucky of me to meet her. She taught me important principles in the works that I will not forget. Special thanks to Dr. Masayuki Tanaka and Dr. Kiyoshi Kobayashi for their support that made it possible for me to study in France. Dr. Aoki Emiko. Thank you for being there. With big love. Many thoughts and appreciation to my friends in Japan. Goli, Akiko, Ai, Chika, Nobuko and Waka.
Finally, I would like to express my sincere appreciation to my family. My parents for their tremendous supports. My grandmother, my brother and his wife and children. My uncles. Lastly, I would like to express my deepest and utmost appreciation to my husband and my son for their presences and supports.
1
I
NTRODUCTION
1.
Chapter 1: Triple negative breast cancer
1.1 Human Mammary gland
The mammary gland is the organ responsible for lactation and one of the few organs which undergoes continued development throughout the lifetime of a woman. Human mammary gland consists of a network of ducts that ends in small ductules constituting the terminal ductal lobular units (TDLU). TDLU consists of terminal ductule and lobule, functional unit of the breast. It is believed that the majority of breast cancers arise in the TDLUs.
The TDLU contains two major types of cells: Inner luminal cells consists of ductal luminal cells, which line the inside of the ducts, and alveolar luminal cells, which secrete milk during lactation and myoepithelial cells, which contract to help excrete milk during lactation (Figure 1) (1). The stroma is composed of adipocytes, fibroblasts and immune cells.
Figure 1: Anatomical and histological illustrations of human mammary gland
(Adopted from Dimri 2005) (2)
The mammary epithelial cells develop from mammary stem cells. While the exact differentiation hierarchy is still not completely understood, it is believed that the mammary stem cells give rise to bi-potent progenitor cells, which can differentiate into luminal or, myoepithelial lineage-specific progenitors. The myoepithelial progenitors differentiate into myoepithelial (basal) cells, while the luminal progenitors differentiate
2
into luminal cells (Figure 2). The biological and molecular characteristics of these cell types consists the basis for the molecular classification of breast cancers into multiple subtypes and will be discussed in more detail later.
Figure 2: Differentiation hierarchy model from mammary stem cells to the differentiated cells.
The described cell surface markers are not exhaustive and those of progenitor cells are still in debates. (Modified from Polyak. 2007. Keller. 2010 (3, 4))
1.2 Epidemiology of breast cancer
Breast cancer is the most frequently diagnosed cancer and the most frequent cause of cancer death among women, representing 25% of all cancers in women and 15% of all cancer death in women in the world. Breast cancer is the most common cancer diagnosis in women in 140 countries and the most frequent cause of cancer mortality in 101 countries. Age standardized incidence rates are highest in Western Europe and lowest in East Asia (Figure 3).
In France, breast cancer is the most frequent cancer in the females and 80% of them are diagnosed after 50 years old. The mortality rate is 14.6 in 100,000 females and breast cancer is the first ranked of cancer death in the females in France, followed by lung cancer and colorectal cancer (5). Median age of diagnosis is at 63 years old and the median age
3
of the death is 73 years old. One out of eight women in France develops this disease in her life.
Mortality rates have been declining in a number of highly developed countries since the late 1980s and early 1990s, a result of a combination of improved detection and earlier diagnosis and more effective treatment regimens (6).
Figure 3: Breast cancer incidents and mortality.
Adopted from GLOBOCAN 2012. (6)
1.3 Classifications of breast cancer
Breast cancer is a heterogeneous disease with different histopathological and biological characteristics with variable prognoses and responses to therapies. Breast carcinoma is classified as either non-invasive (carcinoma in situ) or invasive, depending on whether or not the tumor has invaded to grow outside the basal membrane. Invasive carcinomas are cancers in which the altered cells diffuse to surrounding connective tissues and metastasize to distant organs of the body. Ductal carcinoma in situ (DCIS) and lobular carcinoma in situ are the most common forms of precursor lesions. Similarly, invasive ductal carcinoma (IDC) and invasive lobular carcinoma are the most common forms of invasive breast carcinoma. IDCs account for approximately 55% of all breast cancers (Figure 4).
4
Figure 4: Histological stratification of breast cancer.
The pathological status of breast cancer is made by TNM scores (Table 1) which describe pathological stages including the assessment of primary tumor (T), regional lymph nodes (N) and distant metastasis (M). This classification system provides a basis for survival prognosis, choice of initial therapeutic approaches and evaluation of therapeutic results.
Table 1: TNM staging (AJCC criteria)
5
Historical Grade represents aggressive potential of the tumor, with the amount of gland formation (differentiation level), the nuclear features (pleomorphism) and the mitotic activity (proliferation level), which classified into from Grade I (low) to III (high). Grade I tumors have a total score of 3-5, Grade II tumors have a total score of 6-7, Grade III tumors have a total score of 8-9 according to the following scoring criteria (Table 2).
Table 2: Scoring criteria for histological grade determination of breast cancer by Nottingham Histological Score system.
(Johns Hopkins medicine pathology. https://pathology.jhu.edu)
*The mitotic count score criteria vary depending on the field diameter of the microscope. The criteria above use a high-power field diameter of 0.52 mm.
The expression of hormonal receptors, such as estrogen receptor (ER) and progesterone receptor (PR), has been used to classify tumors into hormone receptor positive and negative groups. Since the discovery of the role of amplification or overexpression of human epidermal growth factor receptor 2 (HER2 or ERBB2) in a subset of breast tumors, measurement of HER2 status has been added to clinical diagnosis of breast cancer. Thus, based on the immunohistochemical staining of ER, PR, and HER2, breast tumors are classified into three subtypes: hormone receptor positive (ER+, PR+), HER2 positive (HER2+) and triple negative breast cancer (TNBC) (ER-, PR-, HER2-).
1.3.1 Molecular subtypes of breast cancer
The classification of molecular subtypes of breast cancers was proposed in 2000, based on the microarray analysis and its genetic clustering of the tumor specimens from the patients (Figure 5) (7). The subtype was divided into four different subtypes, which are ER+ luminal and three ER- groups including HER2 overexpressing group (HER2+ subtype), basal-like group, and normal breast-like group. The following year, the luminal subtype was divided into at least two groups (luminal A and luminal B)(8). These subtypes have been subsequently confirmed by multiple groups and are now widely accepted in the field.
Glandular/Tubular Differentiation Nuclear Pleomorphism Mitotic Count*
Score 1 >75% of tumor forms glands Uniform cells with small nuclei similar in size to normal breast epithelial cells
< 7 mitoses per 10 high power fields
Score 2 10% to 75% of tumor forms glands Cells larger than normal with open vesicular nuclei, visible nucleoli, and moderate variability in size and shape
8-15 mitoses per 10 high power fields
Score 3 <10% of tumor forms glands Cells with vesicular nuclei, prominent nucleoli, marked variation in size and shap
> 16 mitoses per 10 high power fields
6
More recently, another intrinsic subtype termed Claudin-low type has been identified (9) (Figure 5). This type is characterized by the low gene expression of tight junction proteins, claudin 3, 4 and 7 and E-cadherin, and high expression of EMT related genes. For this subtype, the analysis of genomic signature of tumor initiating cells derived from CD44+/CD24-/low-sorted cells and mammospheres obtained from primary human
breast tumors was found to be enriched by gene expression in the claudin-low subtype, indicating claudin-low subtype resembles the mammary epithelial stem cell (9).
The characters of each molecular subtype are described in Table 3. To note, Normal breast-like subgroup shows a gene expression pattern similar to normal breast tissue including epithelial cells, non-epithelial cells, and adipose tissue. Since they do not show expression of many proliferation genes, it has been speculated that this subtype could potentially be the consequence of normal tissue contamination (10).
Luminal subtype present luminal cytokeratins, epithelial gene expression whereas Basal-like subtype has myoepithelial (basal) cytokeratin expression. Luminal A subtype tumors are usually hormone receptor positive and have relatively good prognosis. Luminal B subtype tumor are positive for hormone receptors but with low level and tend to show high proliferation profile and worse prognosis than luminal A. HER2-enriched, basal-like and claudin-low subtype show often bad prognosis though emergence of Trastuzumab (anti-HER2 antibody) therapy targeting HER2 is improving the prognosis of HER2-enriched BC patients.
7
Figure 5: Molecular intrinsic subtypes of breast cancer. Gene clustering, characters and prognosis
(a) First analysis and proposal by Perou et al. (b) Addition of Luminal B (and C) subtype (c) Addition of Claudin-low subtype. (d) Clinical and pathological characteristics and prognosis of all intrinsic subtypes across three independent breast cancer data sets of UNC337, NKI295 and MDACC133. pCR: Pathological complete response rate after anthracycline/taxane-based chemotherapy. (Adopted from Perou et al., 2000, 2001, 2011)(7-9)
Claudin-low
(a) (b)
(c) (d)
8
Table 3: Character of molecular subtypes of breast cancer
Prevalence ER/PR HER2 General
Grade Description Mutation Treatment/Reaction
Luminal A 50-60% + (high) - 1 or 2 low Ki-67, low mitotic count
High luminal cytokeratins KRT8, KRT18 Luminal signature (ESR1, GATA3, FOXA1,
XBP1, and MYB)
Good prognosis
Lowest mutational rate in subtypes
PIK3CA (45%), MAP3K1, TP53, GATA3, CDH1, and MAP2K4
Good response to endocrine therapies Less responsive to chemotherapy
Luminal B 15-20% + (low) - (70-80%) + (20-30%)
2 High Ki-67, high mitotic count Worse prognosis than Luminal A
Mutations in PIK3CA and GATA Higher frequency of mutations in TP53 and frequent mutations in RB1,
RUNX1, and MALAT1 and high
expression of MYC
Do not respond as well to hormonal intervention therapies compared to luminal A, though they have a better response to
neoadjuvant chemotherapy
HER2 enriched
10-20% +/- + 2 or 3 Tumors are dependent on HER2 signaling;
upon ligand binding, HER proteins undergo dimerization and activation of tyrosine kinase activity and downstream signal transduction High proliferation rate
Often show aneuploidy
Often show mutations in TP53 and
PIK3CA but lack many other
mutations present in luminal tumors
Good response to certain
chemotherapeutic drugs and anti-HER2 targeted therapies such as anti11 HER2 antibodies and EGFR/HER2 tyrosine kinase inhibitors
Basal-like 10-20% - (majority)
- (majority)
3 Gene characteristic of myoepithelial cells Basal cytokeratins (5/6, 14, 17), p-cadherins, caveolins 1 and 2, nestin, laminin y1, and annexin A8
Often overexpress EGFR
Mostly aneuploid and display high histological grade, are very proliferative with high mitotic indices
Mutations in TP53
Overall mutation rate was much higher than luminal subtypes.
PIK3CA pathway including PTEN and INPP4B.
RB1 mutations compared to other
subtypes
Germline BRCA1 mutation
Better response to chemotherapy compared to luminal subtypes However, many patients
relapse in the first five years, and the ones who do not respond have a dismal outcome
Claudin low 7-14% - (majority)
- (majority)
2 or 3 Low expression of genes involved in cell-cell Adhesions and tight junctions including claudin 3,4,7, cingulin, and occluding
Immune cell infiltration Enriched for EMT markers Stem cell-like features High ALDH1
Poorly described about the mutations in Claudin-low subtype
Intermediate response to chemotherapy
9
1.3.2 Triple Negative Breast Cancer (TNBC) and Basal-like subtype
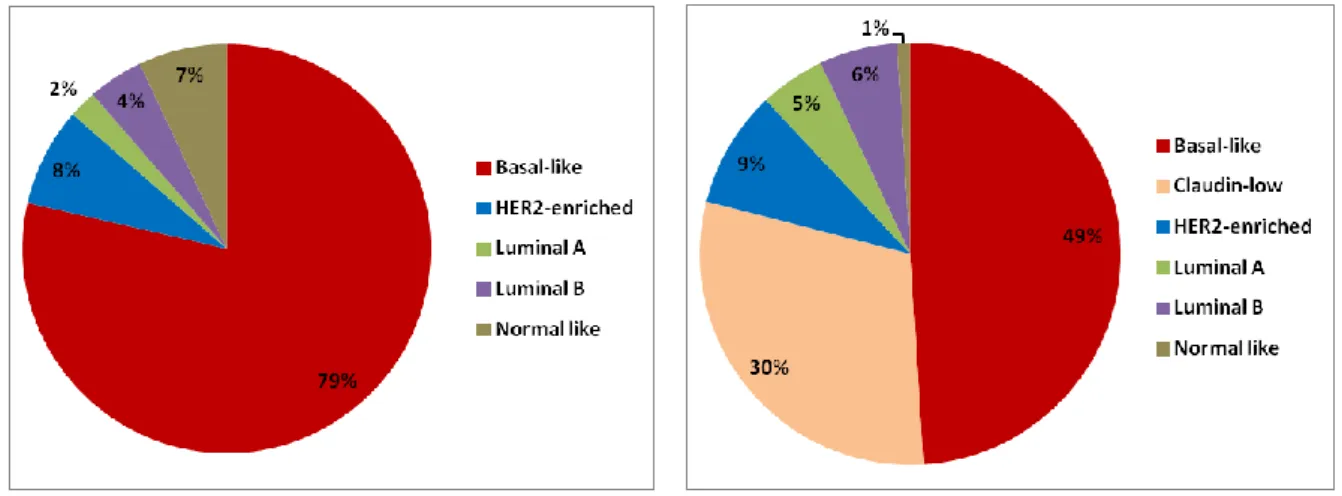
Breast cancer categorized as TNBC is negative for ER, PR and HER2, and consists 12-17% of breast cancer patients (11). 95% of TNBCs are invasive ductal carcinoma (IDC). TNBC contains molecular subtypes of Basal-like and Claudin-low groups. Approximately 80% of Basal-like subtype and 60-70% of Claudin-low subtype are TNBC. In addition, 80-90% of breast cancers harboring BRCA1 and BRCS2 germline mutation are classified into basal like breast cancer (BLBCs) based on the genetic expression profile. Majority of them belongs to TNBC (12). Figure 6 shows ratio of 5 or 6 molecular subtypes in BC with or without claudin-low subtype.
Figure 6: Distribution of dinstinct molecular subtype in breast cancer (Modified from Prat
and Perou. 2011, 2013) (13, 14)
Left: Ratio of 5 subtypes without claudin-low Right: Ratio of 6 subtypes with claudin-low
TNBCs share many epidemiological, morphological, histopathological, genomic, and clinical features of BLBCs, including high prevalence in younger and African American women, and aggressive tumors with high histological grade. BLBCs are characterized by the expression of genes characteristic of myoepithelial cell including the cytokeratins (5/6, 14, 17), p-cadherins and often overexpress EGFR. BLBCs are mostly aneuploid, display high histological grade, are very proliferative with high mitotic indices, and mostly clinically aggressive. BLBCs are more prevalent in women under the age of 50 and women of African American or Hispanic ethnicity. Some other factors associated with higher risk of BLBC are higher body mass index during premenopausal years, earlier age at menarche, higher parity and shorter duration of breastfeeding.
10
Genomic studies reported that 80% of BLBCs harbor mutations in TP53. Loss of function from genes involved in DNA damage repair including TP53, RB1, and BRCA is a hallmark of BLBCs (15). The overall mutation rate is much higher in BLBCs compared to luminal subtypes. However, mutations are present in fewer genes and interestingly, mutations present in luminal subtypes are almost absent in the BLBCs except for PIK3CA, which is present in 9% of the cases.
Claudin-low sub-type tumors are characterized by a low expression of genes involved in cell-cell adhesions and tight junctions including claudin 3,4,7, cingulin, and occluding. Similar to basal-like subtype, these tumors display low expression of luminal cytokeratins, ER, HER2, and other luminal specific genes; however, these tumors show relatively low expression of proliferation-associated genes. These tumors express a highly number of immune system response genes from B- and T- lymphoid cells, and suggest a high immune cell infiltration. Other important characteristics of Claudin-low tumors are a stem cell-like gene signatures including Aldehyde dehydrogenases 1 (ALDH1) expression and EMT markers.
TNBC is still a heterogenous group of breast cancers. It was further subtyped by
genetic cluster analysis into 6 groups: Basal-Like 1 (BL1) and Basal-Like 2 (BL2) with
a high expression of cell proliferation, cell cycle, DNA repair. genes; Immunomodulatory (IM) with a high expression of immune reaction related genes; Mesenchymal (M); Mesenchymal Stem-Like (MSL) with a high expression of TGF-β, EMT genes, proliferation factors, Wnt/β-catenin signaling pathway and Stem cell related genes; Luminal Androgen Receptor (LAR) with a high expression of AR and luminal related genes (16). The IM and MSL subtypes were speculated mostly defined by a high expression of genes likely coming from tumor microenvironment (TME) including immune cells and stromal cells.
1.3.3 Immune system and TNBC
Breast cancers were considered to be relatively less immunogenic than other type of cancers. High mutational load is one of the important determinants that can predict higher spontaneous immunogenicity of the tumor. Breast cancer harbor less mutational load compared to melanoma or lung cancer (17) (Figure 7).
Genomic mutations generate peptides that don’t exist in the repertoire as self-antigens. These new peptides can be recognized by adaptive immune cells as foreign
11
proteins presented by MHC molecule on the cell surface. Clinical trials using immune check point inhibitor (CPI) therapies in non–small cell lung cancer patients or colo rectal cancer with MSI (Microsatellite Instable) status, revealed neoantigen-specific T cell reactivity. A higher efficacy and response were reported in sub-group of cancer with higher neoantigens and mutation burden (18).
However other determinants are also important to consider such as the cellular phenotypes and metabolism functions of the TME, the amount of tumor infiltrating activated lymphocytes, the expression level of suppressive immunological ligands and the molecular signaling pathways in tumor cells.
Figure 7: The prevalence of somatic mutations across human cancer types
Relatively low mutational load in breast cancer compared to Melanoma or Lung squamous (Adopted from Alexandrov. 2013. (17))
Globally, breast cancer harbors a low mutational load and is less immunogenic than lung, melanoma or bladder cancers. However, TNBCs have higher mutational burden than other subtypes (Table 4) and are more immunogenic with a higher number of tumor-infiltrating lymphocytes (TILs) (18). A higher expression of programmed cell death 1 ligand 1 (PD-L1) was reported in TNBC Basal-like subtype compared to non-TNBC luminal subtype (19) (respectively 39% vs 4%). PD-L1 expression is significantly associated with the presence of TILs. High expression of PD-1 and/or PD-L1 is associated with a higher OS (Overall survival) and higher pCR (pathological Complete Response) rate in TNBC (20).
12
Luminal A Luminal B enriched HER2- Basal-like
Average mutational load
(mutations per exomic Mb) 25.2 41.4 61.5 50.4
Median% stromal TIL (IQR) (5–15) 7 (5–20) 10 (10–30) 15 (14.38–36.25) 25
Table 4: Gene analysis on mutational load and TIL according the molecular subtypes
(Adopted from Loi 2013(21))
Other determinants inducing immunogenicity of tumor cells are aberrant expression of proteins by the tumor cells. Some self-epitopes could be “neo-antigens” even without genetic mutation. For exemple, overexpression of proteins such as HER2 can also induce a specific immunogenicity. The amount of HER2 specific T-cells and anti-HER2 antibodies is correlated with the HER2 protein level expression. The detection of HER2 specific antibodies in serum of patients is associated with a significantly improved recurrence free survival compared to patients without detectable HER2 specific antibodies (22). In normal cells, MUC-1 is fully shielded in the fully glycosylated state. Aberrant processing of MUC-1 glycoprotein in tumor cells can triggers their immunogenicity.
In TNBC, high level of immune infiltration is a prognostic factor and predicts a good survival even in patients who haven’t received systemic adjuvant therapies (23). Several studies demonstrated significantly higher pCR rates after chemotherapy in immune-rich as compared to immune-poor TNBC (24). Among TNBC patients who received adjuvant chemotherapies, TIL counts are strongly predictive of cancer-free survival; each 10% increase in TIL count is associated with 18% of reduction risk of distant recurrence (8, 9). At diagnosis, approximately 5% to 15% of TNBCs are classified as lymphocyte predominant with abundant lymphocytes in the stroma. 15% to 20% of TNBC have no lymphocytic infiltration, whereas the majority (65%–80%) harbor low to moderate level of immune cells. Both stromal lymphocytes (residing in the stroma without direct contact with neoplastic cells) and intratumoral lymphocytes provide prognostic and predictive information. Stromal TILs are more abundant and, therefore, can be quantified more reliably (25).
Regarding lymphocyte recruitment into the tumor site, the role of tertiary lymphoid structures (TLSs) has recently gained attentions. TLSs are developed at the periphery or within tumor mass to limit disease progression or as a consequence of effective treatment intervention. They are also the sites of intense activity with mature dendritic cells in
13
contact with T cells, and germinal-like centers with the expansion of proliferating B cells. In breast cancer, TLSs are sometimes observed within the tumor core proximal to the stroma, and within an individual lymphoid structure (26, 27).
1.4 Breast cancer stem cells
1.4.1 Cancer stem cell (CSC)
Two major theories have been described to explain the expansion and evolution of cancer: The CSC model and Clonal evolution model. Those both theories have been a topic of scientific debates, during the past decades. The CSC model proposes that the growth and progression of cancers are driven by a rare subpopulation of CSC at the origin of a hierarchical organization. The clonal evolution model proposes that multiple genetic and epigenetic modification occur over time in individual cancer cell and in the microenvironment, confer a selective advantage allowing individual tumor clones to out-compete other clones, like Darwin’s theory evolution (Figure 8).
Figure 8: CSC model and Clonal evolution model
(Adopted form Adams. 2008(28) )
Debates between both models were already intense between 1950’s and 1970’s (Figure 9). Several experiments using single cell transplantation in animal models succeeded often using ascites liquids. Based on these observations, the concept that the tumor arises from CSC emerged in 1950 (called in this period “Stemline”) (29, 30). Clonal evolution model was proposed by Nowell in 1976 (31).
14
Figure 9: Horizon of CSC theory and Clonal evolution theory:
(a) Single cell transplantation of murine sarcoma from ascites (b) Single cell transplantation of murine breast cancer and passaging history in mice (c) CSC hypothesis in 1956 mentioned by Makino (Adopted from Ishibashi 1956, Makino 1956, Nowell 1976 (29-31))
CSC theory
Clonal evolution theory
15
The CSC theory was also well documented by John Dick’s group in human Acute Myeloid Leukemia confirming the existence of a primitive hematopoietic leukemic stem cell (32), at the origin of a leukemic hierarchy organization. Many experimental attempts were made after this initial report to identify such CSCs in various epithelial cancers as well as in breast cancer.
CSCs were functionally defined based on experimental models by limiting dilution transplantation of selected tumor compartment cell using fluorescence-activated cell sorting (FACS), into an orthotopic site in immunocompromised mice. CSCs population were thus characterized by their ability to initiate tumorigenesis, undergoing self-renewal and differentiation after iterative transplantation, whereas the remaining majority of non-CSCs lacked these in vivo proliferation properties and were supposed to more “committed or engage” into a differentiation lineage.
In breast cancer, CSCs or Tumor Initiating Cells was confirmed by Al Hajj et al., in 2003 (33). They identified CD44+CD24-/low sub-population cells that are able to form new
tumor in fad pat transplantation studies after serially passages.
It has been shown that CSCs are de- or undifferentiated cells expressing stem cell-like genes and signaling pathways similar to normal stem cell counterparts, including the genes related to drug resistance, EMT markers and dormancy. Intensive interest on CSC research has been based on the issues of cancer recurrence and metastasis in patients after primary treatment, even after a long period of clinical apparent remission. The principal reason of cancer relapse and metastasis is the persistence of CSC resistant to cytotoxic chemotherapy and/or radiation, and indeed therapies targeting specifically CSCs remain a crucial challenge.
1.4.2 Embryonic stem cell-like gene signature in TNBC
Tumor cells lost gradually specific and appropriate differentiation pattern, they are able to progressively dedifferentiate and will acquire autonomous proliferation, migration, and survival. Those dedifferentiated tumor cells were shown to share molecular and epigenetic profile and features of normal stem cells. Indeed, accumulated evidence has shown that some cancer epithelial cells could re-express very immature state – like embryonic genes like Oct4 and Sox2 (34).
Embryonic-like genetic signature was indeed observed in poorly differentiated human tumors of advanced stage (35). Chang’s and Weinberg’s groups observed
16
independently in 2008 that several aggressive cancers harbor from gene expression profiles of large-scale data set, an embryonic stem cell-like gene signature (Figure 10) (35, 36). They observed gene expression of ESC-like signature in Grade 3 breast cancer, Invasive hepatocellular carcinoma, diffuse large B-cell lymphoma, high grade gliomas and bladder carcinomas (34, 37, 38). Following years, other groups verified these observations in many other tumor types.
Chang’s group analyzed gene expressions of mouse ESC, differentiated cells and adult stem cells from the various organs. The genetic clustering revealed the two distinct clustering of ESC-like and another adult stem cell specific mapping including mammary stem cells. They proposed that the activation of an ES-cell-like transcriptional program via Myc may induce the characteristics of CSCs.
Weinberg group showed ES-like gene expressions in several classifications of breast cancer mostly in basal-like subtype from Grade 3. Additionally, the repression of PRC target genes was observed. Tumors with larger size at the time of diagnosis (more than 2 cm diameter) were more likely to possess the ES signature compared to smaller tumors.
Kaplan-Meier analyses of OS using both overexpression of the ES expression module and underexpression of the PRC2 targets module showed that individuals bearing tumors with this signature had worse survival rates. It was also shown that the ESC-like signature expression in primary human breast cancers is significantly correlated with expression of CSC-enriched CD44+CD24−/low subpopulation phenotype. This
suggests that ESC-like signature may be activated in the tumor initiating cells / CSCs. Collectively, ESC-like signature correlates with aggressive breast tumor behavior (Figure 10).
17
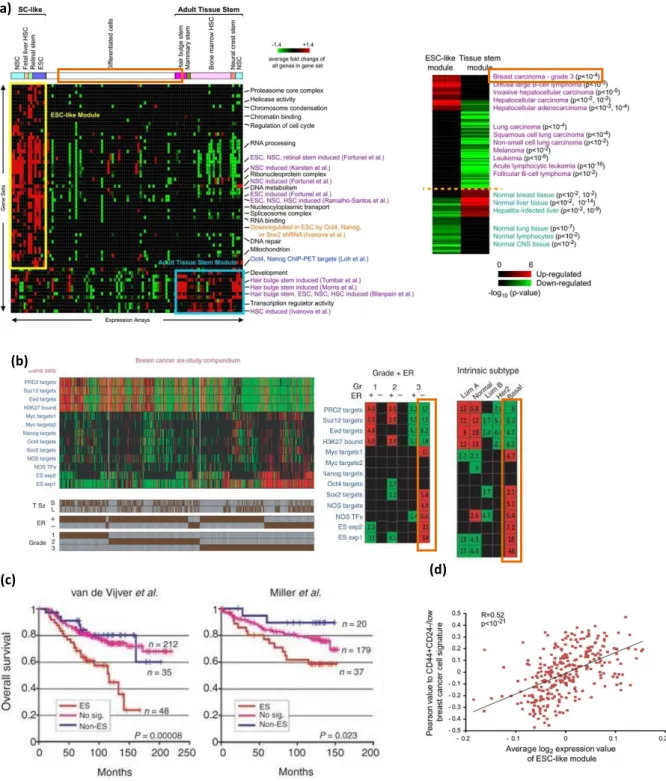
Figure 10: Poorly differentiated breast cancers show an ES-like enrichment pattern.
(a) Mammary stem cell was clustered within adult tissue classification whereas Grade 3 breast carcinoma expressed ES like gene module.
(b) Enrichment pattern of indicated gene sets (rows) across 1,211 breast cancer samples (columns) included in six profiling studies. Red and green indicate significantly over- or underexpressed gene sets, respectively. Shown are 1,089 tumors for which both ER status and grade were available. Brown bars (bottom) indicate individual tumor annotations for grade, ER
(d) (c)
(b)
18
status and tumor size (T Sz), where available. S, tumor smaller than 2 cm across (pathological T1); L, tumor larger than 2 cm (pathological T2 or T3).
(c) Kaplan-Meier analyses of disease-specific survival of individuals with breast cancer included in three of the five studies analyzed.
(d) Correlation of Pearson value to CD44+CD24−/low tumorigenic breast cancer cell signature with
average log2 expression value of ESC-like module in the primary human breast cancers (Adopted from Wong. Ben-Porath 2008.(35) (36))
An active ES-cell-like expression program has been observed upon inactivation of p53 in breast and lung cancer. Interestingly, the p53 tumour suppressor pathway is closely linked to somatic cell reprogramming (39). Reduction activity of p53 in hESCs promote spontaneous sub-chromosomal abnormalities and epigenetic changes similar to those found in embryonic carcinomas and aggressive teratocarcinomas (40). TP53 inactivation and stemness features are closely associated in breast cancer (42) particularly in basal-like subtype and HER-2 enriched subtypes (Figure 11). Given these facts, it is speculated that dysfunction of TP53 in BLBC have critical influence on the induction of de-differentiation machinery into ES-like status.
There are still open questions. Is p53 mutation and p53 dysfunction the primary cause of TNBC, basal-like and then ES-like gene signature? Or, are the genetic instability caused by basal-like or ES-like cancer cells more susceptible to p53 mutation leading to more aggressive behavior? How exactly tumor microenvironment involves this process? Answers to those questions should clarify clearer mechanism of cancer initiation and CSC function in tumor cell population in the future.
19
Figure 11: ES like gene signature in breast cancers
(a) Basal-like and HER2 subtypes show ESC signature (b) High scores for the ESC signature correlated highly with the tumor's p53 mutational status. (c) Mutated gene analysis using Tumor samples of luminal A (n= 225), luminal B (n= 126), HER2E (n= 57) and basal-like (n= 93). 80% of basal-like subtype has TP53 mutation.
(Modified from Mizuno 2010, The cancer genome altas network 2012) (41, 42)
1.4.3 Stemness molecular profile in breast cancer
Molecular circuits like ES or stem cells in breast cancers further support the background of ES-like signature of advanced TNBCs. There are many evidences that specific pathways and transcription factors (TFs) are shared between stem cells and TNBCs. The critical molecular pathways and transcription programs in breast CSCs are summarized in Table 5.
(a) (b)
20
Table 5: Important molecular pathways and transcription programs in breast CSC
Transcription factors
Oct4 Oct4 inhibition decreased CSC and tumor growth in breast and lung cancer
model
Hu 2008 (43) Ectopic expression of Oct4 into normal primary breast epithelial preparations generated cell lines forming triple-negative breast carcinomas in nude mice
Beltran 2011(44)
Sox2 Expression in early stage breast cancer Leis 2012
(45) Nanog BC patients with strong expression of Nanog had significantly lower
disease-free survival and OS rates than those with weak expression of Nanog
Nagata 2014(46)
Down-regulation/knockdown of Nanog reduced cell proliferation,
expression levels of cyclinD1 and c-Myc in BC cells. This blocked the cell cycle at G0/G1 phases
Han 2012 (47)
c-Myc c-Myc was sufficient to reactivate the ESC-like program in normal and cancer cells
Wong 2008
(36) Identification of Myc-centered regulatory network in ES cells.
Myc rather than core pluripotency module accounts for the shared signatures of embryonic stem and cancer cells
Kim 2010 (37)
Pathways
Hedgehog EMT programs promote basal mammary stem cell and tumor-initiating cell
stemness by inducing primary ciliogenesis and Hedgehog signaling
Guen 2017 (48) Hedgehog signaling components PTCH1, Gli1, and Gli2 are highly
expressed in normal human mammary stem / progenitor cells cultured as mammospheres and that these genes are down-regulated when cells are induced to differentiate.
Overexpression of Gli2 in mammosphere-initiating cells results in the production of ductal hyperplasia, and modulation of Bmi-1 expression in mammosphere-initiating cells alters mammary development.
Liu 2006 (49)
Wnt/β-catenin
Induction of Mammary gland tumorigenesis Michaelson
2001 (50) IL-6/JAK2
/Stat3
Preferentially active in CD44+CD24- breast cancer cells Tsukamoto
1988(51) Notch Notch4 signaling activity was 8-fold higher in breast cancer stem
cell-enriched cell populations.
Harrison 2010 (52)
TGF-β Increase CSC population in SMAD4 dependent manner. TGF-β–responsive
gene signature score was significantly enriched by chemotherapy in biopsies from TNBC patients. Bhola 2013 (53) miRNAs miRNA-200 family
miRNA-200c strongly suppressed the ability of normal
mammary stem cells to form mammary ducts and tumor formation driven by human breast CSCs in vivo
Shimono 2009(54)
Let-7 let-7 miRNAs were markedly reduced in breast tumor initiating cells and increased with differentiation
Lin28 as a negative regulator of miRNA biogenesis and suggest that Lin28 may play a central role in blocking miRNA-mediated differentiation in stem cells and in certain cancers.
An inflammatory response mediated by NF-κB that directly activates Lin28 transcription and rapidly reduces let-7 microRNA levels.
Yu 2007(55) Viswanathan 2008 (56) Iliopoulos 2009(57)
21
The main core of pluripotent TFs (Oct4, Sox2 and NANOG) and c-Myc have been found to have critical roles in breast cancer. Those TFs are inactive in mammary gland cells except during lactation phase, and can be activated in malignancy. Strong expression of Nanog in breast cancer correlated with dismal prognosis with a significantly lower disease-free survival and OS rates (46). Down-regulation or knockdown of Nanog reduced cell proliferation, expression levels of cyclinD1 and c-Myc in breast cancer cells which are blocked in G0/G1 phases of cell cycle (47). c-Myc was sufficient to reactivate the ESC-like program in normal and cancer cells (36). Oct4 inhibition decreased CSC and tumor growth in breast and lung cancer model (43). Ectopic expression of Oct4 into normal primary breast epithelial cells generated breast carcinomas in nude mice (44).
In ES cells, transcriptional regulation can be subdivided into functionally separable regulatory units (37). Modules for the core pluripotency factors (Core module: Oct4, Nanog, Sox2, Smad1, Stat3, Klf4, Nac1, Zfp281, and Dax1), the Polycomb complex factors (PRC module: Suz12, Eed, Phc1, and Rnf2), and the Myc-related factors (Myc module: Myc, Max, nMyc, Dmap1, E2F1, E2F4, and Zfx). Myc module was functionally separated from core module in regulating aspects of ES cell identity. Myc modules covered more target genes than the ES cell core factors and were suggested to have more global roles in their target gene regulation.
The molecular pathways that support maintenance and metabolism of stem cells have also critical role in CSCs. Hedgehog signaling components PTCH1, Gli1, and Gli2 are highly expressed in normal human mammary stem / progenitor cells cultured as mammospheres. These genes are down-regulated when mammary cells are induced to differentiate. Overexpression of Gli2 in mammosphere-initiating cells results in the production of ductal hyperplasia. Modulation of Bmi-1 expression in mammosphere-initiating cells alters mammary development (49). EMT programs promote basal mammary stem cell and tumor-initiating cell stemness by inducing primary ciliogenesis and Hedgehog signaling (48). Wnt/β-catenin pathway were shown to induce mammary gland tumorigenesis (50). IL-6/JAK2/Stat3 pathway was preferentially active in CD44+CD24- breast CSCs (51). Notch4 signaling activity was 8-fold higher in breast
CSCs-enriched cell populations (52). TGF-β–responsive gene signature score was significantly enriched by chemotherapy in TNBC specimens and the increase of breast CSC population was SMAD4 dependent manner (53)
22
In addition to these genes and signaling pathways, critical role of micro RNA (miRNA) in maintenance of normal stem cells and CSCs are being revealed recently. miR-200c strongly suppressed the ability of normal mammary stem cells to form mammary ducts and tumor formation driven by human breast CSCs in vivo (54). Let-7 miRNAs were markedly reduced in breast tumor initiating cells and increased with differentiation. Lin28, as a negative regulator of let-7 miRNA biogenesis, may play a central role in blocking miRNA-mediated differentiation in stem cells and some cancers. Inflammatory response mediated by NF-κB can directly activates Lin28 transcription and rapidly reduces let-7 miRNA levels and maintain CSCs (55, 57, 58).
The pathways and transcriptional programs that are involved in CSC transformation in TNBCs are summarized in Figure 12.
23
Figure 12: Schematic model of CSC transformation
(a) Molecular circuits, transcription factors, miRNAs that can influence CSC phenotype
(b) TNBC CSC model. P53, miR-200, let-7 are inactive or down-regulated, whereas molecular pathways including TGF β /SMAD, WNT/β -catenin, Hedgehog and JAK/STAT pathway are activated. Pluripotent TFs and EMT TFs are overexpressed.
Altogether, those molecular changes lead the cells to lost their identity and to promote cell transformation into ES-cell like CSCs with high proliferation, drug resistance, EMT phenotype and invasion.
(a)
24 1.4.4 Breast Cancer Stem Cells
The presence of CSCs in breast tumors is likely one of the main reasons why current conventional therapies are not sufficiently effective to eradicate all of the tumor population which often lead to relapse and metastasis. Al Hajj et al. found in 2003 that
CD44+CD24−/low population was significantly enriched in tumor-initiating cells with
self-renewal capacity (33).
Most of the breast tumors that possess more than 10% of CD44+CD24−/low cells
express basal markers CK5, P-cadherin, CK14 and vimentin. 76.5% of basal-like subtype expressed ≥10% of CD44+CD24−/low cells(59). Another group also observed that 69% of
luminal A, 70% of luminal B, 52% of HER2, and 100% of basal-like tumors contained some CD44+CD24−/low cells. The relative frequency of CD44+ and CD24+ cells in breast
tumors was correlated with distant metastasis-free survival (60). CD44+CD24−/low
population was also shown to be chemoresistance. Hedgehog signaling pathway is highly expressed in this population (61). Alternatively, a small ubiquitin-like modifier (SUMO) pathway has been shown to correlate with this population and its invasion (62). SUMO (particularly SUMO1) is also known to involve ES self-renewal.
Aldehyde dehydrogenases (ALDH1) has been shown to be a marker of normal and malignant human mammary stem cells (63). In 179 cases of breast cancer, the positive expression rate of ALDH1 was 16.7% in luminal A subtype, 21.4% in luminal B subtype, 54.5% in Her2-enriched subtype, 33.3% in basal-like subtype (64). Another study showed that ALDH1+ breast cancers were significantly associated with the phenotype of hormone receptor negative and HER2 positive BC (65). Thus, ALDH1 expression is seen highest in HER2-enriched subtype whereas CD44+CD24−/low prevalence was highest in basal-like
subtype.
Recent report showed a molecular link between normal breast stem cells,
CD44+CD24−/low
breast cancer cells, and embryonic carcinoma cells that commonly down-regulate miR-200c-141, miR-200b-200a-429, and miR-183-96-182. Expression of BMI1, a well-known self-renewal regulator in stem cell, is modulated by 200c. miR-200c inhibited the clonal expansion of breast cancer cells and suppressed the growth of embryonic carcinoma cells. The components of EMT pathways including SNAI2 are highest in the CD44+CD24−/lowlineage−
breast cancer cells. miR-200 family miRNAs were strongly suppressed in CD44+CD24−/low breast cancer cells. The miR-200 family
25
Vimentin expression is one of the characteristics of epithelial mesenchymal transition (EMT) that may play a role in migration and metastatic invasion. Basal-like breast tumors were reported to show high expression of multiple EMT markers and were reported to have intrinsic phenotypic plasticity for mesenchymal transition. Thus, there is a link between stem cell–like phenotype, EMT, and basal-like subtype of breast cancer. Claudin low breast cancer type shows EMT markers. However, not all basal-like tumors are uniformly vimentin positive, suggesting a heterogeneity among this tumor subtype.
Despite the growing list of CSC markers, several of these are not uniformly useful in identifying CSCs. For example, although the CD44+CD24−/low profile was used in early
studies of breast CSCs, the authors report that not all breast cancer cell populations could be stratified using this set of markers.
1.4.5 Tumor evolution of TNBC
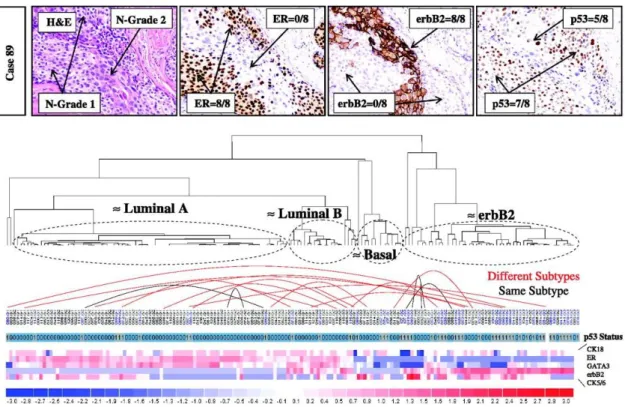
To discuss about CSC as tumor initiating cell, my central question has been how TNBC initiate in the mammary tissue and how it evolved towards an invasive cancer. Most of TNBCs are diagnosed at invasive stage (IDC). In contrast, ductal hyperplasia (ADH) or, DCIS are mostly revealed in mammography screening without any clinical signs. It has been revealed that those tumors have already intratumoral heterogenicity including histological grade, IHC staining and molecular subtypes. Allred et al. described the diversity and existence of multi-subtypes of cells in DCIS tumor (66). Figure 13 shows the specimen from one patient including different status of histological grade, ER and HER2 expression depending on the microlocation of the tumor. Clustering of gene expression showed that proportion of luminal, basal, and HER2-enriched intrinsic subtypes observed in DCIS is similar to the previous studies in invasive breast cancers (i.e 44%, 8%, and 28% respectively from 25 DCIS samples). In 120 cases of DCIS, histological grading showed 45.8% of diversity including 30.0% with grades 1 and 2, 6.6% with grades 2 and 3, and 9.2% with grades 1, 2, and 3. This result indicate that DCIS represent a pre-invasive stage already heterogenous, and that genomic analysis become crucial since the early stage of the disease.
26
Figure 13: Diversity and existence of multi-subtypes within DCIS tumor
(a) IHC photos of one DCIS from a patient including different types of cancer cells
(b) Gene clustering of molecular subtype showed presence of multi-subtypes. The red curve lines in the genetic clustering of the molecular subtype show presence of some different subtypes in one specimen. (Adopted from Allured et al., 2008 (66))
Kim et al., showed important insight in chemoresistance mechanism and clonal selection by CNA (Copy number aberration) analysis of twenty TNBC samples (67) (Figure 14). In responder (extinction) cases, two or three major clones were eliminated after chemotherapy. In two resistant cases, two minor clones (7.7% and 18.6% respectively) initialy present at pre-treatment became the majority (71.8% and 100%) after treatment. Another resistant case showed 67.4% to 87% of dominant clone before and after therapy. In some resistant tumor, new clone emerged after middle of chemotherapy and became 37%, with other driving clone selected under chemoptherapy from 5.7% to 41.4%. Classification of molecular subtype by single cell RNA analysis revealed co-existence of multi-subclones and the proportion of molecular changes after therapy.