04 August 2020
POLITECNICO DI TORINO
Repository ISTITUZIONALE
Pure and Fe-doped CeO2 nanoparticles obtained by microwave assisted combustion synthesis: Physico-chemical properties ruling their catalytic activity towards CO oxidation and soot combustion / SAHOO, TAPAS RANJAN; ARMANDI, MARCO; Arletti, Rossella; PIUMETTI, MARCO; BENSAID, SAMIR; Manzoli, Maela; Panda, Sirish R.; BONELLI, BARBARA. - In: APPLIED CATALYSIS. B, ENVIRONMENTAL. - ISSN 0926-3373. - STAMPA. - 211(2017), pp. 31-45.
Original
Pure and Fe-doped CeO2 nanoparticles obtained by microwave assisted combustion synthesis: Physico-chemical properties ruling their catalytic activity towards CO oxidation
elsevier Publisher: Published DOI:10.1016/j.apcatb.2017.04.032 Terms of use: openAccess Publisher copyright
-(Article begins on next page)
This article is made available under terms and conditions as specified in the corresponding bibliographic description in the repository
Availability:
This version is available at: 11583/2671338 since: 2017-07-17T11:31:03Z Elsevier B.V.
1
Pure and Fe-doped CeO2 nanoparticles obtained by microwave assisted combustion
synthesis: physico-chemical properties ruling their catalytic activity towards CO oxidation and soot combustion
Tapas R. Sahoo,1,§ Marco Armandi,2, § Rossella Arletti,3 Marco Piumetti,2 Samir Bensaid,2 Maela Manzoli,4 Sirish R. Panda,1 Barbara Bonelli*2,5
1 Department of Chemistry, School of Applied Sciences & Center of Industrial Technology, KIIT University, Bhubaneswar 751024, Odisha, INDIA.
2 Department of Applied Science and Technology, Politecnico di Torino, Corso Duca degli Abruzzi 24, 10129 Torino, ITALY.
3 Department of Earth Sciences, Università degli Studi di Torino, Via Valperga Caluso 35, 10125 Torino, ITALY.
4 Department of Drug Science and Technology, Università degli Studi di Torino, Via Pietro Giuria 9, 10125 Torino, ITALY.
5INSTM Unit of Torino-Politecnico, Corso Duca degli Abruzzi 24, 10129 Torino, ITALY.
§ Both authors equally contributed to the work.
*Corresponding author’s email [email protected]
Keywords: CeO2 nanoparticles, Fe-doping, Microwave Assisted Combustion Synthesis, CO oxidation, soot combustion.
2
Abstract
A sample of pure CeO2 and two samples of Fe-doped CeO2 containing either 3 or 6 at. % Fe were obtained by microwave assisted combustion synthesis. The powders were extensively characterized by several techniques and tested as catalysts for both CO oxidation and soot combustion.
As-synthesized CeO2 nanoparticles have a mostly squared shape and size well below 100 nm; they are characterized by the presence of surface Ce3+ species likely due to the occurrence of very defective ceria crystalline phases, as revealed by HR-TEM. Oxidation at 400 °C leads to the formation of a hydroxyls-rich surface, with several types of OH groups related to both Ce4+ and Ce3+ species; reduction in H2 at mild temperature (200 °C) leads both to reduction of surface Ce4+ to Ce3+ and formation of new OH groups.
With respect to CeO2 nanoparticles, Fe-doped ones have, as a whole, a larger size and less abundant surface OH species. A core-shell structure is inferred where Fe is mostly present in the shell, both in a secondary phase (CeFeO3) and as a dopant, finally lowering the band gap of the material. The presence of Fe improved samples reducibility, as shown by the lowering of the onset of temperature programmed reduction.
Catalytic tests of CO oxidation showed that surface Fe species significantly improve the catalytic performance of the samples, by lowering the onset of CO conversion to CO2 especially at low Fe content (i.e. 3 at. %), whereas at 6 at.% Fe loading, the preferential formation of the secondary phase CeFeO3 occurs, finally lowering the CO conversion with respect to the sample containing 3 at. % Fe.
3 Conversely, the soot combustion activity was higher for pure CeO2 nanoparticles, likely due to their smaller size, which increases the amount of solid-solid contact points between soot and the catalyst. However, a positive effect of the presence of surface Fe species on the catalytic activity towards soot combustion was observed, as well.
1. Introduction
CeO2 is one of the most studied metal oxides having environmental and/or energy applications: the CeO2-ZrO2 mixed oxide is a component of three-ways-catalyst used for automotive post-combustion [1-3], whereas (variously doped) CeO2 is studied, inter alia, as solid electrolyte for solid oxide fuel cells (SOFCs), especially in nanometric form [4,5].
Some intrinsic properties of CeO2, i.e. the cubic (fluorite) structure and the cerium attitude to undergo fast and reversible Ce4+/Ce3+ redox cycles, render CeO
2 a material with peculiar properties: the crystalline structure, stable in a wide range of temperatures and pressures, allows storing/releasing oxygen, eventually acting as an oxygen pump [6,7]. The high mobility of oxygen within CeO2 bulk is a crucial issue in any catalytic and electrochemical application [8] and is extensively studied by means of both experimental and theoretical methods [9-12]. Oxygen mobility is related to the presence of an intrinsic amount of structural defects/oxygen vacancies that increase by doping with either a Lanthanide or another metal with oxidation state lower than + 4 [7,9].
The nanotechnologies era and the development of new synthetic routes allowed obtaining both pure and doped CeO2 nanoparticles (NPs) that bear some peculiar features, e.g. a higher oxygen mobility, with respect to those obtained by traditional methods [13,14]. By varying the synthesis
4 parameters, CeO2 NPs with different size and morphology, i.e. disordered polyhedrons, wires, disks, flowers, cubes, etc. [15] are produced. Different morphologies are obtained by various methods, including addition of organic/inorganic templates or capping agents, variation of pH, etc. Those methods are, however, complicated and/or require the use of some costly and non-green reagent (e.g. a surfactant as organic template). Changes in morphology affect the surface properties of CeO2 NPs, the defects chemistry of the material and the related catalytic activity, especially as far as CeO2 reducibility is concerned [16].
Combustion synthesis (CS) is a suitable alternative route for the preparation of metal oxides-based catalysts and ceramics, since it allows obtaining nanostructured materials with high specific surface area in a simple and rapid way [17]. During Solution Combustion Synthesis (SCS), a fast and spontaneous reaction occurs between the oxidizer (e.g. a metal nitrate) and the fuel (e.g. glycine) in solution. The method is reproducible, employs low cost reagents and produces, and produces in a single batch a sizable amount of powder that can undergo successive treatments, e.g. calcination in order to get rid of the fuel excess.
Microwave Assisted Combustion Synthesis (MACS) is carried out within a microwaves oven, ensuring shorter reaction times and a more homogeneous heating of the reagents mixture. MACS has become a technique of choice for the preparation of materials, especially ceramics, where it is important to avoid temperature gradients that may induce fractures formation in the final product [18]. Microwaves heat species in solution at a molecular level, whereas an electric oven heats a mixture from the exterior to the interior, ultimately creating a temperature gradient and leading to the production of heterogeneous powders. In MACS, the electromagnetic radiation interacts with polar reagents, and so the dipoles tend to align with respect to the electric field, inducing dipole oscillations with the radiation, and increasing absorption of energy. Oscillating molecules collide
5 more frequently and at higher energy, facilitating bonds breakage and new bonds formation: the heat needed for the reaction is generated within the mixture, without the necessity of an external source.
MACS allows rapidly obtaining considerable amounts of phases that are stable at high temperature (oxides, nitrides, carbides) and characterized by nanometer size, high specific surface area and high defectivity, all parameters that are crucial for catalytic applications, as well.
To the best of our knowledge, no paper on Fe-doped CeO2 powders obtained by MACS for catalytic applications has been published, so far: in this work, MACS was employed to synthesize both pure and Fe-doped CeO2 powders (with composition Ce1-xFexO2 where x = 0.03 or 0.06). The choice of Fe as a dopant stems from its higher abundance with respect to Lanthanides, and the possibility to increase the amount of oxygen vacancies, which can lead to a higher number of labile oxygen species at NPs surface, with an ultimate positive impact on the catalytic activity.
As a catalyst for energy and environmental applications, CeO2 has been recently proposed for the splitting of water [19,20], although CeO2-based nanocatalysts gave good performance (in terms of both activity and selectivity) also in the production of H2 from ethanol reforming [21]. Similarly, CeO2-supported Rh, Pd, Pt and Au NPs showed enhanced catalytic properties in two important reactions for H2 purification, i.e. the preferential oxidation of CO (COPROX) in the presence of H2 and the water gas shift (WGS) reaction [22-33]. In this work, yet other two reactions of environmental relevance were studied, i.e. oxidation of CO and soot combustion, for which CeO2 -based nanocatalysts are investigated in the literature [34-45]. In the former reaction, the presence of surface labile oxygen species (O) is a crucial aspect, whereas in the latter reaction, the textural and structural properties of the catalyst as well as the contact points between soot and catalyst particles play a crucial role.
6
2. Experimental 2.1 Materials synthesis
Stoichiometric amounts of analytical grade reagents were used, i.e. 1 g ceric ammonium nitrate ((NH4)2[Ce(NO3)6]), and either 0.023 g or 0.047 g ferric nitrate (Fe(NO3)3) in order to obtain Ce0.98Fe0.03O2 and Ce0.94Fe0.06O2 compositions, respectively. Correspondingly, either 0.5277 g or 0.5395g glycine (fuel) was added as dictated by the oxidizer/fuel ratio [46]. The resulting mixture was exposed to MW irradiation in a microwave oven, heated at high power of 800 W and frequency of 2450 MHz, for a maximum of 3 min. During this period, the redox mixture boiled, underwent dehydration and then was ignited (due to internal heating), resulting in an exothermic reaction with a flame persistent for 2-4 secs. This process is instantaneous, and the resulting residue was powdery and crystalline (see below). The three samples will be referred to as CeO2 (0 at. % Fe), Ce_Fe3 and Ce_Fe6 (3, 6 at. % Fe, respectively).
2.2 Methods
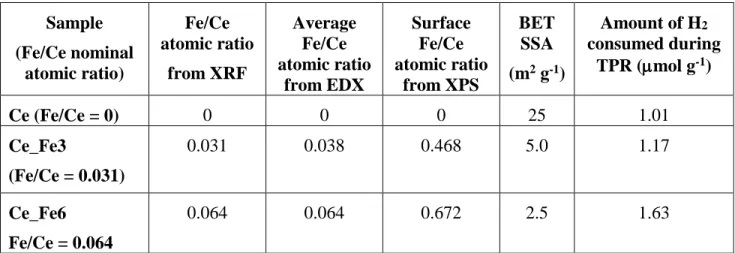
N2 sorption isotherms at −196 °C were measured on the powders previously outgassed at 150 °C in order to remove water and other atmospheric contaminants (Quantachrome Autosorb 1C); samples specific surface area (SSA) was calculated according to the Brunauer–Emmett–Teller (BET) method, the corresponding values being reported in Table 1.
Field Emission Scanning Electron Microscopy (FESEM) micrographs (Fig. SM1) were collected on a Zeiss Merlin microscope equipped with a Gemini II column.
Electron micrographs were obtained on a Jeol 3010-UHR high-resolution transmission electron microscope (HR-TEM) operating at 300 kV and equipped with a LaB6 filament and an Oxford Inca Energy TEM 300 EDX analyser by Oxford Link. Digital micrographs were acquired on an
7 Ultrascan 1000 camera and processed by Gatan digital micrograph. Before experiments, the powder samples were milled in an agate mortar and deposited on a copper grid covered with Lacey carbon film.
To measure X-ray Fluorescence (XRF), samples were pressed in order to obtain pellets of ca. 1 cm2 area, and analyzed by means of a Rigaku ZSX 100s instrument, on 0.3 cm2 spots.
X-Ray Powder Diffraction (XRPD) experiments were performed at the ID22 high-resolution beamline at ESRF (European Synchrotron Radiation Facility) in Grenoble (France) with a fixed wavelength of 0.4106 Å on a multi-channel detector system. The powder samples were loaded and packed in a 0.3 mm boron capillary, mounted on a standard goniometric head, and spinned during data collection. Structural and unit cell refinements were performed by full profile Rietveld analysis using the GSAS package [47] with EXPGUI interface [48]. The refinements were performed in the space group Fm-3m. The Bragg peak profile was modeled by using a pseudo-Voigt function [49] with 0.001% cutoff peak intensity. The background curve was fitted using a Chebyschev polynomial with 9 variable coefficients. The 2θ−zero shift was accurately refined in separate cycles to avoid correlation with unit cell parameter. The scale factor, unit-cell parameters and displacement thermal parameter were allowed to vary. The high resolution and high flux available on the beamline allowed identifying the presence of CeFeO3 in both Ce_Fe3 and Ce_Fe6 samples as secondary phase (vide infra). The refinements of the collected patterns were treated as a two phases analysis and quantitative phase analyses (QPA) were performed by allowing the variation of the two scale factors.
From XRPD analyses, information on the full width at half maximum (FWHM) was extracted and used to estimate the average micro-strain and crystallite size calculated form Williamson –Hall plot, on the basis of the eq. (1):
8 β 𝑐𝑜𝑠 =
𝑡 + 4 sin (1)
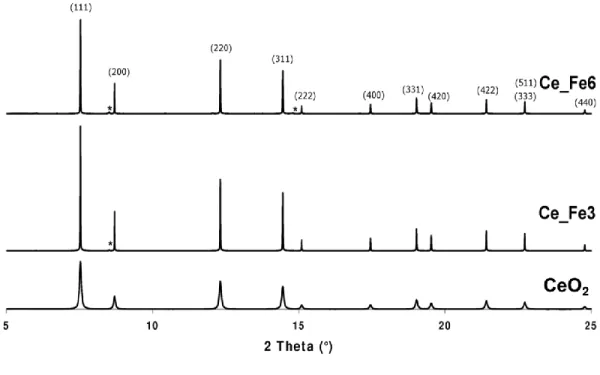
In eq. (1), β is FWHM, is the wavelength, t is the crystallite size, is the Bragg angle and is the micro-strain. The results of the refinements and the XRPD are reported in Table 2 and Figure 2, respectively. Williamson-Hall plots for the three samples are reported in Figure 3.
XPS (X-ray Photoelectron Spectroscopy) analysis was carried out on a XPS PHI 5000 Versa probe apparatus, using a band-pass energy of 187.85 eV, a 45° take off angle and a 100.0 m diameter X-ray spot size for survey spectra. High-resolution XP spectra were recorded in the following conditions: pass energy of 20 eV, resolution of 0.1 eV, and step of 0.2 eV. Sample charging effects were eliminated by referring to the spectral line shift of the C 1s binding energy (BE) value at 284.5 eV. XP-spectra were analyzed by means of a commercial software (CasaXPS, version 2.3.16), by applying mixed Gaussian-Lorentzian (70-30%) profiles.
H2-TPR (Temperature Programmed Reduction) analysis was carried out on a TPD/R/O 1100 ThermoQuest instrument: in each experiment, ca. 100 mg sample was treated under constant flow (20 mL min−1) of 5 vol. % H2/Ar mixture in the 50-900 °C temperature range (temperature ramp = 10 °C min−1) and holding at 900 °C for 30 min. Before analysis, samples were pretreated under pure O2 flow from room temperature to 400 °C (temperature ramp = 10 °C min−1).
For micro-Raman spectroscopy, the powders were gently pressed on a glass microscope slide and analyzed by means of a Renishaw InVia Reflex micro-Raman spectrometer (Renishaw plc, Wottonunder-Edge, UK), equipped with a cooled CCD camera. The Raman source was a diode laser (ex=514.5 nm), and samples inspection occurred through a microscope objective (50X), in backscattering light collection in the following experimental conditions: 10 mW laser power; 10 s exposure time and 1 accumulation.
9 Fourier Transform Infra Red (FT-IR) spectra were recorded at 2 cm-1 resolution on a Bruker FTIR Equinox 55 spectrometer, equipped with a MCT (Mercury Cadmium Tellurium) cryodetector. For IR measurements, samples were shaped as thin, self-supporting wafers (ca. 15-20 mg cm-2). Adsorption of CO at nominal -196 °C was studied by using a homemade quartz IR cell equipped with (IR transparent) KBr windows that allows pouring liquid N2 to cool down the sample. CO was dosed on samples by admitting increasing amount of gas within the cell and by waiting equilibrium (CO equilibrium pressures in the 0.05-15 mbar range).
Before CO adsorption, the IR cell was connected to a standard vacuum frame (residual pressure below 10-3 mbar) and the samples were treated under vacuum at high temperature (in order to remove water and other atmospheric contaminants) or treated at high temperature under controlled atmospheres (O2 or H2) in order to study oxidized/reduced surfaces.
Diffuse Reflectance (DR) UV-Vis spectra were measured on a Cary 5000 UV-Vis-NIR spectrophotometer (Varian instruments).
2.3 Catalytic tests
Catalytic activity of the samples was tested in a temperature-programmed oxidation (TPO) setup, comprising a quartz U-tube micro-reactor; a PID-regulated (Proportional-Integral-Derivative) furnace; a K-type thermocouple (placed at the reactor inlet in such a way that its tip is as close as possible to the reactor bed) and a non-dispersive infrared (NDIR) analyser (ABB Uras 14) as gas detector.
2.3.1 CO oxidation tests: the bed reactor contains 100 mg catalyst. A gaseous mixture of CO (1000 ppm-vol) and 10 % v/v O2 in N2 is fed to the reactor at a flow rate of 50 Nml min-1,
10 while the furnace temperature gradually increases from ambient temperature (heating rate = 5 °C min-1) to the temperature at which CO is fully converted to CO
2.
2.3.2. Soot combustion tests: the bed reactor consists in a mixture of 150 mg SiO2, 45 mg catalyst and 5 mg soot that is ball-milled for 15 min in order to obtain a “tight” soot-catalyst contact (Degussa Printex-U was used as model soot). “Tight contact” conditions are the optimal way to discriminate the intrinsic activity of the catalyst, i.e. to avoid the occurrence of kinetic limitations due to the poor availability of catalyst actually in contact with soot particles. 100 Nml min-1 oxidizing gas mixture (10 % v/v O2 in N2) is fed into the reactor while the furnace temperature gradually increases from ambient temperature to 700 °C (heating rate = 5 °C min-1). The gaseous mixtures were analysed by CO/CO2 NDIR analysers (ABB), simultaneously recording the temperature of the fixed-bed and the CO/CO2 outlet concentration during reaction. Temperatures corresponding to 10%, 50% and 90% conversion of either CO or soot (denoted as T10%, T50%, and T90%, respectively) were taken as indices of catalytic activity, along with the temperature at which the peak of CO2 emission occurred (TpeakCO2)
In order to get insight into the phenomena related to the behaviour of catalytically active oxygen species in the presence of soot and in the absence of O2(g), soot-TPR measurements (Fig. SM6) were carried out as follows: a bed mixture like that used for soot combustion tests was prepared in “tight contact” conditions and put inside the fixed-bed micro-reactor where pure N2(g) was fed at 100 ml min-1. The furnace temperature was increased from ambient to 650 °C (heating rate = 5 °C min-1) and CO/CO2 concentrations were measured at the reactor outlet (NDRI analysers).
Additional repeatability tests were carried out: first, fresh powders were tested under the same conditions adopted during previous soot combustion tests, and then each (newly tested) powder
11 was recovered at the end of the first cycle and subjected to a second oxidation cycle (by re-addition of the same amount of soot), to check stability after exposure to high temperatures.
3. Results and Discussion
3.1 Textural, morphological and compositional characterization of the samples
N2 adsorption/desorption isotherms (not reported) measured at -196 °C on the three samples were of Type II, with limited hysteresis loops likely due to some inter-particles porosity. CeO2 sample showed the largest BET SSA value (25 m2 g-1, Table 1) whereas Fe-doping led to a BET SSA decrease with both Ce_Fe3 (5.0 m2 g-1) and Ce_Fe6 (2.5 m2 g-1) samples. Accordingly, Fe-doping led to the occurrence of larger NPs and higher degree of aggregation, as observed by FE-SEM analysis (Fig. SM1). CeO2 (Fig. SM1a) showed aggregates of irregular NPs with size around 20 nm. Both Ce_Fe3 and Ce_Fe6 samples showed, instead, larger particles, forming spongy aggregates with large alveoli (Fig. SM1d), as typical of materials obtained by CS. Indeed, by assuming the value of 7.56 g cm-3 for the density of pure ceria, the geometrical surface area of spherical ceria NPs with 20 nm and 150 nm diameter is 40 m2 g-1 and 5.3 m2 g-1, respectively. To gain more insights on the samples morphology, selected TEM images of the CeO2, Ce_Fe3 and Ce_Fe6 samples are reported in Fig. 1a, 1c and 1e. The CeO2 sample shows squared ceria NPs with size in the 50 - 100 nm range, whereas with Ce_Fe3 sample such NPs occur along with very large and roundish particles (size 250 nm), which in turn are those almost exclusively detected with Ce_Fe6 sample, in agreement with the corresponding decrease of BET SSA at increasing Fe content. The average Fe/Ce atomic ratio was evaluated by performing EDX analysis on different areas of the samples: the obtained values (Table 1) correspond to the nominal Fe/Ce atomic ratio.
12 The actual Fe/Ce ratio was also measured by XRF (Table 1). With both Fe-doped CeO2 samples, a Fe content corresponding to the nominal value was measured also in this case, in agreement with EDX values. On the other hand, the surface chemical composition as determined by XPS analysis (vide infra) showed a much higher surface Fe/Ce atomic ratio (Table 1) with respect to the nominal one, likely indicating the occurrence of a Fe-rich shell.
The adopted techniques provide, indeed, complementary information on samples composition, in that XRF measures the overall chemical composition (both surface and bulk), EDX provides semi-quantitative information on the overall composition (especially as far as sample homogeneity is concerned), and XPS monitors chemical composition of the surface.
By taking into account the different types of compositional data, the presence of core-shell NPs, with a Fe enriched-shell, is inferred. Such a Fe concentration at NPs surface may eventually lead to the formation of other phases (vide infra).
The XRPD pattern of the three samples are reported in Fig. 2: that of pure CeO2 corresponds to the well-known fluorite-type structure with space group Fm-3m. As a whole, no appreciable shift of the peak positions was observed with Fe-doped CeO2 samples, indicating tiny variations of the unit cell among the three samples. On the contrary, a decrease in the peak broadening from CeO2 to Fe-doped CeO2 was clearly recognizable, indicating an increase of grains size, in agreement with morphological analysis (vide supra).
Fe-doped samples maintain the same structure of CeO2, though additional and very low intensity reflections are observed, corresponding to the CeFeO3 crystalline phase (asterisks in Fig. 2). Based on QPA performed by the Rietveld method, the estimated amount of the secondary phase was 1.6 wt. % and 5 wt. % CeFeO3 with Ce_Fe3 and Ce_Fe6, respectively.
13 Such results allow measuring the amount of Fe present in the secondary phase (CeFeO3) and, consequently, the actual amount of Fe hosted by the CeO2 lattice. The Fe/Ce atomic ratio in the CeFeO3 phase, as calculated on the basis of QPA, is 0.011 and 0.036 with Ce_Fe3 and Ce_Fe6, respectively: both values are lower than nominal ones (0.031 in Ce_Fe3 and 0.064 in Ce_Fe6). By difference, it results that only 63 % and 44 % of the added Fe actually enters the CeO2 structure by substituting Ce atoms in Ce_Fe3 and in Ce_Fe6 sample, respectively.
Table 2 reports the results concerning cell parameter refinements: being the samples doped with two different amounts of Fe, a variation of the unit cell parameter (a) proportional to the amount of Fe in the structure was expected. Several studies on Fe-doped CeO2 with a Fe content as high as 10 at.% reported a contraction of the CeO2 network induced by the introduction of (smaller) Fe3+ ions at Ce4+ sites [50,51] following a Vegard law model. On the contrary, Phokha and co-workers [52] observed an increase of the cell parameter of Fe-doped CeO2 with increasing the amount of hosted Fe, which was explained by the presence of Ce3+ ions (larger than Ce4+ ions) in the lattice. The present Fe-doped CeO2 samples experience only tiny variations of unit cell parameter, a 0.002 % decrease being barely observed with Ce_Fe6 sample. Such percentage is very low if compared with the lengthening of the a parameter expected on the basis of the paper by Laguna and coworkers [51] concerning Fe-doped CeO2 of comparable composition, even by considering that only 63 % of nominal Fe-atoms actually entered the CeO2 structure. The occurrence of such a small variation in the unit cell could be attributed to a heterogeneous distribution of Fe within the CeO2 structure, i.e. mostly within the cells in the outer layers of the grains.
Williamson – Hall plots and the derived data are reported in Fig. 3 and Table 2, respectively. As already noticed form the inspection of XRPD patterns in Fig. 2, the grain size increases from pure
14 to Fe-doped CeO2, whereas no differences are observed in the grain size of the two Fe-doped samples. The only observable difference is found in the grains micro-strain, higher with Ce_Fe6 sample, and that could be due to a higher degree of lattice distortion at higher Fe concentration. Indeed, the crystallinity of the CeO2, Ce_Fe3 and Ce_Fe6 samples was confirmed by HR-TEM analysis (Fig. 1b, 1d and 1f), during which crystalline phases were investigated by measuring the distances between the fringes in the corresponding Fourier transformed images of all the HR-TEM micrographs. Interestingly, beside the (expected) fringes due to the CeO2 cubic fluorite-like phase (JCPDS file number 00-034-0394), other defective ceria crystalline phases, such as Ce6O11 (JCPDS file number 00-032-0196) and Ce2O3 (not shown, JCPDS file number 00-049-1458) were observed. The presence of such defective phases, not detected by XRD, is explained by assuming that they actually correspond to a very low percentage of the overall crystalline domains. It can be inferred, however, that the occurrence of such defective ceria phases was likely induced by the preparation procedure, showing that MACS allows obtaining highly defective NPs, where defects are possibly located at the surface of large CeO2 agglomerates.
In agreement with XRDP measurement, after Fe doping, the fringes related to the CeFeO3 phase (JCPDS file number 00-022-0166) are also observed with both Ce_Fe3 and Ce_Fe6 samples. Moreover, due to the much smaller ionic size of Fe3+ as compared to Ce4+, it can be inferred that Fe3+ can occupy either network Ce4+ sites or interstitial sites in the fluorite lattice, giving rise to tiny changes in the lattice parameter, as observed by XRDP cell parameter refinement (Table 2). Therefore, the amount of Fe added by synthesis can rule the formation of different amounts of sub-stoichiometric phases in Ce_Fe3, whereas in Ce_Fe6 sample a higher Fe content likely promotes the formation of the CeFeO3 phase and possibly inhibits formation of the Ce6O11 defective phase. This result is in agreement with the assumption that with Ce_Fe6 sample a lower amount of Fe3+
15 is actually included in the fluorite with respect to Ce_Fe3 sample. Therefore, the addition of Fe affects the formation of defective ceria phases, as observed by the analysis of HRTEM fringes, and the larger amount of interstitial Fe3+ found for Ce_Fe3 could induce an increase in the structural defectiveness of ceria.
The presence of a Fe-rich shell can be assessed by means of XPS, a technique that allows studying the chemical composition of the surface. The most relevant results obtained by the curve-fit of XP-spectra in the O 1s, Ce 3d and Fe 2p BE ranges are reported in Table 3. The position of the Fe2p 3/2 and Fe 2p1/2 lines agrees with the presence of Fe3+ species, the corresponding XP spectra being reported in the Supplementary Material (Fig. SM2).
Concerning O 1s lines (Fig. 4), a satisfactory curve-fit is obtained by using two components, related to the presence of surface and sub-surface oxygen species, referred to as O (BE ca. 531 eV) and O (BE ca. 529 eV), respectively. The former are labile and more reactive species with respect to sub-surface O species, and play an important role in metal oxides-catalyzed processes [34,53]. With Fe-doped samples, the position of the O 1s lines does not change significantly, but the atomic percentage of O species varies, as shown by the corresponding values in Table 3. The O/O ratio was 0.34, 0.73 and 0.72 with bare CeO2, Ce_Fe3 and Ce_Fe6 samples, respectively. The increase in the amount of O species s more conspicuous with Ce_Fe3 sample, in agreement with the higher amount of defective ceria revealed by HR-TEM analysis. A higher Fe content does not lead to a further increase in the relative amount of O species indicating that, at higher loading, Fe starts to enter the NPs bulk, finally escaping detection by XPS, a technique with a penetration depth < 10 nm.
16 The Ce 3d range (Fig. SM3) shows several components due to the presence of both Ce4+ and Ce3+ surface species. As reported by the literature [54-57], the ground state of Ce2O3 is purely 4f1, whereas that of CeO2 is a mixture of multi-electron configurations 4f0 and 4f1 L, where L denotes a hole in the O 2p orbitals. The Ce 3d photoemission gives rise to a rearrangement of valence electrons. The XPS Ce 3d5/2 and 3d3/2 doublets are commonly denoted u and v, respectively, and extend in the 880-920 eV BE range. For CeO2, the final states due to the photoemission of the Ce 3d give rise to six peaks ascribed to the three pairs of the spin-orbit doublets. The six peaks are due to the different occupancies of the Ce 4f final state strongly hybridized with the O 2p orbital, as thoroughly discussed in the literature [54].
The position of Ce peaks is reported in Table 3, along with surface chemical composition. The total amount of surface Ce3+ species, as calculated according to eq. (2):
𝐶𝑒3+(%) = 𝑆𝑣′+ 𝑆𝑢′
∑(𝑆𝑣+ 𝑆𝑢)100 (2)
is 22.5, 26.5 and 23.4 % for CeO2, Ce_Fe3 and Ce_Fe6 samples, respectively, showing that a certain amount of reduced Ce3+ species is already present in CeO2 sample, in agreement with previous characterization, and that the effect of Fe-doping on the surface is more relevant with Ce_Fe3 sample. As mentioned previously, the Fe/Ce atomic ratio measured by XPS is much higher than the nominal value with both Ce_Fe3 and Ce_Fe6 samples, but still below that of CeFeO3. Such result likely means that Fe species mainly occur at the surface of the NPs, either within the CeFeO3 phase or by substituting near-surface Ce species.
17 XPS results along with XRPD (showing the occurrence of CeFeO3 spinel phase and a limited variation of cell parameter) confirm the idea of a Fe-richer shell, where Fe-doping mainly concerns the ceria cells at the outer layers of the grains. This is also in agreement with the HR-TEM observations that pointed out the presence of defective crystalline surfaces, possibly induced by Fe insertion.
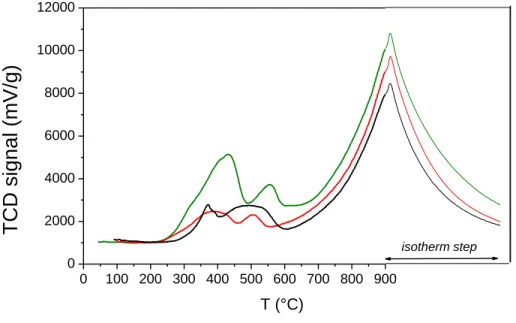
The different surface composition is expected to affect several physico-chemical parameters, including reducibility of the samples, the corresponding H2-TPR profiles being reported in Fig. 5: CeO2 sample shows two main H2 consumption peaks, assigned in the literature to the reduction of surface Ce4+ species (low T) and bulk ceria (high T) [57]. The presence of Fe brings about a change in curves shape at low T, whereas the peak due to bulk reduction at high T is almost unaltered, in agreement with the preferential occurrence of Fe at the outer shell of NPs. All this notwithstanding, with both Ce_Fe3 and Ce_Fe6 samples, a shift of H2 consumption onset to lower T is observed, in that reduction of CeO2 sample starts at ca. 300 °C, whereas reduction of both Fe-doped samples starts at 200 °C. Such behavior implies a higher reducibility of NPs outer shell due to the presence of Fe; the corresponding amounts of consumed H2, reported in Table 1 as normalized to sample unit mass, agree with such hypothesis, in that the total amount of consumed H2 increases with the Fe content.
3.2 Characterization of surface species by means of IR spectroscopy and CO adsorption at nominal -196 °C
The nature of surface species can be studied through adsorption of probe molecules as followed by IR spectroscopy, which is a fundamental technique for the study of surface species [58-60], like
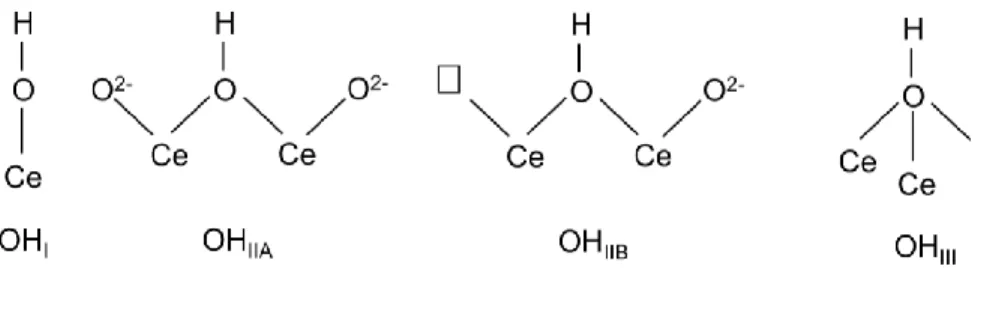
18 the different types of OH groups [16,61,62] usually found at the surface of ceria and depicted in Scheme 1.
Figure 6 reports the IR spectra of the CeO2 sample pretreated as follows: outgassed at 250 °C (curve a), oxidized at 400 °C (curve b) and then reduced in H2 at 200 °C (curve c). The curves in Fig. 6 are characterized by the typical scattering profile of ceria above 600 cm-1 [61]. No remarkable signals ascribable to electronic effects were observed upon reduction (curve (c) in Fig. 6), at variance with literature reports on ceriareduced at higher temperatures [62]. This is likely due to the low reduction temperature adopted in this work.
The IR spectrum of CeO2 sample outgassed at 250 °C shows a band centered at 3630 cm-1 in the OH stretching region (3800-3500 cm-1, inset to Fig. 6). The 3630 cm-1 band position is consistent with the presence of OHIIB sites (Scheme 1), i.e. bridged OH groups close to surface anionic vacancies that can form, for instance, by elimination of isolated OHI species at temperatures as low as 200 °C [61,62]. Although micro-Raman spectroscopy (Fig. SM4) evidenced an extremely low concentration of oxygen vacancies in the three fresh samples (i.e. not outgassed powders), this does not rule out the likely formation of oxygen vacancies when powders are outgassed at a high temperature. On the one side, HR-TEM observation pointed out the formation of defective ceria phases in the CeO2 sample; on the other side, the fact that the amount of oxygen vacancies did not increase after Fe doping is in agreement with previous characterization, showing that most of surface Fe species were involved in the formation of the CeFeO3 phase.
OHIIB sites usually give rise to an OH stretching band found at slightly different wavenumbers depending, inter alia, on the oxidation state of cerium: Badri et al. assigned bands at 3635 cm-1 and 3647 cm-1 to OHIIB species where cerium occurred as Ce4+ and Ce3+ species, respectively [61]. This assignment is further confirmed by the presence of a weak band at about 2130 cm-1 related to
19 the forbidden 2F
5/22F7/2 electronic transition of Ce3+[62] and indicating that outgassing at 250°C has a reducing effect on the surface. Several bands in the 3000 – 2800 cm-1 and 1700 – 1250 cm-1 range of curve a are assigned to IR modes of glycine [63], indicating that residual molecules of the fuel are likely adsorbed at the surface of CeO2 sample. Such hypothesis is confirmed by TG – Mass analysis (reported in Fig. SM5): the TG curve shows a limited mass loss (ca. 2.5 wt. %) in the temperature range between 100 and 300 °C, accompanied by a corresponding peak with mass = 30 u in the mass spectrum, ascribable to NH2CH2+species, i.e. the main fragment of glycine [64]. The amount of residual glycine was however very low, as confirmed by the limited mass loss occurring at low temperature (Fig. SM5), and therefore its influence on the catalytic activity of the samples is reasonably negligible.
Figure 7a reports the IR spectra taken after dosing CO at nominal -196 °C on CeO2 sample outgassed at 250 °C: difference spectra are reported, as obtained after subtraction of the spectrum of the bare sample in Fig. 6, and therefore positive and negative bands correspond to species forming and disappearing after CO adsorption, respectively.
CO dosage on CeO2 sample outgassed at 250 °C (Fig. 7a) leads to the appearance of a band at 2152 cm-1 and of a broad and less intense band at 2127 cm-1 in the CO stretch range (2250-2050 cm-1). On the ground of previous literature reports, the 2127 cm-1 band is assigned to Ce3+---CO complexes formed by adsorption of CO molecules on coordinatively unsaturated surface (c.u.s.) Ce3+ species [62,65,66]. The 2152 cm-1 band is due to CO molecules H-bonded to OH groups originally absorbing at 3630 cm-1, as confirmed by the negative band observed in the OH stretch region (3750-3000 cm-1, inset to Fig. 7a). According to the literature, CO molecules adsorbed on Ce4+ sites give rise to IR bands in the 2187 – 2165 cm-1 range [65], not observed in the present case: Ce4+ sites, which are strong Lewis acids, are likely occupied by adsorbed glycine molecules.
20 Nonetheless, the under vacuum treatment at 250 °C has a partially reducing effect on ceria surface [61,62], favoring the formation of surface Ce3+ species, which were also present on the as-synthesized sample, in agreement with XPS analysis.
In order to remove the organic residues, the CeO2 sample was oxidized at 400 C°, the corresponding IR spectrum being reported as curve b in Fig. 6: as expected, IR bands of glycine disappear after oxidation, minor bands in the 3000 – 2800 cm-1 range being instead due to surface contamination by vacuum grease always present during the experiments. Peaks in the 1700-1250 cm-1 range are assigned to carbonate-like surface species [62,66,67], usually observed at ceria surface, the assignment of which is not straightforward [62]. All this notwithstanding, the relatively high thermal stability of such carbonate-like species allows inferring that mainly polydentate species are present [62], since lower coordination carbonates are removed above 300 °C. More interestingly, in the OH stretch region (inset to Fig. 6) several new bands are observed upon oxidation at 400 °C: the 3715 cm-1 band is assigned to mono-coordinated OHI species (Scheme 1), whereas signals at 3687, 3650 and 3630 cm-1 to bridged OHIIA and OHIIB species [61,62]. In this case, the band at about 2130 cm-1 is not observed, confirming the effectiveness of the oxidation treatment.
Fig. 7b reports difference IR spectra obtained after adsorption of CO at nominal -196 °C on oxidized CeO2 sample. As a first comment, the intensity of the bands due to adsorbed CO species is one order of magnitude higher than in IR spectra reported in Fig. 7a. Such a remarkable increase in intensity is related to the decomposition of carbonate species upon oxidation at 400 °C, resulting in a (clean) surface exposing oxidized Ce4+ sites that are prone to adsorb CO molecules. Indeed, the most intense band at about 2150 cm-1, which promptly disappears by decreasing CO pressure, is assigned to CO molecules interacting with surface OH groups. Conversely, the residual sharp
21 peak at 2157 cm-1 (that gradually decreases with pressure without changing its position) is due to CO molecules adsorbed on isolated c.u.s. Ce4+ sites. Moreover, a third band (shifting with coverage from 2169 to 2177 cm-1) is assigned to CO molecules interacting with another kind of c.u.s. Ce4+ sites. The blue shift observed by decreasing the coverage is an indication that the latter c.u.s. Ce4 sites are interacting each other, i.e. they are likely located on extended surfaces. Finally, a (ca. 100 times) less intense band in the 2115-2095 cm-1 range is assigned to 13CO molecules interacting with surface sites, in agreement with both the relative abundance of 13C/12C isotopes and the 1.026 reduced mass ratio.
CO was dosed at -196 °C also on CeO2 sample reduced in H2 at 200 °C, the corresponding IR spectra being reported in Fig. 7c. In comparison with Fig. 7b concerning same CO equilibrium pressures on the sample oxidized at 400 °C, the bands due to CO interacting with OH groups and that related to c.u.s. Ce4+ sites decrease in intensity, confirming the reduction of some surface sites. Correspondingly, a band at 2127 cm-1 (arrow) is seen, due to CO molecules adsorbed on reduced Ce3+ sites. The poor intensity of the band corresponding to CO interacting with Ce3+ sites is not surprising, since in the present case reduction was carried out in quite mild conditions, as confirmed by the lack of the band at about 2130 cm-1 in curve c of Fig. 6.
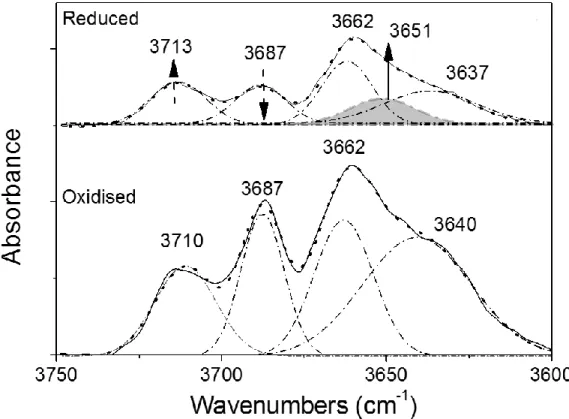
In order to understand the effect of oxidation and/or reduction on the hydroxyls population, a curve-fitting procedure was carried on the hydroxyls IR spectra of the CeO2 sample after oxidation at 400 °C and reduction at 200 °C. Fig. 8 reports corresponding IR spectra along with the curve-fitting results. With the oxidized sample, a satisfactory curve-fit was obtained by assuming the presence of four peaks with maxima at 3710 cm-1 (OHI species), 3687 cm-1 (Ce3+-related OHIIA species), 3662 cm-1 (Ce4+-related OH
IIA species) and 3640 cm-1 (Ce4+-related OHIIB species). With the reduced sample, instead, the best curve-fit was obtained in the presence of five peaks, i.e. by
22 adding a peak with maximum at 3651 cm-1, assigned to the formation of Ce3+-related OHIIB species. The relative area of the peaks was also considered, leading to the conclusion that Ce4+ -related OHIIA species (3687 cm-1) reacted with H2, likely forming OHI species and Ce3+-related OHIIB species (Scheme 2), in agreement with previous literature reports [61].
The effect of Fe-doping on the surface properties of the material was noticeable, since an overall loss of transparency was observed in the IR range, related to the decreased surface area of the doped samples. Both Ce_Fe3 and Ce_Fe6 samples showed a less abundant OH population, likely due to the presence of surface Fe3+ species in the CeFeO3 phase both after outgassing at 200 °C (spectra not reported) and after oxidation at 400 °C (performed to get rid of adsorbed glycine molecules, as with CeO2 sample).
In Fig. 9a, the IR spectra of CeO2 (black curve), Ce_Fe3 (red curve) and Ce_Fe6 (green curve) samples are compared in the OH stretching region: the Fe-doped samples show a weak signal at 3648 cm-1, indicating the sole presence of OHIIB species. With Ce-Fe3 sample (red curve), a broad absorption centered at 3400 cm-1 is related to H-bonded OH groups.
In Fig. 9b, the IR spectra of the three samples are compared in the whole IR spectral range: at variance with pure CeO2, no bands ascribable to carbonate-like species are observed with Fe-doped samples, whereas a steep increase of absorbance is seen in the 2000-1000 cm-1 range, corresponding to 0.25-0.12 eV energy. The addition of Fe induced a modification in the IR spectra, in that an electronic absorption band (observed below 1500 cm-1 in the CeO2 spectrum, black curve) results eroded in Fe-doped samples (red and green curves), the entity of such modification being more evident on increasing the Fe loading. The aforementioned electronic absorption is related to free electrons in the conduction band of ceria: such electrons are trapped by the presence of new energy levels induced by Fe-doping, causing the erosion of the above-described absorption,
23 as clearly shown by difference spectra reported in Fig. 9c (dashed red and dashed green curves), where a monotone negative absorption is observed. This phenomenon is more pronounced for Ce_Fe3 (dashed red curve) than for Ce_Fe6 (dashed green curve).
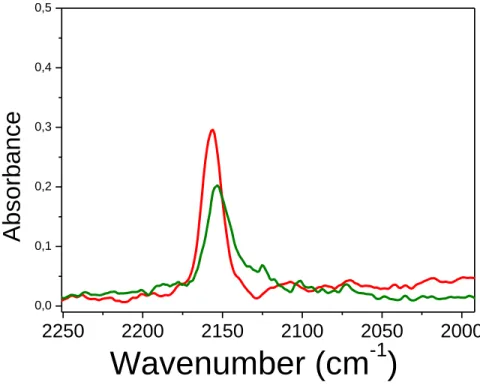
Figure 10 reports IR spectra recorded after dosing CO at nominal -196°C on Ce_Fe3 (red curve) and Ce_Fe6 (green curve) samples oxidized at 400 °C: a band is seen at ca. 2156 cm-1, due to CO molecules interacting with OH groups. Concerning the latter band, a contribution of CO molecules adsorbed on isolated c.u.s. Ce4+ sites cannot be excluded, in agreement with the presence of OH
IIB species. No signals ascribable to surface Fe3+ species were instead detected, since Fe3+ usually does not form carbonyl species [65], indicating that most of surface Ce4+ ions were likely replaced by Fe3+ species.
3.3. UV-Vis spectroscopy
The DR UV-Vis spectra of the three as-synthesized samples under vacuum at room temperature are shown in Figure 11: the UV-Vis spectrum of CeO2 (black curve) shows three absorption bands at 243, 270 and 330 nm. The first two bands are assigned to ligand to metal charge transfer transitions from O2- to Ce3+ (243 nm) and Ce4+ (270 nm) species, and the 330 nm band is due to the inter-band transition of CeO2, usually observed in the 320-340 nm range [68]. With Fe-doped samples (red and green curves), new bands are observed above 400 nm, assigned to d-d transitions of Fe3+ species [69]. Some changes are detected also in the spectral region below 400 nm: the relative intensity of O2- Ce3+ and O2- Ce4+ bands changes, as shown by the upward and downward arrows reported in the Figure, indicating that, as a consequence of Fe-doping, the relative amount of Ce3+ species increases with respect to Ce4+ species, in agreement with previous characterization. Nonetheless, a bathochromic shift of the 320 nm band is observed with increasing
24 the amount of Fe, in that the band due to inter-band transition is observed at 345 and 355 nm with Ce_Fe3 and Ce_Fe6 samples, respectively. This effect has been already observed with variously doped CeO2, and corresponds to a decrease of the oxide band-gap as consequence of Fe3+ doping, though restricted to near subsurface layers [70]. In the present case, the band-gap changes from 3.4 eV with pure CeO2 to 3.2 eV and 3.1 eV for Ce_Fe3 and Ce_Fe6 samples, respectively, in agreement with the 0.25-0.12 eV value found in the IR spectra reported in Fig. 9. Such feature may represent a possibility for Fe-doped CeO2 obtained by MACS to have some photocatalytic applications, although not explored in this paper.
3.4 Catalytic tests concerning activity of the samples towards CO oxidation
Figure 12 shows CO conversion to CO2 in the 150 – 500 °C range for both the catalized and uncatalized reaction (dotted curve): as a whole, with Fe-doped samples a remarkable improvement of CO oxidation was observed with respect to CeO2 sample.
In particular, the Ce_Fe3 sample exhibited the best perfomance in terms of both T10%-50%-90% values (277, 298, 327°C, respectively) and specific CO oxidation rate (= 59.13 mmol m-2 h-1 at 285°C) (Table 4, section A). With the Ce_Fe6 sample, the oxidation activity decreases (CO oxidation rate = 40.85 mmol m-2 h-1 at 285°C), in agreement with HR-TEM characterization showing that a higher Fe content seems to inhinibt the formation of the Ce6O11 defective phase, with consequent formation of a higher amount of both CeO2 and CeFeO3 phases. The latter phase appears less effective towards CO oxidation with respect to highly dispersed Fe-species within the ceria lattice. Finally, the CeO2 sample resulted the least performing CO oxidation catalyst, in terms of both T10%-50%-90% values and specific oxidation rate, despite its higher BET surface area, likely due to
25 the lack of the positive Ce-Fe synergy that, according to the literature, is achieved by combining the redox behavior of cerium (Ce4+/Ce3+) and iron (Fe3+/Fe2+) species [50]. Interestingly, a fair correlation is observed between CO oxidation activity of the samples and the corresponding amount of surface Oα species (Table 3), as measured XPS (vide supra). The latter finding confirms that Oα species can be directly involved in the catalytic oxidation of CO, at variance with other ceria-based nanostructures (namely, Ce-Zr-O and Ce-Pr-O systems) [36,71,72]. According to previous work [73], this suggest the occurrence of either a Langmuir-Hinshelwood or Eley-Rideal type mechanism, in which the determining steps occur in the gas phase: however, further considerations about reaction mechanisms are out of the scopes of this paper and will be the matter of future work.
3.5 Catalytic tests concerning activity of the samples towards soot combustion
Figure 13 shows the soot conversion to COx (%) in the 150 – 650 °C range during both the catalysed reaction (in “tight contact” conditions) and the non-catalysed reaction (soot only). At variance with CO oxidation, the CeO2 sample performed better than both Fe-doped CeO2 (T 10%-50%-90% = 364, 413, 456 °C; Tpeak CO2 = 424 °C).
The contact points between soot and catalyst particles play a key role in such solid-solid reaction mediated by gas-phase oxygen (O2(g)) and therefore the smaller size of CeO2 NPs improves the contact interactions with soot aggregates, finally leading to a higher activity. If, however, we consider that in “tight contact” conditions the soot is completely surrounded and in contact with the catalyst (being the latter in large excess, as tests were performed with a catalyst/soot mass ratio equal to 9, vide supra), one can assume that soot reactivity directly depends on the specific surface
26 (which is not the case in “loose” contact) [41,42,45]. In other words, soot is in direct contact with the same mass of catalyst in all experiments, and the mechanical force exerted in “tight contact” conditions makes fully accessible the catalyst surface, provided that no inner porosities inaccessible to soot (i.e. well below soot particle sizes) are present. This, in fact, occurs for the investigated samples, for which microporous intra-particle volume is nearly absent and the inter-particle volume is mesoporous, according to N2 sorption isotherms at -196 °C (vide supra). The fact that doping with Fe may lead to a decreased activity towards soot combustion can be, at first sight, a disappointing result. However, if specific soot oxidation rates are normalized to samples BET SSA, an interesting result emerges: the Fe-doped samples showed a higher catalytic activity, increasing with the Fe content, as the normalized soot oxidation rates per unit m2, calculated at 400 °C by considering unitary that of CeO2, result 3.7 and 4.9 for Ce_Fe3 and Ce_Fe6, respectively, due to the positive effect of Fe doping on the catalytic properties of these samples.
Further insight into soot oxidation can be derived by the soot-TPR curves reported in the Supporting Material (Fig. SM6), showing that the CeO2 sample provides the largest amount of CO2: also in the absence of O2(g), CeO2 NPs confirm their higher activity, ascribable to a higher tendency of surface oxygen species to react with soot particles. Above 450 °C, the CO2 emissions of the three catalysts are very similar: since surface oxygen species have been consumed at low T, reaction occurs with oxygen species coming form the bulk. The latter phenomenon requires higher T, at which the three catalysts perfom similarly, being Fe-doping mostly related to the surface. Concerning soot combustion, a second set of experiments was carried out with the fresh powders, to test both the repeatibility of the catalytic measurements and the quality (and the overall homogeneity) of samples obtainable by MACS.
27 Figure 14 reports the two catalytic cycles obtained with fresh powders: the first cycles nearly cohincide to previous ones, as comparable results are obtained with respect to Fig. 13, given the very limited differences between the values of T50% in Fig. 13 and Fig. 14 (i.e. 413 °C vs 414 °C for CeO2, 453 °C vs 461 °C for Ce_Fe3, 487 °C vs 479 °C for Ce_Fe6, respectively): indeed the maximum deviation observed between the two tests was 8 °C (Ce_Fe6). This result showed that homogeneous powders are obtained by MACS, as the catalytic activity was comparable to the previous powders.
Moreover, the tests in Fig. 14 showed a positive effect of Fe doping towards selectivity to CO2: Fe-doped samples showed indeed a superior CO oxidation activity, as almost no CO emissions were detected (the selectivity to CO2 at TpeakCO2 was 97% and 99% for Ce_Fe3 and Ce_Fe6 respectively), at variance with CeO2, for which the selectivity to CO2 at Tpeak CO2was 97% and 86%.
The catalysts were then recovered, and the soot-catalyst bed was re-prepared by adding soot and repeating the measurement: the obtained soot conversion curves (hollow symbols in Fig. 14) show that the catalyst degradation was limited, though selectivity to CO2 decreased, especially with CeO2 sample (from 86% to 60% during the second cycle). This effect was also evident with the Fe-doped samples, where CO oxidation activity decreased shifting towards higher T. Future work will concern the improvement of catalysts stability, with the aim of obtaining catalysts able to withstand (technologically relevant) phenomena of ageing.
Conclusions
Microwave Assisted Combustion Synthesis (MACS) allowed the preparation of both pure and Fe-doped CeO2 nanoparticles with interesting catalytic performance in two reactions of environmental
28 interest, namely CO oxidation and soot combustion. The catalytic performance of the prepared materials was deeply affected by their physico-chemical properties, and in particular i) the extent of Fe doping within the ceria lattice, with respect to the formation of a secondary CeFeO3 phase, ii) the presence of defective ceria phases at the surface of larger agglomerates and iii) the nanoparticles size. The first property influences the presence of surface oxygen species (O) that are responsible of the catalytic performance of the samples as catalysts for CO oxidation, whereas the other two parameters are crucial in the soot combustion. In the latter reaction, implying an intimate contact between the solid reagent (soot) and the catalyst, a positive effect of Fe doping was indeed observed (as intrinsic soot oxidation activity per unit of catalyst surface), which however is not able to counterbalance the low SSA that characterizes the Fe-containing samples. This made the CeO2 sample finally prevail over the Fe-doped ones, in a comparison based on overall soot conversion.
Such findings were obtained on the ground of a multi-techniques characterization, which allowed figuring out other interesting physico-chemical parameters of the materials obtained by MACS, as well. For instance, IR spectroscopy allowed the detection of several hydroxyls species at the surface of materials obtained by MACS, rarely observed with CeO2-materials obtained by means of other syntheses, indicating the occurrence of a very defective surface, which could be exploited also for other catalytic reactions implying the presence of acid/base functionalities. Accordingly, the CeO2 sample produced by MACS showed the prevailing occurrence of very defective Ce6O11 and Ce2O3 surfaces, as observed by HRTEM
On the other hand, doping with Fe, although limited due to the formation of the CeFeO3 secondary phase, led to a decrease in the band-gap of the material, an interesting result that could be exploited for photocatalytic applications, although not explored in the present paper.
29
Acknowledgments
The authors thank Dr Paola Rivolo, for performing the micro-Raman spectroscopy measurements, and Melodj Dosa, for performing the soot-TPR measurements (Department of Applied Science and Technology, Politecnico di Torino).
References
[1] A. Trovarelli, Catalytic Properties of Ceria and CeO2-Containing Materials, Catal. Rev. Sci. Eng. 38 (1996) 439-520.
[2] P. Fornasiero, E. Fonda, R. Di Monte, G. Vlaic, J. Kašpar, M. Graziani, Relationships between Structural/Textural Properties and Redox Behavior in Ce0.6Zr0.4O2 Mixed Oxides, J. Catal. 187 (1999) 177-185.
[3] G. Vlaic, R. Di Monte, P. Fornasiero, E. Fonda, J. Kašpar, M. Graziani, Redox Property–Local Structure Relationships in the Rh-Loaded CeO2–ZrO2 Mixed Oxides, J. Catal. 182 (1999) 378-389.
[4] S. Park, J. M. Vohs, R. J. Gorte, Direct oxidation of hydrocarbons in a solid-oxide fuel cell, Nature 404 (2000) 265-267.
[5] Z.L. Zhan, S.A. Barnett, An octane-fueled solid oxide fuel cell, Science, 308 (2005) 844–847. [6] M. Zinkevich, D. Djurovic, F. Aldinger, Thermodynamic modelling of the cerium–oxygen system, Solid State Ionic 177 (2006) 989-1001.
[7] K. Schwarz, Materials design of solid electrolytes, Proc. Natl. Acad. Sci. U.S.A. 103(10) (2006) 3497.
30 [8] L. Malavasi, C.A.J. Fisher, M.S. Islam, Oxide-ion and proton conducting electrolyte materials for clean energy applications: structural and mechanistic features, Chem. Soc. Rev. 39 (2010) 4370-4387.
[9] M. Moprgensenet, N.M. Sammes, G.A. Tompsett, Physical, chemical and electrochemical properties of pure and doped ceria, Solid State Ionics 129 (2000) 63-94.
[10] H. Song, U.S. Ozkan, Ethanol steam reforming over Co-based catalysts: Role of oxygen mobility, J. Catal. 261 (2009) 66-74.
[11] F. Esch, S. Fabris, L. Zhou, T. Montini, C. Africh, P. Fornasiero, G. Comelli, R. Rosei, Electron localization determines defect formation on ceria substrates, Science 309 (2005) 752-755. [12] C. T. Campbell, C.H.F. Peden, Oxygen vacancies and catalysis on ceria surfaces, Sceince 309 (2005) 713-714.
[13] S Tsunekawa, R Sahara, Y Kawazoe, K Ishikawa, Lattice relaxation of monosize CeO2−x nanocrystalline particles, Appl. Surf. Sci. 152 (1999) 53-56.
[14] X.D. Zhou, W. Huebner, Size-induced lattice relaxation in CeO2 nanoparticles, Appl. Phys. Lett. 79 (2001) 3512-3514.
[15] C. Sun, H. Li, L. Chen, Nanostructured ceria-based materials: synthesis, properties, and applications, Energy Environ. Sci. 5 (2012) 8475-8505.
[16] S. Agarwal, X. Zhu, E.J.M. Hensen, B.L. Moject, L. Lefferts, Surface-dependence of defect chemistry of nanostructured Ceria, J. Phys. Chem. C 119 (2015) 12423-12433.
[17] S:T. Aruna, A.S. Mukasyan, Combustion synthesis and nanomaterials, Curr. Opin. Sol. St. M, 12 (2008) 44–50.
31 [18] I. Ganesh, R. Johnson, G.V.N. Rao, Y.R. Mahajan, S.S. Madavendra, B.M. Reddy, Microwave-assisted combustion synthesis of nanocrystalline MgAl2O4 spinel powder, Ceram. Int. 31 (2005) 67–74.
[19] A. Kudo, Y. Miseki, Heterogeneous photocatalyst materials for water splitting, Chem. Soc. Rev. 38 (2009) 253-278.
[20] W. C. Chueh, C. Falter, M. Abbott, D. Scipio, P. Furler, S. M. Haile, A. Steinfeld, High-Flux Solar-Driven Thermochemical Dissociation of CO2 and H2O Using Nonstoichiometric Ceria, Science 330 (2010) 1797-1801.
[21] C. Sun, J. Sun, G. Xiao, H. Zhang, X. Qiu, H. Li, L. Chen, Mesoscale Organization of Nearly Monodisperse Flowerlike Ceria Microspheres, J. Phys. Chem. B 110 (2006) 13445-13452. [22] Q. Fu, A. Weber, M. Flytzani-Stephanopoulos, Nanostructured Au–CeO2 Catalysts for Low-Temperature Water–Gas Shift, Catal. Lett. 77 (2001) 87-95.
[23] S. Carrettin, P. Concepción, A. Corma, J. M. López Nieto, V.F. Puntes, Nanocrystalline CeO2 Increases the Activity of Au for CO Oxidation by Two Orders of Magnitude, Angew. Chem. Int. Ed. 43 (2004) 2538-2540.
[24] Q. Fu, H. Saltsburg, M. Flytzani-Stephanopoulos, Active Nonmetallic Au and Pt Species on Ceria-Based Water-Gas Shift Catalysts, Science 301 (2003) 935-938.
[25] J.A. Rodriguez, X. Wang, P. Liu, W. Wen, J. C. Hanson, J. Hrbek, M. Pérez, J. Evans, Gold nanoparticles on ceria: importance of O vacancies in the activation of gold, Top. Catal. 44 (2007) 73-81.
[26] S. Kandoi, A.A. Gokhale, L.C. Grabow, J.A. Dumesic, and M. Mavrikakis, Why Au and Cu Are More Selective Than Pt for Preferential Oxidation of CO at Low Temperature, Catal. Lett. 93 (2004) 93-100.
32 [27] G. Avgouropoulos, J. Papavasiliou, T. Tabakova, V. Idakiev, T. Ioannides, A comparative study of ceria-supported gold and copper oxide catalysts for preferential CO oxidation reaction, Chem. Eng. J. 124 (2006) 41-45.
[28] M. Manzoli, G. Avgouropoulos, T. Tabakova, J. Papavasiliou, T. Ioannides, F. Boccuzzi, Preferential CO oxidation in H2-rich gas mixtures over Au/doped ceria catalysts Catal. Today 138 (2008) 239-243.
[29] G. Avgouropoulos, M. Manzoli, F. Boccuzzi, T. Tabakova, J. Papavasiliou, T. Ioannides, V. Idakiev, Catalytic performance and characterization of Au/doped-ceria catalysts for the preferential CO oxidation reaction, J. Catal. 256 (2008) 237-247.
[30] T. Tabakova, F. Boccuzzi, M. Manzoli, D. Andreeva, FTIR study of low-temperature water-gas shift reaction on gold/ceria catalyst, Appl. Catal. A: Gen. 252 (2003) 385-397.
[31] T. Tabakova, F. Boccuzzi, M. Manzoli, J.V. Sobczak, V. Idakiev, D. Andreeva, Effect of synthesis procedure on the low-temperature WGS activity of Au/ceria catalysts, Appl. Catal. B: Environ. 49 (2003) 73-81.
[32] F. Vindigni, M. Manzoli, T. Tabakova, V. Idakiev, F. Boccuzzi, A. Chiorino, Effect of ceria structural properties on the catalytic activity of Au-CeO2 catalysts for WGS reaction, Phys. Chem. Chem. Phys. 15 (2013) 13400-13408.
[33] M. Cargnello, C. Gentilini, T. Montini, E. Fonda, S. Mehraeen, M. Chi, M. Herrera-Collado, N.D. Browning, S. Polizzi, L. Pasquato, P.Fornasiero, Active and Stable Embedded Au@CeO2 Catalysts for Preferential Oxidation of CO, Chem. Mater. 22 (2010) 4335-4345.
[34] A. Tahrizi, M. Piumetti, S. Bensaid, N. Russo, D. Fino, R. Pirone, CO and Soot Oxidation over Ce-Zr-Pr Oxide Catalysts, Nanoscale Res. Lett. 11 (2016) 278.
33 [35] M. Piumetti, A. Tahrizi, S. Bensaid, N. Russo, D. Fino, R. Pirone, Study on the CO Oxidation over Ceria-Based Nanocatalysts, Nanoscale Res. Lett. 11 (2016) 165.
[36] M. Piumetti, A. Tahrizi, S. Bensaid, N. Russo, D. Fino, Investigations into nanostructured ceria-zirconia catalysts for soot combustion, Appl. Catal. B: Environ. 180 (2016) 271-282. [37] M. Piumetti, A. Tahrizi, S. Bensaid, N. Russo, D. Fino, Nanostructured ceria-based catalysts for soot combustion: Investigations on the surface sensitivity, Appl. Catal. B: Environ. 165 (2015) 742-751.
[38] D. Fino, S. Bensaid, M. Piumetti, N. Russo, A review on the catalytic combustion of soot in Diesel particulate filters for automotive applications: From powder catalysts to structured reactors, Appl. Catal. A: Gen. 509 (2016) 75-96.
[39] T. Montini, M. Melchionna, M. Monai, P. Fornasiero, Fundamentals and Catalytic Applications of CeO2-Based Materials, Chem. Rev. 116 (2016) 5987-6041.
[40] Z.-A. Quia, Z. Wu, S. Dai, Shape-Controlled Ceria-based Nanostructures for Catalysis Applications, ChemSusChem. 6 (2013) 1821-1833.
[41] V. Rico-Pérez, E. Aneggi, A. Bueno-López, A. Trovarelli, Synergic effect of Cu/Ce0.5Pr0.5O2- in soot combustion, Appl. Catal. B: Environ. 197 (2016) 95-104.
[42] L. Soler, A. Casanova, C. Escudero, V. Pérez-Dieste, E. Aneggi, A. Trovarelli, J. Llorca, Ambient pressure photoemission spectroscopy reveals the mechanism of carbon soot oxidation in ceria-based catalysts, ChemCatChem 8 (2016) 2748-2751.
[43] P.S. Barbato, S. Colussi, A. Di Benedetto, G. Landi, L. Lisi, J. Llorca, A. Trovarelli, Origin of high activity and selectivity of CuO/CeO2 catalysts prepared by solution combustion synthesis in CO-PROX reaction, J. Phys. Chem. C, 120 (2016) 13039-13048.
34 [44] P.S. Barbato, S. Colussi, A. Di Benedetto, G. Landi, L. Lisi, J. Llorca, A. Trovarelli, CO preferential oxidation under H2-rich streams on copper oxide supported on Fe promoted CeO2, Appl. Catal. A: General 506 (2015) 268-277.
[45] E. Aneggi, N.J. Divins, C. de Leitenburg, J. Llorca, A. Trovarelli, The formation of nanodomains of Ce6O11 in ceria catalysed soot combustion, J. Catal., 312 (2014) 191-194.
[46] S. Sundar Manoharan, K.C. Patil, Combustion Synthesis of Metal Chromite Powders, J. Am. Ceram. Soc. 75 (1992) 1012-1015.
[47] A.C. Larson, R.B. Von Dreele, GSAS-General Structure Analysis System, Report LAUR 86-748, Los Alamos National Laboratory, Los Alamos, New Mexico, 1996.
[48] B.H. Toby, EXPGUI, a graphical user interface for GSAS, J. Appl. Crystallogr. 34 (2001) 210–213.
[49] P. Thomson, D.E. Cox, J.B. Hastings, Rietveld refinement of Debye–Scherrer synchrotron X-ray data from Al2O3, J. Appl. Crystallogr. 20 (1987) 79–83.
[50] O.H. Laguna, F. Romero Sarria, M.A. Centeno, J.A. Odriozola, Gold supported on metal-doped ceria catalysts (M = Zr, Zn and Fe) for the preferential oxidation of CO (PROX), J. Catal. 276 (2010) 360-370.
[51] O.H. Laguna, M.A. Centeno, M. Boutonnet, J.A. Odriozola, Fe-doped ceria solids synthesized by the microemulsion method for CO oxidation reactions, Appl. Catal. B: Environ. 106 (2011) 621-629
[52] S. Phokha, S. Pinitsoontorn, S. Maensiri, Structure and Magnetic Properties of Monodisperse Fe3+-doped CeO2 Nanospheres. Nano-Micro Letters 5 (2013) 223-233.
35 [53] F. Deorsola, S. Andreoli, M. Armandi, B. Bonelli, R. Pirone, Unsupported nanostructured Mn oxides obtained by Solution Combustion Synthesis: Textural and surface properties, and catalytic performance in NOx SCR at low temperature, Appl. Catal. A: Gen. 522 (2016) 120-129.
[54] M. S.P. Francisco, V.R. Mastelaro, P.A. P. Nascente, A.O. Florentino, Activity and Characterization by XPS, HR-TEM, Raman Spectroscopy, and BET Surface Area of CuO/CeO2 -TiO2 Catalysts, J. Phys. Chem. B 105 (2001) 10515-10522.
[55] S. Tsunekawa, T. Fukuda A. Kasuya, X-ray photoelectron spectroscopy of monodisperse CeO2−x nanoparticles, Surf. Sci. Lett. 457 (2000) L437–L440.
[56] L. Qiu, F. Liu, L. Zhao, Y. Ma, J. Yao, Comparative XPS study of surface reduction for nanocrystalline and microcrystalline ceria powder, Appl. Surf. Sci. 252 (2006) 4931–4935. [57] J. Marrero-Jerez, S. Larrondo, E. Rodríguez-Castellón, P. Núñez, TPR, XRD and XPS characterisation of ceria-based materials synthesised by free-ze-drying precursor method, Ceram. Int. 40 (2014) 6807-6814.
[58] A. Zecchina, C.O. Areán, Diatomic molecular probes for mid-IR studies of zeolites, Chem. Soc. Rev. 25 (1996) 187-197.
[59] A. Katovic, G. Giordano, B. Bonelli, B. Onida, E. Garrone, P. Lentz, J.B. Nagy, Preparation and characterization of mesoporous molecular sieves containing Al, Fe or Zn, Micropor. Mesopor. Mat. 44-45 (2001) 275-281.
[60] B. Bonelli, B. Onida, J.D. Chen, A. Galarneau, F. Di Renzo, F. Fajula, E. Garrone, Spectroscopic characterisation of the strength and stability of the acidic sites of Al-rich microporous micelle-templated silicates, Micropor. Mesopor. Mat. 67 (2004) 95-106.
36 [61] A. Badri, C. Binet, J.-C. Lavalley, An FTIR study of surface ceria hydroxy groups during a redox process with H2, J. Chem. Soc. Faraday Trans. 92 (1996) 4669-4673.
[62] C. Binet, M. Daturi, J.-C. Lavalley, IR study of polycrystalline ceria properties in oxidised and reduced states, Catal. Today 50 (1999) 207-225.
[63] S. Kumar, A.K. Rai, V.B. Singh, S.B. Rai, Vibrational spectrum of glycine molecule, Spectrochim. Acta A 61 (2005) 2741–2746.
[64] H.-W. Jochims, M. Schwell, J.-L. Chotin, M. Clemino, F. Dulieu, H. Baumgärtel, S. Leach, Photoion mass spectrometry of five amino acids in the 6–22 eV photon energy range, Chem. Phys. 298 (2004) 279–297.
[65] K.I. Hadjiivanov, G.N. Vayssilov, Characterization of oxide surfaces and zeolites by carbon monoxide as an IR probe molecule, Adv. Catal. 47 (2002) 307-511.
[66] T. Tabakova, M. Manzoli, F. Vindigni, V. Idakiev, F. Boccuzzi, CO-Free Hydrogen Production for Fuel Cell Applications over Au/CeO2 Catalysts: FTIR Insight into the Role of Dopant, J. Phys. Chem. A 114 (2010) 3909–3915.
[67] G.N. Vayssilov, M. Mihaylov, P.St. Petkov, K.I. Hadjiivanov, K.M. Neyman, Reassignment of the Vibrational Spectra of Carbonates, Formates, and Related Surface Species on Ceria: A Combined Density Functional and Infrared Spectroscopy Investigation, J. Phys. Chem. C 115 (2011) 23435-23454.
[68] T. Vinodkumar, D. Naga Durgasri, B.M. Reddy, I. Alxneit, Synthesis and structural characterization of Eu2O3 doped CeO2: influence of oxygen defects on CO oxidation, Cata. Lett. 144 (2014) 2033-2042.
37 [69] M. Popa, J.M. Calderon Moreno, Lanthanum ferrite ferromagnetic nanocrystallites by a polymeric precursor route, J. All. Comp. 509 (2011) 4108-4116.
[70] L.G. Pinaeva, L.A. Isupova, I.P. Prosvirin, E.M. Sadovskaya, I.G. Danilova, D.V. Ivanov, E.Yu. Gerasimov, La-Fe-O/CeO2 Based Composites as the Catalysts for High Temperature N2O Decomposition and CH4 Combustion, Catal Lett 143 (2013) 1294–1303.
[71] T. Andana, M. Piumetti, S. Bensaid, N. Russo, D. Fino, R. Pirone, CO and Soot Oxidation over Ce-Zr-Pr Oxide Catalysts, Nanoscale Res. Lett 11 (2016) 278.
[72] M. Piumetti, S. Bensaid, D. Fino, N. Russo, Nanostructured ceria-zirconia catalysts for CO oxidation: Study on surface properties and reactivity, Appl. Catal. B 197 (2016) 35–46.
[73] H.-T. Chen, J.-G. Chang, Computational Investigation of CO Adsorption and Oxidation on Iron-Modified Cerium Oxide, J. Phys. Chem. C 115 (2011) 14745–14753.
Table 1
Some relevant physico-chemical parameters of the samples, as determined by compositional analysis (XRF, EDX and XPS); N2 isotherms at -196 °C and H2-TPR.
38 Sample (Fe/Ce nominal atomic ratio) Fe/Ce atomic ratio from XRF Average Fe/Ce atomic ratio from EDX Surface Fe/Ce atomic ratio from XPS BET SSA (m2 g-1) Amount of H2 consumed during TPR (mol g-1) Ce (Fe/Ce = 0) 0 0 0 25 1.01 Ce_Fe3 (Fe/Ce = 0.031) 0.031 0.038 0.468 5.0 1.17 Ce_Fe6 Fe/Ce = 0.064 0.064 0.064 0.672 2.5 1.63
Table 2: Refined unit cell (a), grain size (D), micro-strain () and QPA phases percentages as
obtained by Rietveld refinement.
Sample Cell parameter a (Å) Grain size D (nm) Micro-strain QPA wt% CeO2 wt% CeFeO3 CeO2 5.41404(3) 20 0.045 100 Ce_Fe3 5.41405(7) 137 0.0225 98.4 1.6 Ce_Fe6 5.413907(4) 137 0.04 95 5 Table 3