HAL Id: hal-02924042
https://hal.inrae.fr/hal-02924042
Submitted on 27 Aug 2020
HAL is a multi-disciplinary open access
archive for the deposit and dissemination of
sci-entific research documents, whether they are
pub-lished or not. The documents may come from
teaching and research institutions in France or
abroad, or from public or private research centers.
L’archive ouverte pluridisciplinaire HAL, est
destinée au dépôt et à la diffusion de documents
scientifiques de niveau recherche, publiés ou non,
émanant des établissements d’enseignement et de
recherche français ou étrangers, des laboratoires
publics ou privés.
Once a quality-food consumer, always a quality-food
consumer? Consumption patterns of organic, label
rouge, and geographical indications in French scanner
data
Mathieu Lambotte, Stéphane de Cara, Valentin Bellassen
To cite this version:
Mathieu Lambotte, Stéphane de Cara, Valentin Bellassen. Once a quality-food consumer, always a
quality-food consumer? Consumption patterns of organic, label rouge, and geographical indications
in French scanner data. Review of Agricultural, Food and Environmental Studies, Springer, 2020,
�10.1007/s41130-020-00121-z�. �hal-02924042�
1
Once a quality-food consumer, always a quality-food consumer? Consumption
patterns of organic, label rouge
and geographical indications in French scanner data
Accepted, unedited version (postprint)
Journal: Review of Agricultural, Food and Environmental Studies
Authors : Mathieu Lambottea*, Stephane De Carab, and Valentin Bellassena.
a CESAER, INRAE, Université Bourgogne Franche-Comté, AgroSup Dijon, 21000 Dijon, France.
b Economie Publique, INRAE, AgroParisTech, Université Paris-Saclay, 788850 Thiverval-Grignon, France. * Corresponding author, email address: mathieu.lambotte@inrae.fr
Abstract
The aim of this study is to analyze the behavior of French consumers with respect to food products under various quality labels (organic, label rouge, and geographical indications). In particular, we investigate if consumers who purchase once a product under a given label tend to purchase a large fraction of this product (and other products) under the same label.
Using a large scanner database, the regularity of quality-food consumption is analyzed through the relative frequency of conventional and quality purchases. The respective roles in regular consumption of product attributes, availability and household characteristics are then examined using a random utility model. Regular organic consumers purchase around 28% of the organic market value, with variations depending on products. We find that product attributes are more related to regular organic behavior than household characteristics. In particular, product availability and product family (vegetables, eggs, milk, etc.) play a key role whereas low-price organic products are not associated with more regular consumption.
Acknowledging the existence of regularity in organic consumption and understanding its variation between product categories should lead public policies to more often target specific products in order to develop quality-food consumption.
Keywords
: quality food, consumption behavior, organic, regularity, Lancaster.Acknowledgments
We are thankful to Stéphan Marette, Céline Bonnet, Christine Boizot-Szantai, Burkhard Schaer, Sophie Legras, Georges Giraud and Louis-Georges Soler for their fruitful discussions and comments on the manuscripts. We are also grateful to ALISS and especially Nicolas Guinet for facilitating the access to the panel data and providing support to its analysis
Declarations
FundingThe research leading to these results was funded by the REGION Region Bourgogne Franche-Comté and project DIETPLUS, grant ANR-17-CE21-0003 financed by the French National Agency for Research (ANR). The authors only are responsible for any omissions or deficiencies
.
Stéphane De Cara acknowledges additional support from the CLAND grant (ANR-16-CONV-0003) funded by the French National Research Agency under the "Investissements d’avenir" program.Conflict of
interestOn behalf of all authors, the corresponding author states that there is no conflict of interest.
2
1. IntroductionOver the last few years, the consumption of organic food has experienced a rapid and steady growth. In France, its value rose from € 5.9 billion in 2015 to € 9.7 billion—i.e., 5% of food expenditures—in 2018 (Agence Bio, 2019b). In a recent French survey, about one in eight respondents declares eating at least one organic product a day (Agence Bio, 2019a). Other quality labels—such as Protected Designation of Origin (PDO), Protected Geographical Indication (PGI) or label rouge—also represent a substantial and increasing share in food consumption. For some products, these labels dominate organic ones as a quality sign. This is notably the case for cheese, for which geographical indications represent 11% of the French market, a much higher share than that of organic cheese (2%).
The rising demand for quality-food products—defined here as products certified as organic, PDO, PGI or label
rouge—impacts farming practices, land use, and value chains. As an illustration, the area devoted to organic
agriculture in France has increased by 48.3% from 2015 to 2018, reaching 7.5% of the total agricultural area. As for other quality signs, between 2015 and 2019, the volume of meat and dairy products, fish, and eggs produced under these labels has increased from 602 to 665 thousand tons, reaching 1.5% to 1.8% of market share in these categories (INAO, 2019).
Providing consumers with healthier and higher-quality food while leveraging the potential health and environmental benefits from less intensive agricultural practices without affecting too negatively farmers’ income has attracted renewed interest from policy makers. The development of the production and consumption of quality-food products (organic food, but also other quality signs) has become a central objective in
agricultural and food policies. EGalim, a French law on food and agriculture passed in 2018, provides a good illustration of this trend in public policies.
An adequate understanding of the demand-side determinants of quality-food consumption is thus critical to assess the potential impacts of such policies. In particular, it is important to determine whether the demand for these products comes primarily from a large base of occasional consumers or a small base of ‘regular’ ones. The recent increase in quality-food consumption is consistent with both a larger consumer base and an increasing share of quality-food in individual purchases. Which explanation dominates remains however an open question. This raises further questions regarding consumers’ behavior with respect to quality-food products. Do consumers tend to routinely and systematically purchase a product under the same label? If so, is this behavior restricted to some products, or consistent across the food basket? The answers to these questions may have strong
implications for the design and targeting of the policies aiming to develop quality-food consumption. In this article, we define a ‘regular’ consumer—as opposed to an ‘occasional’ one—as a consumer who predominantly buys a given product with a consistent quality. Regularity in quality-food consumption is thus related to how consumers perceive and value quality labels. In this regard, previous research has shown that credence attributes—i.e., attributes that the consumer cannot identify through search nor experience—play a major role in the decision to buy quality-food products (Massey et al., 2018; Padilla et al., 2013; Rana and Paul, 2017). If the demand for quality-food products is primarily driven by credence attributes, one may expect that regularity should be the rule rather than the exception.
Yet, this intuition is at odds with recent evidence. In a study of organic food purchasing behaviors in France, Boizot-Szantai et al. (2017) find that organic food represents only 8.1% of total food expenditures of the consumers whose organic budget share is above the top quintile. This suggests that, even for the consumers who value organic food the most, a large share of their purchases goes to non-organic products. That is not to say, however, that regularity is necessarily absent from consumers’ behavior. A consumer may well always choose to buy the organic version of some products, and systematically prefer the conventional version (or another quality label) of other products. The aggregation of all food expenditures at the food-basket level therefore may thus mask regularity patterns that occur at the product level.
Our main objective is to identify and document regularity patterns in food purchasing behaviors at various levels of aggregation and for various quality labels, and to study the interplay with other drivers of quality-food consumption such as price, availability and socio-demographic characteristics of quality-food consumers. Our study thus contributes to the large body of literature—in economics, but also in sociology and marketing science—that has examined consumers’ behavior and attitude towards quality-food products. The vast majority
3
of this literature is focused on organic consumption, which covers a wider range of food products than other quality signs. This literature has investigated the effects of price, income, and socio-demographic variables on organic food consumption, as well as the role of the relative preferences for products objective characteristics (taste, color, etc.) and considerations regarding health, the environment, ethics, or animal welfare.
Quantitative studies in this literature are based on two broad types of approaches. First, a number of studies use surveys or controlled experiments. These studies rely on stated preferences to elicit consumers’ preferences or willingness to pay for various goods with different characteristics or attributes. The experimental design makes it possible to disentangle potential confounding factors. However, they often rely on small sample sizes and/or may be subject to sampling biases. Furthermore, stated intentions to buy quality food may overestimate actual purchases (Sun et al., 2010). Studies in the second category are based on observational data. Those relying on scanner data are particularly relevant for the present study. By using detailed records of actual and repeated purchases by a large and representative sample of consumers, such studies allow to overcome some of the limitations faced by survey-based and experimental approaches. Observed purchases do not, however, directly inform on consumers’ preferences. In addition, such data mostly pertain to purchases for food-at-home consumption at the household level, which may differ from actual consumption at the individual level.
This literature has shed interesting light on the socio-demographic profile of quality-food consumers, as well as on the influence of product attributes on consumption behavior. For example, findings suggest that organic food consumers tend to be more educated and have higher income than conventional food consumers. They are more likely to be female and to have children, especially newborns (Gracia et al., 2008; Hughner et al., 2007). They also spend more on food and have a healthier diet (Boizot-Szantai et al., 2017). Several studies underline the key importance of credence attributes in attitudes toward organic food. Consumers tend to place more value on credence attributes of organic products than on their search and experience attributes (Massey et al., 2018; Rana et al., 2017). The influence of credence attributes on the probability of purchasing organic products has been found to be larger than that of education, marital status, and income (Padilla Bravo et al., 2013). The review by Rödiger and Hamm (2015) shows inconclusive evidence with respect to the effect of price on organic
consumption. Results from observational studies indicate that the effect of economic determinants of organic consumption, most notably price and availability, varies across products and types of retail stores (Buder et al., 2014; Dimitri et al., 2012; Padel et al., 2005).
Regularity in organic food consumption has been much less studied than the influence of the socio-demographics variables, price, income, or product attributes. Some survey-based studies have examined the factors influencing the probability that a consumer defines himself or herself as a regular organic consumer (Barrena et al., 2010; Baudry et al., 2019; Kesse-Guyot et al., 2013; Oates et al., 2012; Onyango et al., 2007; Pearson et al., 2013; Treu et al., 2017). However, as these studies are based on stated consumption averaged at the whole food basket level, it is difficult to draw robust conclusions on actual purchases at finer aggregation levels. Observational studies based on scanner data (Boizot-Szantai et al., 2017; Lacour et al., 2018) provide some interesting findings about purchasing patterns, but, the focus in these studies is on the share of organic food in total food expenditures. Considering all food products together may mask regularity patterns at a more disaggregated level.
Although expectedly important, the availability of quality-food products has also received less attention than other potential determinants (Dimitri et al., 2012). One reason lies in the difficulty to accurately quantify availability. As a consequence, availability has been overlooked in most survey-based and observational studies of organic consumption.
In this paper, we use a large scanner dataset of food purchases in France, provided by Kantar®, which provides detailed records (quantities, price, type of retail store, etc.) of purchases of 237 food products by an unbalanced panel of 12,453 French households between 2011 and 2016, along with socio-demographic information about households (age, income, département of residence, household size, etc.). This dataset enables to decompose household food purchases at a fine level of disaggregation in terms of products. Importantly, it informs about the labels (organic, PDO, PGI, label rouge), if any, attached to each purchased product.
In order to identify regularity, we use two complementary approaches. For a given product or category of products, we first examine whether the distribution of purchases under a given label is compatible with a large base of occasional consumers, or a small base of quality regulars. In a second step, we then investigate the influence of various determinants of the probability that a consumer is regular for a given product and label. The
4
variables accounted for in this analysis include various characteristics of products (price, retailer’s brand, availability), retail stores, and households (socio-demographic variables, income, city size, etc.).
We take advantage of the richness of this information to address four main questions. First, can the consumption of a given (set of) product(s) be characterized as ‘regular’? In other words, do consumers purchase mostly one version of the product (conventional, organic, PDO, PGI, or label rouge) or do they buy a mix of various versions? Second, is regularity consistent across the food basket? Put differently, are quality regulars for a given product also regular for most of all other products they purchase? Third, how much of the total demand for quality-food products comes from regular consumers? Fourth, how do product attributes and household’s characteristics interplay in the probability that a given household is a quality regular for a given food product? Our contribution is threefold. First, we address these questions for a wide range of products sold under various labels. Contrary to most of the literature, which is predominantly focused on organic products, we extend the scope of the analysis to other quality labels such as PDO, PGI, or label rouge. Products under these labels have several important features in common with organic products. In particular, their production is often based on extensive farming practices with a potential to improve the sustainability of food systems (Arfini and Bellassen, 2020) and credence attributes play a major role in consumers’ decision to buy these products. They do however differ from organic products in a number of dimensions, such as the range of products covered by the label, availability, price, perception of environmental and health benefits, organoleptic characteristics, aspect, etc. We investigate whether different labels can be associated with different purchasing behaviors in terms of regularity. Besides, previous studies were often focused on only one or a few products. The large number of products (237) examined in this article allows us to further study how consumers’ behaviors varies with the type of products (Buder et al., 2014; Chekima et al., 2017; Padel et al., 2005).
Second, we identify regularity patterns in quality-food consumption, but not for all products nor all labels. Such findings would not have been possible with the level of aggregation and coverage used in previous studies (Boizot-Szantai et al., 2017; Lacour et al., 2018).
Third, we propose a new indicator of availability of quality-food products. The main difficulty is that, availability of products that are not bought by consumers in the sample cannot be directly observed. We
circumvent this difficulty by constructing a novel indicator based on web-scrapping techniques applied to online catalogues of retail stores. This indicator allows us to determine the share of retail stores where any given product can be found within a given region in the total number of stores visited by a given consumer. This indicator is found to be strongly and positively correlated to the probability that a consumer is an organic regular.
In sum, after detailing our methodology, we present the results organized in two axis, the first one on the identification of quality-food regular consumption and the second on its determinants, then discuss them and conclude.
5
2. Methodology2.1. Theoretical framework
Consumers often have the choice between several versions of the same food product, e.g. between conventional, organic, PDO, PGI, or label rouge. Although different versions of the same product share some common characteristics, they may also differ along various attributes. Some of these attributes are specific to the product itself, whereas others are attached to perception of the label by the consumer. Some can be observable through search and experience. Others remain unobservable and are therefore akin to credence attributes.
Previous research has shown that credence attributes are major drivers of organic and other quality-food purchases (Gracia and Magistris, 2008; Barrena and Sánchez, 2010; Massey et al., 2018; Rana and Paul, 2017). Most of the attributes that define a product—regardless of the presence of a label—can be identified by search and/or experience. In contrast, most of the distinctive attributes of quality-food items are credence attributes. Note that some of the credence attributes associated with a given label may be shared by all products under the same label. It is thus important to disentangle consumers’ preferences towards (i) food products regardless of their quality label and (ii) credence attributes associated with quality labels (or absence thereof) across all products. Note also that preferences for a quality label may vary from one product to the other.
It is useful to illustrate the consumer’s problem by a simple theoretical framework inspired by Lancaster’s approach to consumer demand (Lancaster, 1966) and akin to the individual utility model of the BLP model (Berry et al., 1995). This simple model accounts for search and experience as well as credence attributes. Consider the choice faced by consumer i over a set J of food products (indexed by 𝑗). Food products are
available in various qualities indexed by 𝑙 in 𝐿, including a conventional version (indexed by 𝑙 = 𝑐) and different quality labels. Assume that the consumer’s preferences can be represented by a utility function
𝑈𝑖(𝑞𝑖0; {𝑢𝑖𝑗𝑙(𝑞𝑖𝑗𝑙)}𝑗∈𝐽,𝑙∈𝐿), where 𝑞𝑖0 is the quantity of a composite non-food item, 𝑞𝑖𝑗𝑙 is the quantity of j-th product of quality l, and 𝑢𝑖𝑗𝑙(. ) is the respective subutility function. For simplicity, assume that 𝑢𝑖𝑗𝑙(𝑞𝑖𝑗𝑙) takes the following simple Cobb-Douglas form:
𝑢𝑖𝑗𝑙(𝑞𝑖𝑗𝑙) = 𝑎𝑖𝑗𝑙ln(q𝑖𝑗𝑙) = 𝑎𝑖𝑗𝑠𝑒ln(q𝑖𝑗𝑙) + 𝑎𝑖𝑙𝑐𝑟ln(q𝑖𝑗𝑙) + 𝑎𝑖𝑗𝑙𝑠𝑒×𝑐𝑟ln(q𝑖𝑗𝑙) (1) The formulation in Eq. (1) characterizes the consumer’s utility with respect to product j of quality l. It is
parameterized by 𝑎𝑖𝑗𝑙> 0, which can be decomposed into three terms capturing the utility derived from search and experience attributes (se), credence attributes (cr), and an interaction term (𝑠𝑒 × 𝑐𝑟). The parameter 𝑎𝑖𝑗𝑠𝑒 parametrizes the utility for the j-th product regardless of its quality. It captures how much the consumer values product-specific attributes that can be apprehended by search and experience (e.g., in the case of an apple, characteristics such as the fact that it is a rather small, round, acid and sweet fruit). 𝑎𝑖𝑘𝑐𝑟 parameterizes the utility for quality l across all products. This parameter is thus label-specific and captures how consumer i values the credence attributes attached to label l (e.g., in the case of organic products, the implications that farming practices do not rely on pesticides nor synthetic fertilizers). The third term 𝑎𝑖𝑗𝑙𝑠𝑒×𝑐𝑟 captures the interaction between the search and experience attributes of product j with the credence attributes associated with quality l. This reflects that the credence attributes attached to a specific label may vary from one product to the other (e.g., the consumer may value more organically-produced apples than organically-produced eggs). Further assume that the price of the conventional version of the product (𝑙 = 𝑐) is lower than the price of all other quality versions of the product. For simplicity, we normalize the parameters in Eq. (1) so that 𝑎𝑖𝑐𝑐𝑟= 𝑎𝑖𝑗𝑐𝑠𝑒×𝑐𝑟= 0 for all j.
The quantities 𝑞𝑖𝑗𝑙 that maximize the consumer’s utility subject to the budget constraint depend on prices and income, as well as on the elasticities of substitution between products and qualities implied by the form of 𝑈𝑖(. ). One expects that the demand in product j of quality 𝑙 ≠ 𝑐 to be close to 0 if 𝑎𝑖𝑙𝑐𝑟 and 𝑎𝑖𝑗𝑙𝑠𝑒×𝑐𝑟 are both close to 0— i.e., if the credence attributes attached to the label l are perceived as unimportant by the consumer relative to the search and experience attributes of the product. If this condition holds for all 𝑙 ≠ 𝑐, the product is predominantly purchased in its conventional version and the consumer is said to be a conventional regular. Conversely, if 𝑎𝑖𝑙𝑐𝑟+ 𝑎
𝑖𝑗𝑙𝑠𝑒×𝑐𝑟 is sufficiently large relative to 𝑎𝑖𝑗𝑠𝑒, the consumer is a quality l regular for product j.
Moreover, if 𝑎𝑖𝑙𝑐𝑟 is sufficiently large relatively to 𝑎𝑖𝑗𝑙𝑠𝑒×𝑐𝑟 for all j—that is, if the consumer mostly values the credence attributes associated with the quality label l—and 𝑈𝑖(. ) is such that the consumer’s preferences exhibit
6
some taste for product variety, one should expect the quantities of purchased food items of quality l to be positively correlated across products. If, to the contrary, the consumer mostly values the credence attributes when they are associated with a specific subset of search and experience attributes–corresponding to 𝑎𝑖𝑗𝑙𝑠𝑒×𝑐𝑟 being much larger than 𝑎𝑖𝑙𝑐𝑟 for a few values of j, one should expect little correlation between the purchased quantities of products of quality l.
2.2. Distribution of quality-food consumption
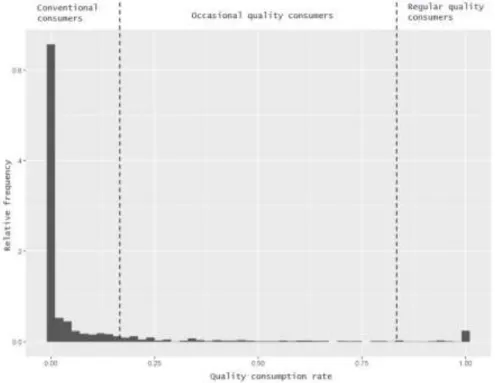
We first investigate regularity by analyzing the distribution of the quality consumption rate of a given product, i.e. the ratio of purchases of the quality version of the product over the total number of purchases during the time span the household remains observed in our dataset. Individuals who almost never buy the quality version of the product are characterized by a quality consumption rate close to 0. They are said to be ‘conventional regulars’; those who mostly purchase the quality version (i.e., quality consumption rate close to 1) are said to be ‘quality regulars’.
The first part of our investigation is organized around the three following hypotheses:
For a given product, consumers are regulars: they either purchase mostly its conventional version or its quality version, but not a mix of both (H1);
Quality regular consumption is consistent across the food basket: a consumer who is a quality regular for a product is a quality regular for an important part of his food basket (H2);
The total turnover of quality products purchased by regulars is substantial (H3).
If H1 holds true, the distribution of the quality consumption rate among the sample should be bimodal, with a mode around 0 (conventional regulars) and another around 1 (quality regulars). Figure 1 illustrates such a case. The dashed lines represent the two thresholds under and above which a consumer is considered as a conventional or organic regular, respectively.
Figure 1. Bimodal distribution and classification of quality-food consumers
Following Silverman (1981), it is possible to test if the density of a distribution has more than k modes using kernel density estimation. Indeed, the kernel density estimate for window width h based on the observations
7
𝑓(𝑡, ℎ) = 𝑛−1ℎ−1∑ 𝐾{ℎ−1(𝑡 − 𝑋𝑖)} 𝑛
𝑖=1 , (2)
where 𝐾 is the normal density function in our case. The window width h is a parameter controlling to which extent the observations are smoothed in order to obtain the kernel estimate and t is the endogenously estimated mean of the kernel. If the data is multimodal, a large value of h will be needed to obtain a unimodal kernel estimate.
The test relies on the comparison between the estimated h for a unimodal distribution and hcrit, the k-critical
window width, defined as:
ℎ𝑐𝑟𝑖𝑡= 𝑚𝑖𝑛{ℎ, 𝑓(. , ℎ) ℎ𝑎𝑠 𝑎𝑡 𝑚𝑜𝑠𝑡 𝑘 𝑚𝑜𝑑𝑒𝑠}.
The lowest hcrit gives the most likely number of modes for the distribution. Using the Silverman test, we can thus
test whether the distribution of quality-food consumption is bimodal for each product and product family. To test H2, we define three types of behavior toward quality and organic food, illustrated in Figure 1:
conventional regulars, who are almost never buying the quality version of a product (0-20% of quality
purchases for a given product);
quality-food regulars, who are almost always buying the quality version (more than 80% of quality
purchases for a given product);
and occasional quality-food consumers (20-80% of quality purchases for a given product). The 20% and 80% thresholds are partly arbitrary. However, when a beta distribution is fitted to the organic consumption rate of products with a bimodal distribution, around 90% of the values are either above or below these thresholds (see supplementary materials (SM) 1 for the detailed procedure). Through this typology, we also assess the duplication of quality consumption behavior across different products (H2): if I am an organic regular for eggs, am I likely to be an organic regular for milk? (see Monier et al., (2009) for an example of this question in a two-products case).
2.3. Determinants of the probability to be a regular organic consumer
In a second step, we assess which product attributes or household characteristics influence whether a quality-food consumption (ith consumer x jth product) is regular. Because no regular behavior is identified for geographical indications and label rouge products (see section 4.1.1), this second step is restricted to organic products. We use the random utility discrete choice framework (McFadden, 2001) as an application of the theoretical model. In this model, the utility function is assumed to be well-behaved (preferences are complete, reflexive and transitive) and known by the consumer. Thus, the consumer can compare the organic and
conventional alternatives of a product and rank them in order to purchase the product that maximizes his utility. However, some parts of the utility function, essentially the preference for the credence attributes per se, cannot be separated from other elements in scanner data. This is why the random utility model is used here to identify which product attributes or household characteristics influence quality-food regularity rather than a structural estimate of the coefficients in equation (1) of our theoretical framework. The random utility model describes the utility (𝑈𝑖𝑗𝑜) of the ith consumer purchasing the jth product in its organic version as the sum of the observed attributes (𝑉𝑖𝑗) and a random component (𝜀𝑖𝑜):
𝑈𝑖𝑗𝑜= 𝑉𝑖𝑗𝑜+ 𝜀𝑖𝑗𝑜 (3)
Similarly, the utility (𝑈𝑖𝑗𝑐) of the conventional product j’s choice is described as:
𝑈𝑖𝑗𝑐= 𝑉𝑖𝑗𝑐+ 𝜀𝑖𝑗𝑐 (4)
The ith consumer will be an organic regular for the jth product at time t if 𝑈𝑖𝑗𝑜> 𝑈𝑖𝑗𝑐 and the probability that this consumer will be an organic regular can be written as:
𝑃(𝑌𝑖𝑗𝑡 = 1) = 𝑃(𝑈𝑖𝑗𝑡𝑜 > 𝑈𝑖𝑗𝑡𝑐) = 𝑃(𝜀𝑖𝑗𝑡𝑐− 𝜀𝑖𝑗𝑡𝑜< 𝑉𝑖𝑗𝑡𝑜− 𝑉𝑖𝑗𝑡𝑐) = 𝑃(𝜀 < 𝑉𝑖𝑗𝑡𝑜− 𝑉𝑖𝑗𝑡𝑐) (5) where 𝑌𝑖𝑗𝑡 is a binary choice variable:
𝑌𝑖𝑗𝑡= {1 if the 𝑖th consumer is an organic regular for the 𝑗th product at time 𝑡
8
Defining 𝑓(𝜀𝑖) as the density function of 𝜀𝑖, (3) becomes:𝑃(𝑌𝑖𝑗𝑡= 1) = ∫ 𝑍𝜀 𝑖𝑗𝑡(𝜀𝑖𝑗𝑡 < 𝑉𝑖𝑗𝑡𝑜− 𝑉𝑖𝑗𝑡𝑐)𝑓(𝜀𝑖𝑗𝑡)𝑑𝜀𝑖𝑗𝑡, (6) where 𝑍𝑖𝑗𝑡 is a binary variable indicating if the term inside the parenthesis is true (𝑍𝑖𝑗𝑡= 1) or false (𝑍𝑖𝑗𝑡 = 0), i.e. if the utility derived from the regular organic choice exceeds the one from the conventional choice.
Furthermore, 𝑍𝑖𝑗𝑡 can be empirically described as depending on the ith consumer’s characteristics and the jth product attributes at time t. Because most households remain in the panel for several years – on average 5 years – a random household effect is introduced to correct for the within-household correlation in the error terms:
𝑍𝑖𝑗𝑡= 𝛽𝑋𝑖𝑗𝑡+ 𝑢𝑖+ 𝜀𝑖𝑗𝑡 (7)
where 𝑋𝑖𝑗𝑡= (𝑥𝑖𝑗𝑡1, … , 𝑥𝑖𝑗𝑡𝑘) is a matrix of variables explaining the choice of being a regular organic consumer, i.e. they represent the jth product attributes (price ratio between the organic and the conventional version, a binomial variable indicating if the product is processed or not, the type of shop where the product is bought…) or the ith consumer’s characteristics (age of children, income, size of the city in which they live, their socio-professional category…), 𝛽 = (𝛽0, 𝛽1, … , 𝛽𝑘) is a vector of parameters to be estimated, 𝜀𝑖𝑗𝑡 captures the idiosyncratic residuals and 𝑢𝑖 is a random effect related to the ith household, accounting for the unobserved heterogeneity of the households and the correlation among the 𝜀𝑖𝑗𝑡.
To estimate Eq. (7) with scanner data, we assume that 𝜀𝑖𝑖𝑡 follow a logistic distribution and thus that 𝜀𝑖𝑗𝑡𝑐 and 𝜀𝑖𝑗𝑡𝑜are identically and independently distributed as type I extreme value (Onyango et al., 2007). This hypothesis on the distribution of the errors terms may sometimes be violated in empirical analysis, as the unobserved portion of utility, captured by the errors terms, can be correlated among the different consumer x product couples, but the potential induced bias is limited (Train, 2003). Under this assumption, 𝑃(𝑌𝑖𝑗 = 1), the probability that the consumer i is an organic regular for the product j is given by the following logit model: 𝑃(𝑌𝑖𝑗 = 1) = 𝐹(𝑍𝑖𝑗) = 𝐹(𝛽𝑋𝑖𝑗𝑡+ 𝜀𝑖) =
1
1+exp(−𝛽𝑋𝑖𝑗𝑡+𝜀𝑖). (8) Furthermore, we construct two other logit models, one—Logit Product—using only the information on the product attributes and the other—Logit Household—using only the variables describing the consumers’
characteristics. Using a likelihood ratio test, we then compare the goodness of fit of these two models, in order to assess which set of characteristics—products’ vs households’—is the most important driver of regular organic behavior.
We repeat the analysis on a restricted sample containing only households who purchased at least 20% the product of interest as organic. This allows to examine whether the same variables are correlated to the probability of being a regular organic consumer for a product, compared to being either a conventional or occasional consumer (called thereafter “full sample logits”) or to the probability of being a regular organic consumer compared to being an occasional consumer only (“restricted sample logits”).
3. Data
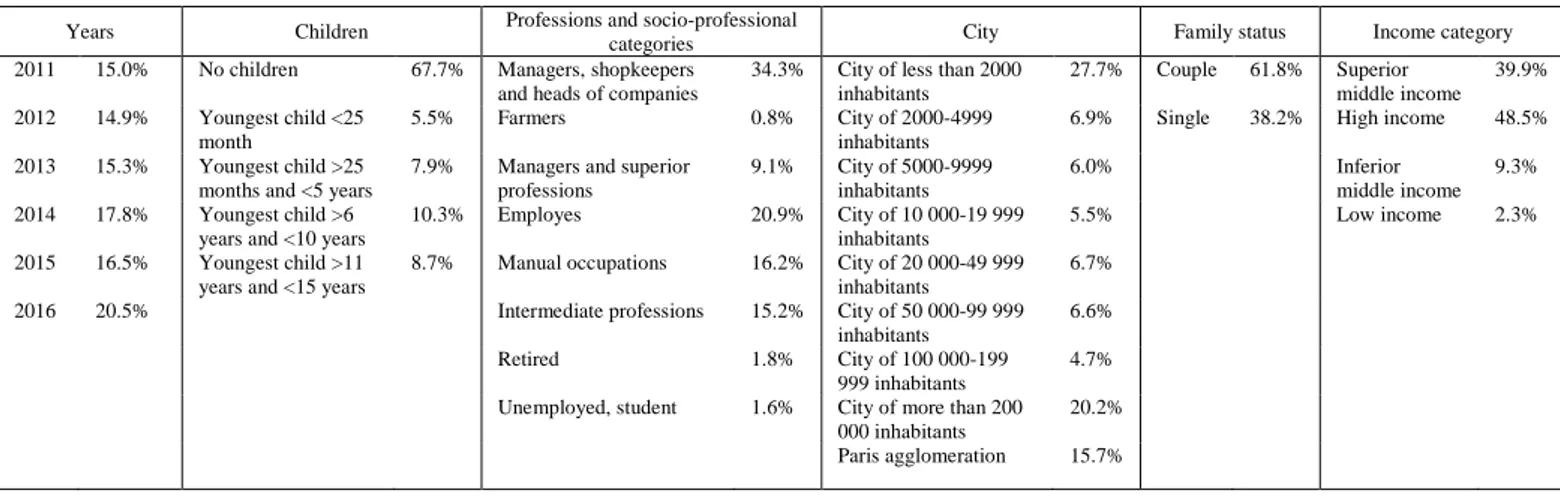
This paper uses French data from Kantar WorldPanel which contains food-at-home purchases of French households. For the analysis, we use the number of organic, quality and conventional products purchased, filtering out households who bought less than three times the considered products. To define the product families (level 1, 23 families), the classification from (Boizot-Szantai et al., 2017) is reused, with more detailed groups for fruits and vegetables. We also created a more in-depth classification (level 2, with 237 categories/products), which differentiate each fruit and vegetable (carrots, potatoes…) and types of meat (pork, beef…). In this panel data, we also have socio-economic information on 12,453 yearly active households, surveyed one or several years from 2011 to 2016 (5 years on average) whose descriptive statistics are presented below (Table 1). In addition, a map of the spatial distribution of our sample in France is available in SM 3.
9
Table 1. Descriptive statistics of the households in the sample (relative frequencies)
As shown in the introduction, the organic products’ availability and their price differences compared to conventional versions are presented as key drivers of organic consumption.
However, in the recent literature on organic consumption, availability is most often neglected. In order to assess the role of product availability on consumption behavior, an indicator of the availability of quality-food—organic, red label or geographical indications—is developed for each consumer. This indicator is the share of shops which offer the quality food of interest out of all shops where the household is going and the exhaustive results are available in the supplementary data (SD) 1. It is computed after the following steps:
For each household, we define the set of shops where it is going as the shops where the household went at least three times.
For each shop, we estimate that a given quality product is available if it has been purchased by at least one household in a shop of the same retail chain, same size (hypermarket/supermarket) and in the same region. These three variables are indeed the most important in predicting the availability of organic products: together, they explain 68% of the variance in the number of organic items available for online purchase in the Burgundy region (see SM 2 for details on data collection and regression).
At shops where there are few purchases for a given product, the absence of organic purchases may be an artefact caused by data scarcity rather than actual unavailability. These shop x product combinations are filtered out as “no data” to avoid false negatives. For this purpose, the act of buying an organic product in a given shop is assumed to follow a binomial law using the nationwide average share of organic purchases for this product as its probability of success. We determine the critical (minimal) sample size, for a given significance level of 0.05 and a power level of 0.8, for which the hypothesis that the product is available but has not been purchased can be rejected.
Then, if the observed number of purchases of a product is above the critical sample size and if the organic version has never been purchased, we can assert that the organic version of the product is not available. However, if the organic version has been purchased at least one time, we directly assess that it is available in the shop considered.
The indicator of availability for each household is then defined as the proportion of shops offering the organic product among all shops in which the household purchases food. The indicator ranges between 0—the organic version of the product is never available to the household, and 1—the organic version of the product is available in all the shops the household attends to.
Similarly, we develop a price ratio indicator (organic price per kg divided by conventional price per kg) between organic and conventional versions of a same product, which varies depending on the region, the shop and the product considered. In addition, we create an absolute price difference indicator (organic price per calorie – conventional price per calorie, the harmonization per calorie making it comparable across product families).
Years Children Professions and socio-professional
categories City Family status Income category 2011 15.0% No children 67.7% Managers, shopkeepers
and heads of companies
34.3% City of less than 2000
inhabitants 27.7% Couple 61.8% Superior middle income 39.9% 2012 14.9% Youngest child <25 month 5.5% Farmers 0.8% City of 2000-4999 inhabitants
6.9% Single 38.2% High income 48.5% 2013 15.3% Youngest child >25
months and <5 years
7.9% Managers and superior professions 9.1% City of 5000-9999 inhabitants 6.0% Inferior middle income 9.3% 2014 17.8% Youngest child >6
years and <10 years
10.3% Employes 20.9% City of 10 000-19 999 inhabitants
5.5% Low income 2.3% 2015 16.5% Youngest child >11
years and <15 years
8.7% Manual occupations 16.2% City of 20 000-49 999 inhabitants
6.7% 2016 20.5% Intermediate professions 15.2% City of 50 000-99 999
inhabitants
6.6% Retired 1.8% City of 100 000-199
999 inhabitants
4.7% Unemployed, student 1.6% City of more than 200
000 inhabitants
20.2% Paris agglomeration 15.7%
10
4. Results4.1. Bimodality of quality-food consumption at different aggregation levels
4.1.1. Consumption behavior of geographical indications and label rouge products is occasional For the few products for which information on quality purchases other than organic is available (labelled meat, fish, eggs, processed meat and cheese), these quality purchases are not bimodally distributed, with the exception of processed meat (label rouge and PDO matured ham) which has a mode above 80% of quality purchases (Table 2). It must be noted that label rouge and PDO/PGI information are lacking for some products (i.e. meat, where certification information is available for chicken only). Consumers thus buy these products as exceptional purchases, possibly for special occasions. H1 is therefore invalidated for geographical indications and label rouge, and so is H2. Moreover, only 3% of the market value of these certified products is purchased by regular consumers, which invalidate H3 (for an example, see Table 4). As geographical indication and label rouge products are not subject to regular consumption, we do not perform the second part of the analysis (estimation of the determinants of regular consumption) for them.
Table 2. Distribution of the quality labels (PDO, PGI, label rouge) consumption per product family Nb of bimodal categories Nb of unimodal categories Nb of multimodal regular categories Nb of multimodal not regular categories
Meat (Chicken only) 2
Processed Meat 2 3 2 2
Seafood 2
Eggs 1
Cheese 1
Unimodal = single mode (no regular behavior or only conventional regulars) / Bimodal = two modes with one lower than 20% and the second higher than 80% (regularity, either conventional or quality-food) / Multimodal regular = at least three modes, including one higher than 80% (existence of all consumer types: conventional regulars, occasional and quality regulars) / Multimodal not regular = at least three modes, none higher than 80% (no quality regulars).
4.1.2. Organic regulars are consistent for a given product, but not among product families 56% of the 23 families of products are subject to regular behavior from a significant share of
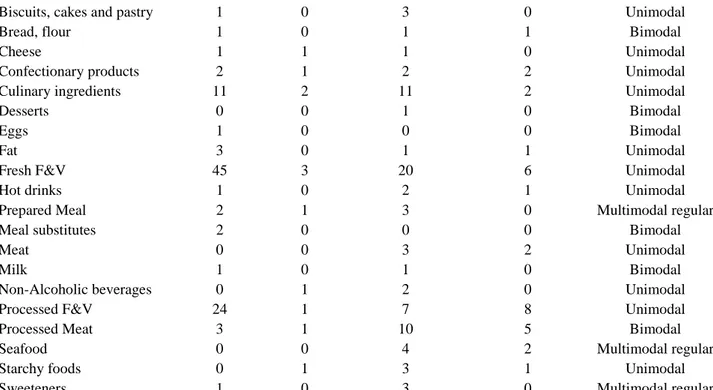
consumers (Table 3): 35% of distributions are bimodal and 21% are multimodal with one mode in the 80-100% range). However, the rationale for agglomerating products into families is not necessarily suited to assess the consistency of consumer behavior. Indeed, consumers are more consistent at the product level (for exhaustive results see the SD 2 and 3): 80% of products are subject to regular behavior from a significant share of consumers (bimodal (44%) or multimodal with a mode in the 80-100% range (36%)). For example, the distribution of the organic fat product family is not bimodal while a deeper look at the distribution of the 5 products categories composing this family shows that 3 fat products categories have a bimodal organic consumption distribution (Figure 2). H1 is therefore validated for organic products.
Table 3. Distribution of the organic consumption per product family Nb of bimodal distributions at product level Nb of unimodal distributions at product level Nb of multimodal distributions with one mode higher
than 80%
Nb of multimodal distributions without mode
higher than 80% Family distribution
Alcoholic beverages 1 1 3 3 Multimodal regular
Appetizers 0 0 3 0 Multimodal regular
11
Biscuits, cakes and pastry 1 0 3 0 Unimodal
Bread, flour 1 0 1 1 Bimodal
Cheese 1 1 1 0 Unimodal
Confectionary products 2 1 2 2 Unimodal
Culinary ingredients 11 2 11 2 Unimodal
Desserts 0 0 1 0 Bimodal
Eggs 1 0 0 0 Bimodal
Fat 3 0 1 1 Unimodal
Fresh F&V 45 3 20 6 Unimodal
Hot drinks 1 0 2 1 Unimodal
Prepared Meal 2 1 3 0 Multimodal regular
Meal substitutes 2 0 0 0 Bimodal
Meat 0 0 3 2 Unimodal
Milk 1 0 1 0 Bimodal
Non-Alcoholic beverages 0 1 2 0 Unimodal
Processed F&V 24 1 7 8 Unimodal
Processed Meat 3 1 10 5 Bimodal
Seafood 0 0 4 2 Multimodal regular
Starchy foods 0 1 3 1 Unimodal
Sweeteners 1 0 3 0 Multimodal regular
Unimodal = single mode (no regular behavior or only conventional regulars) / Bimodal = two modes with one lower than 20% and the second higher than 80% (regularity, either conventional or quality-food) / Multimodal regular = at least three modes, including one higher than 80% (existence of all consumer types: conventional regulars, occasional and quality regulars) / Multimodal not regular = at least three modes, none higher than 80% (no quality regulars).
Figure 2. Distribution of the organic consumption of fat products
4.1.3. The basket of organic regulars remains dominated by conventional products
Even if the existence of organic regulars can be observed for 80% of food products, the consumers that purchase several products as organic regulars are scarce. More than 71% of our sample does not buy any product as
12
organic regulars and only 6% purchase more than 5 products as organic regulars (see SD 4 for exhaustive results). The consumers in our sample purchase on average 80 different products. This shows that most
consumers have a regular organic behavior for only a few products (Figure 3). Thus, regular organic behavior is not very consistent across products and H2 is invalidated (this is consistent with the findings of Marian et al. (2014) in the case of organic red meat, chicken, milk and hard cheese).
In our theoretical framework, this indicates strong interaction effects in the consumer utility function (Eq. (1)) between the organic (credence) attribute of a product and the search and experience attributes (roots vegetables, fruits growing in a tree …). In product families compounded of many categories such as fresh Fruits and Vegetables (F&V), the regular organic behavior seems coherent among very similar products (quasi-substitutes, e.g. lemons and oranges), but not among modestly close products (e.g. carrots and onions). The interaction effect could therefore reveal itself for search and experience attributes slightly more generic than the product level, but certainly more specific than the product family level.
There is however a non-negligible category of consistent regulars: 0.8% of consumers are organic regulars for more than 40 products, that is half of the average basket, noting that many minor products are often not available at all under the organic label. For this consumer category, the appetence for the credence attribute per se is strong (𝑎𝑖𝑙𝑐𝑟 >> 𝑎𝑖𝑗𝑙𝑠𝑒×𝑐𝑟) in our theoretical framework). This consumer category represents 3% of all regulars for at least one product.
Figure 3.Distribution of the number of categories for which consumers are organic regulars
The number of categories is log-transformed and bound at 40 to increase the visibility of the plot.
4.1.4. 28% of the organic market is purchased by regular consumers
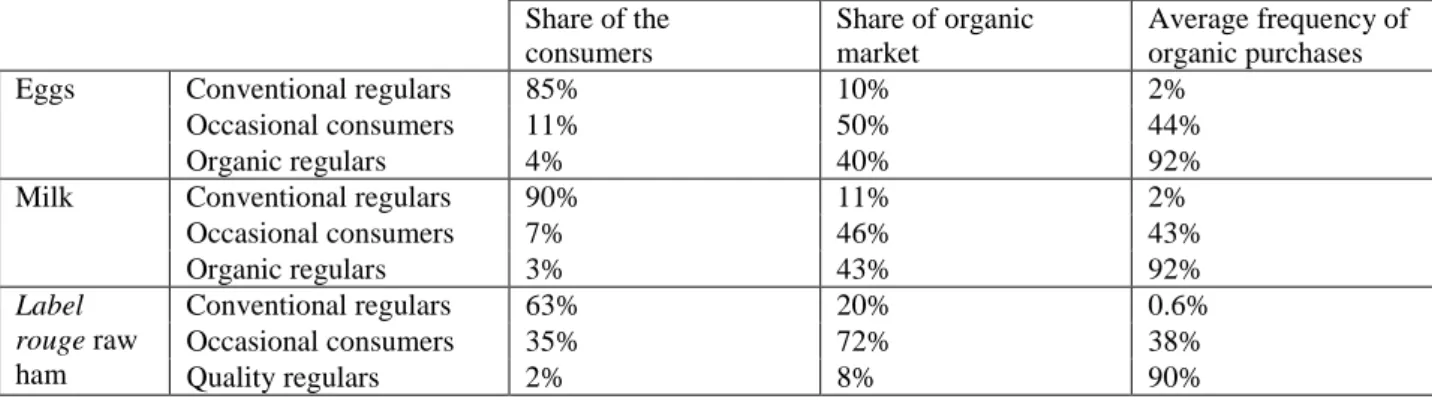
The share of the organic market in France purchased by organic regulars averages at 28%, which tends to validate H3. However, this average is heavily influenced by the market values of the products, which strongly differs between product families. For example, the market for organic wine is five times larger than the one of organic broccolis, but the share of the organic market purchased by regulars is only 8% for wine compared to 75% for broccolis. Thus, the size of the market and the unit values of products strongly drive down the average share of the organic market purchased by regulars. Among the detailed results, 40%, 33% and 43% of the organic eggs, organic F&V and the organic milk markets are purchased by regulars, respectively (Table 4).
13
Table 4. Examples of the organic market share represented by regular consumers (exhaustive results are available in SD 2) Share of the consumers Share of organic market Average frequency of organic purchases
Eggs Conventional regulars 85% 10% 2%
Occasional consumers 11% 50% 44%
Organic regulars 4% 40% 92%
Milk Conventional regulars 90% 11% 2%
Occasional consumers 7% 46% 43% Organic regulars 3% 43% 92% Label rouge raw ham Conventional regulars 63% 20% 0.6% Occasional consumers 35% 72% 38% Quality regulars 2% 8% 90%
14
4.2. Determinants of regular organic consumer behavior4.2.1. Product availability and product family are key determinants Table 5.Selected results of the Logit models
Full Logit Full Logit Household Full Logit Products Restricted Logit Restricted Logit Household Restricted Logit Products (1) (2) (3) (1) (2) (3) Hard-discount 0.453*** 0.427*** -0.097 -0.104 (0.063) (0.063) (0.064) (0.064) Hypermarket 0.557*** 0.548*** 0.197*** 0.203*** (0.044) (0.044) (0.046) (0.046) Organic Shop 3.360*** 3.357*** 1.809*** 1.813*** (0.052) (0.052) (0.051) (0.051) Retailer’s brand 0.817*** 0.815*** 0.704*** 0.705*** (0.024) (0.024) (0.027) (0.027)
Price ratio between organic & conventional
0.018 0.017 0.181*** 0.182***
(0.015) (0.015) (0.033) (0.033)
Absolute price difference between organic & conventional 0.031* (0.016) 0.031* (0.016) -0.101 (0.079) -0.101 (0.079) Youngest child <25 month 0.065
(0.078) 0.232*** (0.076) 0.030 (0.074) 0.094 (0.072) Youngest child >11 years and
<15 years -0.072 (0.071) -0.128* (0.069) 0.015 (0.070) -0.022 (0.068) Managers and superior
professions 0.325*** (0.086) 0.315*** (0.085) 0.153** (0.074) 0.205*** (0.073) Manual professions -0.326*** -0.267*** 0.035 -0.052 (0.077) (0.077) (0.069) (0.068) Retired -0.241 -0.223 -0.246 -0.203 (0.192) (0.195) (0.166) (0.168) City of 5000-9999 inhabitants 0.081 (0.119) 0.113 (0.121) -0.012 (0.099) 0.012 (0.099) City of more than 200 000
inhabitants 0.330*** (0.078) 0.335*** (0.079) 0.066 (0.063) 0.158** (0.064) Paris agglomeration 0.191 ** (0.088) 0.180** (0.089) -0.066 (0.071) 0.065 (0.070) Single -0.170*** -0.109** -0.100** -0.130*** (0.053) (0.051) (0.050) (0.049)
High income household 0.109** 0.090* -0.052 -0.027
Low income household -0.183
(0.172) -0.170 (0.174) -0.155 (0.148) -0.111 (0.146) BMI -0.198*** -0.216*** -0.020*** -0.031*** (0.028) (0.028) (0.006) (0.006) Availability 0.335*** 0.340*** 0.574*** 0.576*** (0.016) (0.016) (0.069) (0.069) Baby foods 0.884*** 0.911*** 0.610** 0.634** (0.266) (0.266) (0.287) (0.286) Bread, flour 0.826*** 0.826*** 0.547** 0.547**
15
(0.255) (0.255) (0.274) (0.274) Eggs 2.283*** 2.284*** 1.992*** 1.998*** (0.052) (0.052) (0.058) (0.058) Meat 0.101 0.103 0.198 0.202 (0.128) (0.128) (0.129) (0.129) Milk 2.496*** 2.496*** 2.321*** 2.327*** (0.053) (0.053) (0.060) (0.060) Processed F&V 0.159 0.161 0.381 0.380 (0.256) (0.256) (0.277) (0.277) Starchy foods 0.283 0.283 0.186 0.186 (0.256) (0.256) (0.275) (0.276) Processed Product 0.318 (0.250) 0.317 (0.250) 0.257 (0.269) 0.260 (0.269) Constant -8.753*** -6.666*** -8.276*** -3.569*** -2.223*** -3.397*** (0.174) (0.077) (0.062) (0.161) (0.065) (0.060) Number of households 12453 12453 12453 8854 8854 8854Household random effect’s
standard deviation 2.162 2.222 2.228 1.162 1.174 1.207
Observations 1,221,430 1,221,430 1,221,430 70,549 70,549 70,549
Log Likelihood -47,362 -53,323 -47,493 -31,058 -33,801 -31,084
Akaike Inf. Crit. 94,858 106,714 95,071 62,251 67,670 62,255
Notes: ***, **, *, Significant at the 1, 5, 10 percent levels respectively. The values between brackets refer to the
standard deviation of the coefficients. This table presents a selection of the variables used in the models based on their interests for the discussion. The exhaustive results are available in SM 4.
Retailer’s brand is a dummy that takes the value 1 if more than 50% of the purchases of a product where from the retailer’s brand.
A household of 4 members is considered of low income if its monthly income in under 2094€ and of high income if its monthly income is above 5808€.
Dummy variables Reference level Shop type Open-air market Youngest child No children Working occupation Artisan and craftsman Size of City <2000 inhabitants Economic status Superior middle income Product family Fresh F&V
The logit model on the whole sample (Table 5, model 1) shows that regular organic behavior is more likely to occur when a consumer makes most of its purchases for a given product at a specialized organic store and if he purchases the organic product from the retailer’s brand. The price ratio between the organic and conventional versions of product is not significantly correlated with the probability of being a regular organic consumer while the absolute price difference between the two versions is positively correlated with it: a higher the price
difference is associated with a higher share of organic regulars.
The typical organic regulars are single, without children and have a lower Body Mass Index (BMI), indicating that they have a healthier diet or practice more physical activities. They usually also have a high income, a managerial or superior professions or are own-account workers and live in large cities. However, consumers living in rural areas (reference level) are more likely to be organic regulars than the ones livings in small cities. The logit regressions reveal that some product families are more likely to be purchased by organic regulars than others: baby foods, biscuits, cakes and pastry, bread and flour, confectionary products, desserts, eggs, fat, beverages, meal substitutes, milk, sweeteners, processed F&V and starchy food. The availability of the organic version of a product in the shops the consumers usually visit appears as a significant driver of regular behavior. When using a smaller sample, compound of occasional and regular organic consumers only, the results are similar (Table 5, model 4). Nevertheless, in these restricted logit models, the role of prices differs: when comparing occasional and regular organic consumers, a higher price ratio between organic and conventional
16
products is associated with a higher probability of being a regular consumer whereas the correlation with the absolute price difference becomes non-significant. In addition, in all logit models, the standard deviation of the households’ random effect is high, of comparable size with the largest treatment effect (eggs family), which show an important household-related variability of the probability of being an organic regular.
4.2.2. Products’ attributes matter more than households’ characteristics
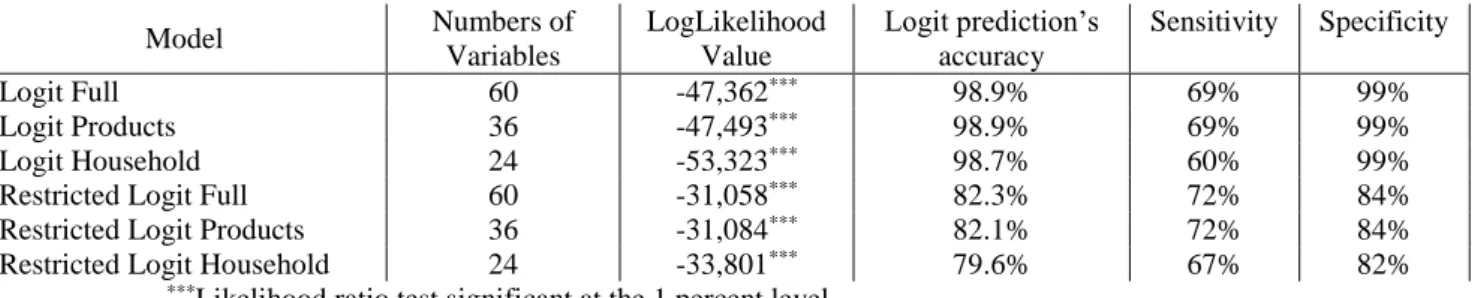
Two other logit models are also computed, one using as predictor variables the information related to the products only (price ratio, frequency, processed or not…) and the other using the information on the household only (number of children, wealth, professional status…). Performing a Likelihood Ratio test, we conclude that the model using product information predicts better the regular consumer behavior (Table 6). These results still stand when using the restricted sample of occasional and regular organic consumers.
Table 6. Likelihood Ratio tests between the models of product attributes and household characteristics, whole sample Model Numbers of Variables LogLikelihood Value Logit prediction’s accuracy Sensitivity Specificity Logit Full 60 -47,362*** 98.9% 69% 99% Logit Products 36 -47,493*** 98.9% 69% 99% Logit Household 24 -53,323*** 98.7% 60% 99%
Restricted Logit Full 60 -31,058*** 82.3% 72% 84%
Restricted Logit Products 36 -31,084*** 82.1% 72% 84%
Restricted Logit Household 24 -33,801*** 79.6% 67% 82%
***Likelihood ratio test significant at the 1 percent level.
5. Discussion
5.1. Strong interrelation between credence and search & experience attributes in determining regular organic consumption.
The first part of this paper, focusing on the bimodality of organic consumption, outlines the product families for which regular consumer behaviors can be found: hot drinks, milk, eggs, baby foods, meal
substitutes, desserts (which include dairy products) and bread and flour (Table 3). The results are confirmed by the logits on regular organic behavior, in which these products families have positive regression coefficients (Table 5). Except F&V and starchy food, these product families are the most purchased ones in the organic market (Agence Bio, 2019a; Hill et al., 2002). Clearly, product availability plays a role: product families that are difficult to find organically in conventional supermarkets (meat or seafood for example) are not dominantly subject to regular consumption behavior: their share of organic purchases is unimodal. Also, the fact that some product families are compound of more products than others (for example, fresh F&V family has 71 products while milk has only two) influence the distribution of organic consumption, as shown in Figure 2. Moreover, the characteristics of organic products (price, quality, availability) likely vary between outlets. Consumers are likely to be influenced by the choice offered at the outlet where they shop most often, which may explain why
consumers who mostly shop at specialized organic shops are more likely to be regulars than those shopping mostly in hard discounts. Moreover, all consumers do not have access to all outlet brands, depending on where they live. The availability indicator that we develop captures this disparity and appears as a key variable in the logit regressions on regular organic behavior (Table 5). Indeed, a lower availability of organic products compared to conventional ones is correlated with a lower organic consumption (Buder et al., 2014; Dimitri and Dettmann, 2012; Massey et al., 2018).
In the same sense, very few consumers are organic regulars for a large number of product categories, as only 6% of them purchase as regular more than 5 product categories and only 0.7% of them have a regular behavior on more than 50% of the products they purchase (Figure 3).
17
Following our theoretical framework, the most likely interpretation of this result is a strong interaction effect between the credence attribute (the product is organic) and the search and experience attributes (the product is an apple) in the consumer’s utility. Most consumer do not value much the organic sign per se, but they value it strongly for a few specific products. Relating that to the dominant health driver of organic consumption (Buder et al., 2014; Padel et al., 2005), a possible explanation is that consumers are mostly concerned about the
healthiness of a few specific products, e.g. because they have seen a documentary on the amount of pesticides in lemon or read a newspaper article on the amount of antibiotics in milk. Accordingly, they may become organic regulars for these specific products, for which they received health information, but this change may not spillover on their broader feeding routines.
However, at least two other reasons can explain this weak consistency of regular behavior across products. The first is again availability, as some products can only be found in specialized shops, but most of the consumers purchase food in several types of shops (conventional supermarket, open air market, specialized shops…). As the logit results show, if a product is mainly purchased at a specialized shop, the probability that the consumers will follow a regular behavior increases drastically. So, as consumers shop in different outlets, even if they choose to be regulars on some products that they usually purchase at their main shopping source, they may have to buy these products in others shops (supplemental purchases, oblivion, unexpected meal to prepare…) but the organic versions of these products may be unavailable, more expensive or of a lesser quality and they will not purchase it. This interpretation is supported by the lower numbers of regulars found when the analysis is based on frequency (number of purchases) rather than volumes (liters or kilograms). Indeed, supplemental purchases weigh more on the shares of organic purchases when computed with frequencies. For the F&V family for example, we find that more households following a regular organic behavior for at least one product when the shares are computed with quantities (1548 households) than in frequencies (1303 households). Similarly, the number of F&V categories purchased by regular organic households is larger when they are computed in quantities (3317) than frequencies (2614).
The second reason is that the data we use is collected at the household level, and even if the main shopper is identified, there can be another shopper (husband/wife, teenagers…) that also sometimes purchases food. This occasional shopper may not have the same purchasing behavior or may not go to the same shopping source, and thus the household may not be regular even though each of its members are regulars of different styles. This effect seems weak however: couples are more likely to be organic regulars than singles (Table 5).
Finally, consumers are more likely to be organic regulars if they purchase products from retailer brands, which are generally cheaper than other organic brands (Ngobo, 2011). However, the price ratio between the organic and conventional version of a product is not significantly correlated with regular behavior, only the absolute
difference in prices is significantly, and positively, associated with regular organic consumption. This surprising result—i.e., the more expensive the organic version of a product is, compared to the conventional version, the more likely the consumer will be an organic regular—can be understood as a weak price-elasticity of regular consumers to organic products prices. Indeed, if a consumer is an organic regular, most likely for health consideration, he will not be as reactive to the relative price of organic products than occasional or conventional consumers. This result is strengthened by the restricted logit models, in which the regression coefficient of the relative price of organic is positive and significant.
5.2. The characteristics of actual organic regulars are similar to those of “declared” pro-organic consumers
The description of regular organic consumers which can be drawn from the logit models is comparable with the main findings of the literature on the socio-economic characteristics of organic consumers (Kesse-Guyot et al., 2013). Indeed, we corroborate that regular organic consumers have a higher income, are more urban and have a higher profession position than non-regular organic consumers (Table 5). Comparing regular consumers with occasional consumers only, we uncover that regular consumers are more represented in the upper-middle class and high professional status (Table 5).
Nevertheless, the comparison of the logit models with product attributes to the logit models with household characteristics only demonstrates that product attributes explain better regular organic behavior than the household characteristics (Table 6).
18
5.3. Public Policy implications: product-specific targetsOf course, what matters most to policy makers is the total amount of organic production produced and sold, relatively to conventional production and the negative health and environmental externalities associated with it. However, an increase of organic production can be reached by sustaining organic consumption, which is currently done by French policies (“Ambition Bio 2022”, “Egalim” law in 2018). Our results from the analysis of organic consumption and their regular behavior advocate for more product-specific policies. Indeed, as much as 28% of organic value is purchased by households with a regular consumption pattern for a few specific products. Accordingly, public initiatives aiming at increasing organic consumption should focus both on promoting the organic label per se and on promoting specific organic products. They may also promote a “regular” attitude towards some organic products—e.g. “remove pesticides from your morning orange juice: buy organic oranges”. Targeting product families for which a regular consumption behavior is already frequent may be particularly promising, as regular organic consumption exists (H1 is validated) but is not yet very consistent across the food basket (H2 is invalidated). This is supported by our finding that product characteristics explain better the regular organic behavior than the household characteristics (Table 6). If there is a choice to be made between targeting specific products or specific consumers, one should go for specific products although some consumer segments—higher income, higher professional status and more urban—are likely to be more receptive (Apostolidis et al., 2016).
Geographical indications and label rouge products on the other hand are purchased occasionally, making them somewhat comparable to luxury products. Marketing and promotion actions for these products may therefore want to get inspiration from non-food luxury products.
19
6. ConclusionThis paper demonstrates that quality-food with similar market shares can be subject to widely different consumption behaviors. Consumption of geographical indications and label rouge is always occasional while consumer attitude towards organic food is often regular: for a given product, some consumers tend to either purchase it always organic or always conventional. Indeed, conversely to previous studies using scanner data or surveys, we use observable information, the distribution of quality purchases, to categorize regular and
occasional quality consumers. Doing so leads to a better comprehension of quality consumers’ behavior, i.e. that an important part (29% of our sample) is regular for at least one organic product, but that regular organic consumers for their whole food basket are scarce. Moreover, regular organic consumers purchase 28% of the total value of the organic market and up to 50% for some F&V, eggs or milk. In this sense, public policies should target product categories instead of the whole food basket and develop organic regular behavior, using as levers the product attributes and household characteristics our analysis revealed as strongly related with regular organic consumption. However, other quality products, such as Geographical Indications, are purchased as extraordinary goods and so policies aiming at increasing their consumption should relate to those on luxury goods.
More precisely, we illustrate that the main product families for which organic consumption distributions are bimodal, i.e. for which regular consumer behaviors can be found, are eggs, milk, baby foods, meal
substitutes, desserts, bread and flour. When organic consumption is analyzed at product level, one sees that its distribution is bimodal also for most fruits and vegetables (processed or raw).
Besides, households which exhibit regular organic consuming behavior are richer, more urban, have a higher profession statute than the others. These organic regulars also have a higher propensity to be in couples and to have fewer children.
The products categories that are consumed by organic regulars are more available and organic regulars do not seem to be influenced by the price of organic products. To the contrary, a higher price difference between an organic product and its conventional counterpart is associated with a higher share of organic regulars, possibly because organic regulars are willing to buy the organic alternative at all costs. Moreover, product attributes explain better organic regular behavior than household characteristics. Further research may explore the interaction effects in the consumer utility function between the organic attribute and other product attributes (thickness of skin for fruits, roots vegetables…). Computing price and income elasticities of quality-food products would also shed light on consumer behavior, especially in defining which products are luxury goods. Lastly, bridging the gap between organic production and consumption may help designing efficient policies: in light of our work, policies could focus on securing the regular consumption of products whose production in organic systems has high environmental or health value-added (production nearby water catchments for example).
20
ReferencesAgence Bio. (2019a). Baromètre 2018 de consommation et de perception des produits biologiques en France. Retrieved from https://www.agencebio.org/wp-content/uploads/2019/02/AgenceBio-DossierdePresse-Barometre2019.pdf
Agence Bio. (2019b). Les chiffres 2018 du secteur bio. Retrieved from https://www.agencebio.org/wp-content/uploads/2019/06/DP-AGENCE_BIO-4JUIN2019.pdf
Apostolidis, C., & McLeay, F. (2016). Should we stop meating like this? Reducing meat consumption through substitution. Food Policy, 65, 74–89. https://doi.org/10.1016/j.foodpol.2016.11.002
Barrena, R., & Sánchez, M. (2010). Frequency of consumption and changing determinants of purchase decision: from attributes to values in the organic food market. Spanish Journal of Agricultural Research, 8(2), 251. https://doi.org/10.5424/sjar/2010082-1178
Baudry, J., Pointereau, P., Seconda, L., Vidal, R., Taupier-Letage, B., Langevin, B., … Kesse-Guyot, E. (2019). Improvement of diet sustainability with increased level of organic food in the diet: Findings from the BioNutriNet cohort. American Journal of Clinical Nutrition, 109(4), 1173–1188.
https://doi.org/10.1093/ajcn/nqy361
Berry, B. Y. S., Levinsohn, J., & Pakes, A. (1995). Automobile Prices in Market Equilibrium. Econometrica,
63(4), 841–890.
Boizot-Szantai, C., Hamza, O., & Soler, L. G. (2017). Organic consumption and diet choice: An analysis based on food purchase data in France. Appetite, 117, 17–28. https://doi.org/10.1016/j.appet.2017.06.003 Buder, F., Feldmann, C., & Hamm, U. (2014). Why regular buyers of organic food still buy many conventional
products: Product-specific purchase barriers for organic food consumers. British Food Journal, 116(3), 390–404. https://doi.org/10.1108/BFJ-04-2012-0087
Chekima, B., Oswald, A. I., Wafa, S. A. W. S. K., & Chekima, K. (2017). Narrowing the gap: Factors driving organic food consumption. Journal of Cleaner Production, 166, 1438–1447.
https://doi.org/10.1016/j.jclepro.2017.08.086
Dimitri, C., & Dettmann, R. L. (2012). Organic food consumers: What do we really know about them? British
Food Journal, 114(8), 1157–1183. https://doi.org/10.1108/00070701211252101
Gracia, A., & de Magistris, T. (2008). The demand for organic foods in the South of Italy: A discrete choice model. Food Policy, 33(5), 386–396. https://doi.org/10.1016/j.foodpol.2007.12.002
Hill, H., & Lynchehaun, F. (2002). Organic milk: Attitudes and consumption patterns. British Food Journal,
104(7), 526–542. https://doi.org/10.1108/00070700210434570
Hughner, R. S., McDonagh, P., Prothero, A., Shultz II, C. J., & Stanton, J. (2007). Who are organic food consumers? A compilation and review of why people purchase organic food. Journal of Consumer
Behaviour.
INAO. (2019). Les produits sous signe d’identification de la qualité et de l’origine. Chiffres-Clés 2018. Retrieved from
https://www.inao.gouv.fr/content/download/3091/28236/version/1/file/INAO_CH_CLE_2019_BD.pdf Kesse-Guyot, E., Péneau, S., Méjean, C., Szabo de Edelenyi, F., Galan, P., Hercberg, S., & Lairon, D. (2013).
Profiles of Organic Food Consumers in a Large Sample of French Adults: Results from the Nutrinet-Santé Cohort Study. PLoS ONE, 8(10). https://doi.org/10.1371/journal.pone.0076998
Lacour, C., Seconda, L., Allès, B., Hercberg, S., Langevin, B., Pointereau, P., … Kesse-Guyot, E. (2018). Environmental Impacts of Plant-Based Diets: How Does Organic Food Consumption Contribute to Environmental Sustainability? Frontiers in Nutrition, 5(February), 1–13.
https://doi.org/10.3389/fnut.2018.00008
Lancaster, K. J. (1966). A new approach to consumer theory. Journal of Political Economy, 74(2), 132–157. Marian, L., Chrysochou, P., Krystallis, A., & Thøgersen, J. (2014). The role of price as a product attribute in the
organic food context: An exploration based on actual purchase data. Food Quality and Preference, 37, 52– 60. https://doi.org/10.1016/j.foodqual.2014.05.001