CONCEPT DEVELOPMENT
AND EVALUATION OF
AIRBORNE TRAFFIC DISPLAYS
Thomas Imrich
June 1971
OF AIRBORNE TRAFFIC DISPLAYS
by
THOMAS IMRICH
FTL Report R71-2 June 1971
A system concept for a cockpit traffic situation display (TSD) was developed and a preliminary evaluation was undertaken to investigate the effect of a TSD on safety, efficiency, and capacity in the 3rd generation NAS/ARTS
ATC system environment. The optimum display configuration, examples
of procedural changes, benefits to the pilot and benefits to ATC are
discussed. The test program was conducted in three phases:
1. Basic tracking tests
2. ATC procedural tests
3. Spacing tests using position command data
Both quantitative and qualitative measures were used for determining safety,
pilot and controller workload, and task performance. A comparison was
made between operations conducted with and without a TSD.
Resultis of the test program were quite promising. Pilot response to the
TSD as a safety device was strongly favorable. In tasks which involved
limited pilot participation in the ATC control process, improvements in spacing accuracy and a decrease in communications at satisfactory pilot
workload levels were demonstrated. Initial results indicate that additional
research to fully explore the potential of TSD's should be undertaken at the earliest opportunity.
The author wishes to thank the many people whose support made this thesis
possible. Special thanks are due Professor Robert Simpson, my thesis
advisor, Messrs. R. Anderson, R. Fitch, and R. Rausch for months of computer programming at all hours of the day and night, Mr. Mark Connelly (project director) for assistance in the design and construction of the cock-pit simulation, and Joe Tymczyszyn for the endless ATC discussions which contributed to the formulation of the concepts presented in this thesis. Finally,I am most grateful to my father, Captain S. T. Imrich, whose com-ments based on many years of airline flying experience, served as the inspiration for this work, and my wife, Dee, for constant support and patience.
The author also wishes to acknowledge the following members of the M. I. T. and aviation community who have offered assistance in this project:
Mr. L. Day Mr. T. Dickenson Mr. L. Elberfeld Capt. J. Harkin Prof. W. Hollister Mr. J. Howell Mr. R. Hutchinson
Capt. S. Imrich Subjects
Capt. E. Lincoln Mr. A. Perciballi Mr. J. Ryan Prof. R. Simpson Capt. S. Stiles Prof. K. Thomassen Mr. J. Tymczyszyn
Captain S. Stiles and many other EAL, AL, TWA, PAA, AA, NE, USAF and USN pilots
Prof. W. Hollister - Measurement Systems
Laboratory Advice and
Prof. R. Curry - Man Vehicle Laboratory Comments
Dr. A. Natapoff - Man Vehicle Laboratory
Dr. H. Weiss - Lincoln Laboratory
Mr. Mel Stone - Lincoln Laboratory
Dr. R. Bush - Lincoln Laboratory
Mr. J. Hatfield
Mr.
R.
Carr
Cockpit Construction
Mr. C. Collins and Draper Laboratory Flight Facility
Boeing Company - donation of Cockpit shell and
technical support
McDonnell Douglas - technical support
Collins Radio Company - technical support
This research was sponsored by the M.I. T. Lincoln Laboratory under DSR No. 72487.
page
CHAPTER I INTRODUCTION 11
1. 1 System Concept 11
1.2 Hardware Description 13
CHAPTER II CONCEPT DEVELOPMENT AND EVALUATION 16
2.1 Goals 16
2.2 Display Configuration 17
2. 3 Display Controls 21
2.4 Map Information 24
2. 5 Channel Selection 27
2.6 TSD Benefits to the Pilot 28
2.7 TSD Benefits to ATC 34
CHAPTER III THE EXPERIMENTAL PROGRAM 38
3.1 Description of Simulation Facility 38
3.2 ATC Environment 43
3.3 Description of Test Cases 43
3.4 Subject Pilots 43
3. 5 T raining 47
3.6 Data Acquisition and Processing 50
CHAPTER IV TEST RESULTS AND DISCUSSION 53
4.1 Basic Tracking Tests 53
A. Test Case 1 53
B. Test Cases 2 and 3 55
4.2 ATC Procedural Tests 57
A. Test Case 4 64
B. Radar Vector Comparison Test 67
C. Test Case 5 72
D. Test Case 6 73
E. Test Case 7 81
F. Test Case 8 84
4. 3 Position Command Spacing Tests 89
A. Test Case 9 89
CHAPTER V SUMMARY AND RECOMMENDATIONS 5. 1 Summary of Conclusions
5. 2 Implications to ATC Capacity
5. 3 Recommendations for Further Study
REFERENCES BIBLIOGRAPHY page
98
98 100 101 104 105page
1.1 Traffic Situation Display System Diagram 14
2. 1 Traffic Situation Display and Control Panel 18
3.1 Simulation Facility Block Diagram 39
3.2 Cockpit Simulator 40
3.3 Interior View of Cockpit 40
3.4 Radio Navigation Chart for the Boston Area 44
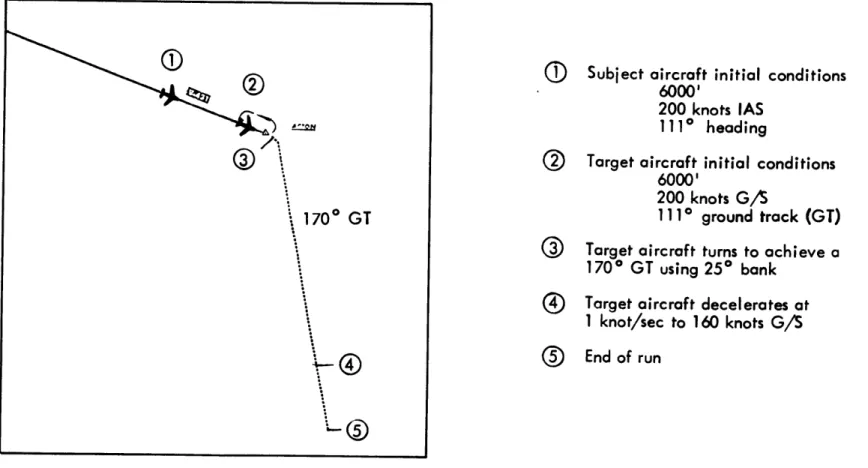
3. 5 Target and Command Bug Profiles 46
4.1 Case 2 and 3 Target Profiles 58
4.2 Case 2 Track Plots 60
4.3 Case 3 Track Plots 62
4.4 Case 4 Layout 66
4.5 Case 4 Track Plots 69
4.6 TSD STAR Procedure Tested in Case 5 74
4.7 Case 5 Track Plots 76
4.8 Case 6 Layout 78
4.9 Case 6 Track Plots 80
4.10 Case 7 Track Plots 83
4.11 Case 8 Layout 85
4.12 Case 9 Layout 90
4.13 Case 9 Track Plots 93
4.14 Case 10 Layout 94
4.15 Case 10 Track Plots 96
page
2.1 Results of Display Survey 25
2.2 Recommended Graphic Map Data 26
2.3 Recommended Alphanumeric Map Data 26
2.4 Proximity Awareness and Collision Avoidance Survey Results 33
2.5 Display Misuse and Abuse Survey Results 35
2.6 Safety Survey Results 35
2.7 Pilot Opinion of TSD Merit in Visual Approach Situations 37
3.1 Simulator Evaluations 41
3.2 Software 42
3.3 Test Case Summary 45
3.4 Subject Pilot Flight Experience Summary 48
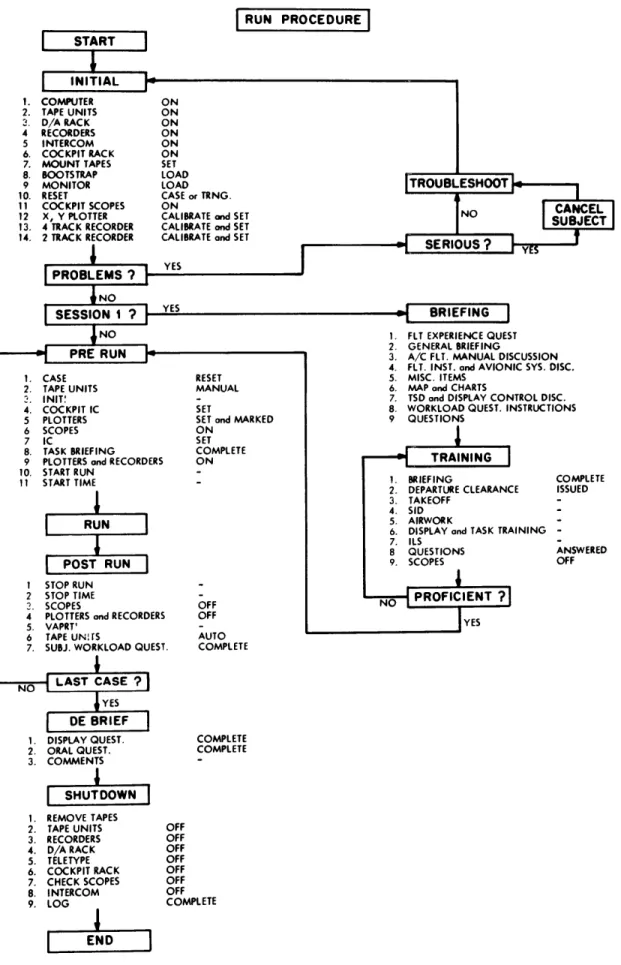
3. 5 Run Procedure 51
4.1 Case 1 Results 54
4.2 Response of Subject Pilots to Workload Questionnaire - Case 1 56
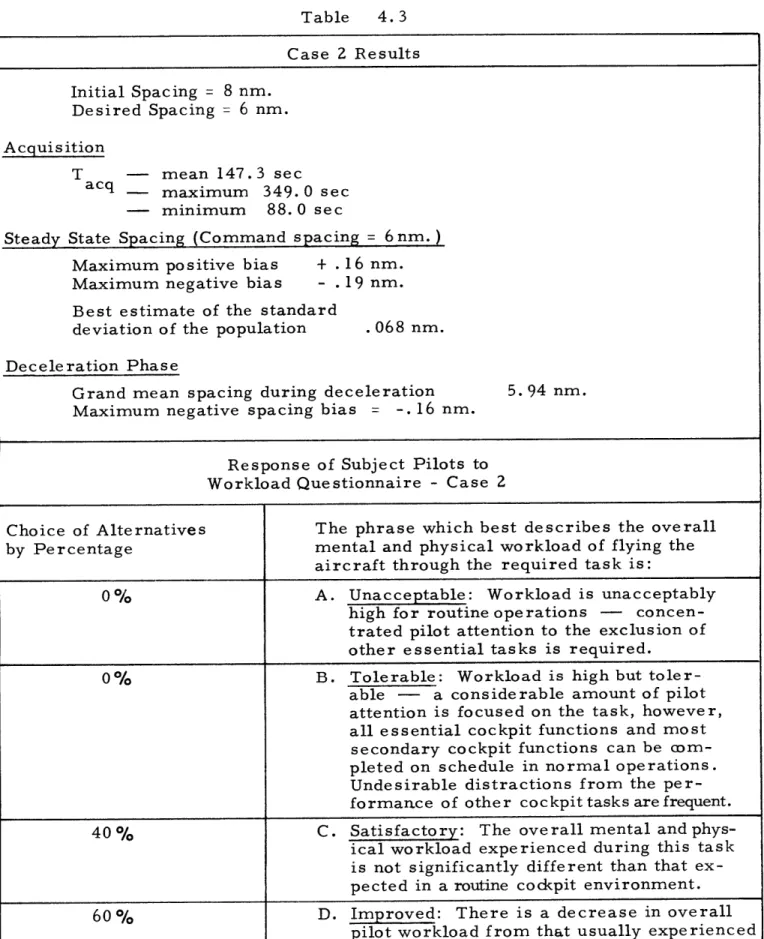
4.3 Case 2 Results 59
4.4 Case 3 Results 61
4.5 Case 4 Results 68
4.6 Comparison of Spacing Performance and Communications
with and without TSD 71
4.7 Case 5 Results 75
4.8 Case 6 Results 79
4.9 Case 7 Results 82
4.10 Case 8 Results 87
4.11 Case 8 Comment Summary 88
4.12 Case 9 Results 92
4.13 Case 10 Results 95
ADF ARTCC ARTS ASDE ATC ATIS ATR CAS CAT II CF1-A-I COMML CRT CWS D/A DOT DME EPR FL GT HSI IFR IAS ILS
Low frequency navigation aid (automatic direction finder) Air route traffic control center
FAA terminal area data automation program
Airport surface detection equipment Air traffic control
Automatic terminal information service Airline transport pilot rating
Collision avoidance system
Second stage of FAA low visibility landing program
-permits landing operations down to 1200 ft visibility Ce rtified flight ins tructo r- airplane -instrument
Commercial pilot rating Cathode ray tube
Control wheel steering Digital to analog
Department of Transportation Distance measuring equipment Engine pressure ratio
Flight level Ground track
Horizontal situation indicator Instrument flight rules
Indicated airspeed
INST Instrument rating
NAS FAA enroute data automation program
PWI Proximity warning indicator
R-NAV Area navigation
SEL Single engine land rating
SELS Single engine land and sea rating
SID Standard instrument departure
SMEL Single and multi-engine land rating
STAR Standard terminal arrival route
TRACON Terminal radar approach control
TSD Traffic situation display
TVOR Terminal VOR
VFR Visual flight rules
VOR VHF navigation facility
(VHF omnidirectional range)
R st Range between subject and target aircraft
Tacq Time to acquire 90% of the required spacing
AV g/ Velocity difference (based on ground speed data)
VIAS Indicated airspeed
CMD
CWS
pitch commandOCMD CWS roll command
Standard deviation
A key for interpretation of symbols used in radio navigation charts may found in Reference 4.
INTRODUCTION
Major changes in the air traffic control environment must occur during the next decade if aviation's growing needs are to be met. Many of the present weaknesses in the ATC system will be addressed as planned additions to the national airspace system, such as improved surveillance, area navigation, microwave landing systems and data links are introduced
into service. However, it still appears that these systems will not com-pletely solve the problems of capacity, safety or workload. Additional
means will have to be found to augment performance of the basic ATC system. Present efforts to meet this need are concentrating on development of
ground-based, computer-assisted spacing techniques, collision avoidance or proximity warning devices, upgraded beacon surveillance capability and a variety of other systems.
1. 1 System Concept
One concept for increasing performance and safety within this ATC environment, which has received little attention, is to provide aircraft with cockpit displays which present traffic information in a format useful to the pilot. The purpose of a traffic situation display (TSD) is to extend the visual senses of the pilot in such a way that operations could be conducted in instrument conditions in much the same manner that IFR operations are presently
conducted in good weather. Through such a system, high capacity
pro-cedures,similar to visual approaches or vectors to the traffic pattern, could be employed in any type of weather and much of the capacity which is presently lost when weather is bad could be recovered. Such a display
-would serve to tighten the aircraft-pilot-ATC control loop so that response time to clearances or emergencies could be reduced thus permitting
in-creased safety at reduced lateral or longitudinal separations.
TSD' s potentially can play an important role in central,
cooper-ative, or distributed management ATC systems. The utility of a traffic
situation display need not be limited to a particular ATC concept. Simi-larly, the benefits do not specifically depend on the character of the data acquisition system. Either ground derived and processed ATC data which is transmitted to the aircraft, or airborne sensor data could be used to generate a TSD picture. If ATC processed data is used, any one of a variety of surveillance systems ranging from ground radars to satellites may serve as the basic input.
Since, however, the basic configuration of ATC for the coming decade has been established, present research has been directed toward investi-gation of the use of traffic situation displays within the ground based,
centrally managed, third generation ATC system. A TSD is not intended to provide "self contained" air traffic control capability. It, also, is not en-visioned as a substitute or replacement for any particular instrument or system. Rather, it may serve as a device to enhance the capability of CAS, PWI, computer spacing or other systems.
The concept of providing traffic information in the cockpit has been proposed in various forms for many years. However, it has been only recently that advances in technology have made its construction at a rea-sonable cost, feasible. Accordingly, this thesis attempted to reexamine the concept of a TSD. The three main research objectives were to:
1. Outline a system concept for providing a sectorial display of traffic in the cockpit,
2. Specify the parameters which should be considered in the design of the cockpit display, and
3. Evaluate the potential of a TSD for improving safety, efficiency or capacity in the NAS/ARTS ATC
environment.
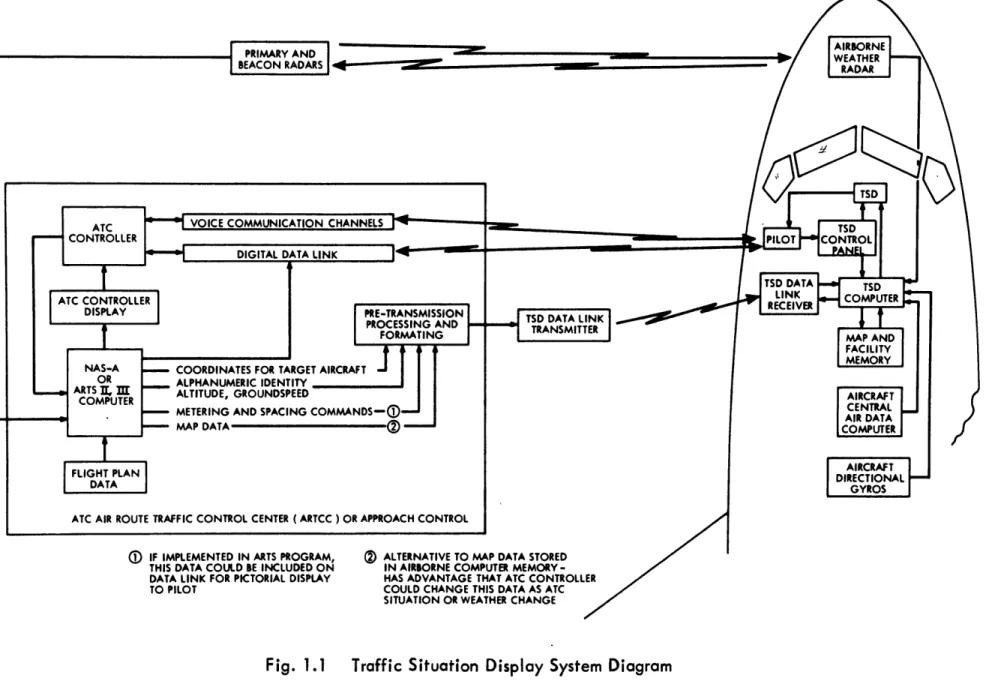
1. 2 Hardware Description
A functional diagram showing the ground and airborne hardware
associated with a NAS/ARTS based cockpit traffic situation display system is shown in Figure 1. 1.
Primary and beacon surveillance radars provide basic data to the computers in the air route traffic control centers and approach controls. This basic data is processed along with flight plan information and used to
generate the ATC controllers displays. With limited reprocessing and
formatting, portions of this basic data could be broadcast on a common radio frequency to aircraft within the facilities area,to serve as the data base for a cockpit traffic situation display. Transmission would be via VHF digital data link. Studies indicate that the data required to service
100 aircraft in a terminal environment could be handled by an 8 kilobit/second
t ran s m i s s ion rate. This would provide a complete traffic picture including target positions, identifications, altitudes (for mode C beacon equipped aircraft), selected map information, and ground weather radar
contours (if desired) every four seconds. This data rate can be
accom-modated in a 25 KHz VHF channel.
Aircraft equipped to receive the data link broadcast would use a small airborne computer to select appropriate information from the data stream, process the data according to the settings on the pilot's display
ALPHANUMERIC ALTITUDE, GROU
METERING AND MAP
DATA-IF IMPLEMENTED IN Al
THIS DATA COULD BE
DATA LINK FOR PICTO
TO PILOT
IDENTITY
NDSPEED AIRCRAFT
SPACING COMMANDS-r- CENTRAL
AIR DATA COMPUTER
AIRCRAFT DIRECTIONAL
GYROS :NTER ( ARTCC ) OR APPROACH CONTROL
RTS PROGRAM,
9
ALTERNATIVE TO MAP DATA STOREDINCLUDED ON IN AIRBORNE COMPUTER MEMORY
-RIAL DISPLAY HAS ADVANTAGE THAT ATC CONTROLLER
COULD CHANGE THIS DATA AS ATC SITUATION OR WEATHER CHANGE
controls, and generate the TSD picture. Other inputs to the TSD computer would be:
1. Aircraft heading from the directional gyros
-used to orient display.
2. Memory data - used to generate portions of the
background map which do not change frequently, also stores data link frequencies for automatic switching, etc.
3. Airborne weather radar system signals
-processed and displayed on TSD at the appropriate range scales.
4. Central air data computer (CADC) signals
-provides own aircraft's altitude, velocity, identification, etc.
Inputs from airborne vortex turbulence sensors or clear air turbu-lence detectors could be included on the TSD as they become available. If beacon surveillance system coverage is extended to the airport surface and appropriate data is fed to the ARTS computers, TSD systems could
provide a continuous display throughout the complete final approach, landing, and taxi. Such capability could be achieved by adding airport surface detection
radar (ASDE) or other sensor inputs to the ARTS computer data base.
An additional feature which could be included in a TSD system is the uplink of graphical controller instructions. Through the use of a light pen
or keyboard,controllers could draw vectors on their own display scopes representing nominal path or amended routings and have these simulta-neously transmitted to all or selected aircraft in the system. This capa-bility could add significantly to the flexicapa-bility of the ATC system. It would give the controller a powerful tool to deal with perturbations in the ATC system due to emergencies, weather, or other disturbances.
CONCEPT DEVELOPMENT AND EVALUATION
2.1 Goals
An experimental program was undertaken to investigate some facets of the traffic situation display's potential contribution to ATC safety, effi-ciency and capacity. The objectives of the program were to evaluate a TSD in a realistic environment through simulation in order to:
1. Optimize the display configuration.
2. Determine non-procedural potential benefits of a TSD
to both pilots and ATC in the NAS-A/ARTSIII environ-ment.
3. Test and evaluate certain new ATC procedures based on
a TSD which could increase efficiency and capacity of
the ATC system. This is described in Chapter IV.
From the outset, it was realized that evaluation of non-procedural benefits of a TSD, such as pilot assurance and safety,would be difficult. Quantitative measures for these factors do not exist. Pilot assurance is often attributable to the existence of alternative courses of action. A feeling of safety is based on a pilot'Ls confidence in the ability to maneuver his air-craft to successfully cope with unusual or emergency situations. If a TSD can clearly define existing alternatives or provide new alternatives, pilot assurance and subjective assesment of increased safety will probably result.
Rigorous treatment of this question requires extensive operational
experience in an actual flight environment. However, it appears feasible to
survey this field by using simulation and qualitative measures.
To enable pilots to evaluate a TSD's non-procedural benefits, a set of cases was devised which would both give pilots experience using the display
-16-and a chance to build confidence in its capabilities. Subject pilots qualitative evaluations were the primary source of data for this section. Questionnaires were used extensively and subject impressions and comments were solicited
throughout the test program. Pilot extrapolation of simulation experiences to
the real world was encouraged.
Evaluation of new procedures was accomplished in both quantitative and qualitative terms. The results are described in Chapter IV.
Experiments were designed to consider a broad range of applications of a TSD rather than exhaustive study of a particular area. An attempt was
made to use experiments which would identify the areas of application for a TSD which appear most promising for further research.
2. 2 Development of Display Configuration
To provide maximum benefit to the pilot, particular attention must be devoted to design of TSD format and content. Information on a TSD must be useful, appropriate to the phase of flight,and easy to intepret. Display clutter should be kept to a minimum. TSD controls must provide the
neces-sary flexibility without being too complicated or confusing.
A desirable TSD configuration from a pilot's point of view was determined
through experimentation with many display and control options in a simulated flight environment. The final configuration for display format and for the display control panel used in these tests is shown in Fig. 2.1.
Because the standard frame of reference used by pilots for orienta-tion is based on aircraft axes, it was decided that the TSD picture should be oriented in such a way that up on the display corresponds to aircraft heading. This enables pilots to interpret azimuth data in terms of the "natural"
co-ordinate frame of clock positions or relative bearing. The experimentation
If a fixed, north up oriented display is used, map data can be inter-preted normally but correlation of display data with outside references is much more difficult. If the fixed, north up display is used for maneuvering, information regarding other aircraft bearing and heading is often
misinter-preted. Disorientation may occur when flying south while using a north
oriented map.
Rotation of the map with respect to aircraft heading should be
con-tinuous as the aircraft changes heading. The map should translate with
respect to the subject aircraft's position. This results in the symbol for the aircraft being always fixed in the same position on the display while the background map and targets translate as the data is updated. If no position
smoothing between updates is used,translational jumps of the background map and traffic occur due to the radar scanning rate. The following confi-gurations of update rate and smoothing were tested and found satisfactory:
1. continuous translation of map and targets
-(corresponds to predicting and smoothing of data received at the 1 or 4 second update rates.)
2. 1 second map and target translation update
-(corresponds to increased data rate of advanced surveillance systems. )
3. 4 second map and target translation update
-(corresponds to updating the data for each radar antenna sweep.)
Continuous translation, as may be expected, was the preferred
confi-guration. However, it appears that pilot acceptance and performance are
relatively insensitive to update rate as long as the magnitude of the jumps are small compared to the physical size of the display at the range scale which gives the largest resolution (the smallest number of miles per inch on the scope). Pilots generally felt that the 4 second jumps were quite acceptable.
In fact, in some circumstances,the jumps are desirable because relative
motion is easier to perceive. With continuous translation, targets must
be watched closely for a few seconds to note the direction and magnitude of translation relative to own aircraft. (This effect must be distinguished from translation relative to a ground reference frame which is determined from observing target heading or ground track. )
Since more viewing range is preferred ahead of the aircraft than behind, the subject aircraft symbol was placed so that 2/3 of the available display range was forward and 1/3 after.
Scope size is determined by overall legibility in representative con-gested traffic situations, resolution capability in terms of nautical miles of viewing range per inch of display scope at the minimum range scale, alpha-numeric character size and availability of space in transport aircraft
cock-pits. Although experimentation showed that performance was not significantly
degraded when using small display scopes, 2 pilots expressed a strong pre-ference for the larger versions. The final choice of display scope size was 7 1/4" high by 7 1/4" wide. It was felt that this size display was the largest
which could easily be accommodated in present generation transport aircraft and about the smallest scope that pilots could readily interpret without com-plaint.
The traffic situation display was tested in the weather radar scope's present position because this space represents the most likely area in which a TSD would initially be tested. Pilot comments indicated that as vertical tape instruments are introduced for systems instruments and as more space becomes available in the newer generation aircraft cockpits, the TSD should be moved closer to the primary flight group instruments.
Eventually, traffic information such as provided on the TSD may be incorporated in advanced flight instruments as part of a CRT pictorial situation indicator which also includes gyro data, area navigation displays,
moving map,and weather contours. Such a display would replace a number of
instruments currently used and would be located in the general area now occupied by the horizontal situation indicator (HSI).
2.3 Display Controls for the TSD
The TSD control panel was designed with the intent of giving the pilot a large measure of flexibility in using the display without making the TSD
controls functions unnecessarily complicated. An attempt was also made
to provide a means to keep scope symbol clutter to a minimum.
The final version of the display control panel has provisions for range selection, alphanumeric tag selection, altitude reporting beacon dis-crimination, and an altitude band selector.
Range scales from 4 nm.to 160 nm.forward viewing distance can be selected as appropriate to the phase of flight. The 4 nm.scale is useful for precise maneuvering with respect to other aircraft and for monitoring clo se late ral and longitudinal separations. The 8 and 16 nm. s cale s are
primarily used for coarse maneuvering in the terminal area. The 32 nm.
scale provides a convenient display of the overall terminal area traffic situation. Larger scales, in general,are useful for monitoring high altitude enroute traffic situations, traffic detours around significant weather and gross views of terminal area traffic congestion.
The 8 nm.forward range scale seemed most appropriate for collision threat detection in terminal areas. If targets closed less than 4 nm., range
scale was decreased to get a better view of the threat. Frequently,when short range scales were being used, pilots would momentarily select a larger range scale to get an overall traffic picture, then return to the
original scale. Enroute, much greater range scales were used, depending
on desired warning time with high closing speeds. To eliminate parallax,
range rings were included on the CRT through software. To minimize
distraction, range rings were displayed at a lower intensity than other
features of the display. For some tasks,it is desirable to provide a variable range cursor which can be digitally set to an arbitrary mileage value. This eliminates the necessity for interpolation between range rings and increases the accuracy of reading the display if non-integer ranges were to be used for such tasks as maintaining spacings behind other aircraft.
An altitude band selector is used to restrict the display of targets to those within an altitude band of interest to the pilot. The vertical extent of this altitude band is adjustable by the pilot. The band is defined with
respect to the subject aircraft. If the subject aircraft climbs or
de-cends,targets will appear as they enter the band and disappear as they exit the band. For example, an aircraft at FL350 with TSD altitude band selector
set at 2000' above and below would see only those targets which are at
alti-tudes between FL370 and FL 330. Targets above and below this range would
not be displayed unless the subject aircraft climbs or descends. This feature greatly reduces scope clutter by restricting the number of targets which are displayed at a particular time. In rapid climbs or descents, pilots would generally set the controls so that adaquate altitude coverage would be provided to protect against aircraft "popping up" nearby without sufficient warning. The extent of altitude protection was based on rate of climb/descent, the
number of targets in the area,and the amount of advance warning which the pilot desired. Since the altitude discrimination capability is applicable only to
targets which have altitude reporting transponders or have flight plan data recorded in the ground computers, a control has been provided to eliminate targets for which altitudes are unknown. This feature could be used to elimi-nate these targets from the display when the subject aircraft is operating in
positive control airspace. This feature would be most useful for eliminating
primary and VFR beacon targets from the display when the subject aircraft is operating at high altitudes.
The set of alphanumerics associated with a traffic display which
is useful to the pilot is limited to: (1) radar-track-based ground speed,
(2) identity, (3) altitude and (4) target aircraft track. Track information
should be displayed through directional symbols or past position tracers. The directional symbols give a less cluttered display,but tracers give an analog presentation of velocity through the spacing of the individual dots of the trace. The best configuration appears to be use of both directional symbols and tracers, with the option of eliminating tracers if the display becomes too cluttered.
Alphanumeric tag clutter is kept at a minimum by use of on-off switching. This permits pilots to display only information which is per-tinent to the phase of flight. It was found that the alphanumeric speed tags
were displayed most of the time. When large numbers of targets were
present on the scope, identity tags were usually displayed only for initial identification of a particular target. Display of altitude tags largely depends on congestion and the phase of flight. It is felt that additional data relating to target aircraft will have little additional benefit considering scope clutter
and pilot interest. Elimination of any of the features which have been outlined (for cost reasons or otherwise) will definitely decrease the utility of the
display from a pilot acceptability or performance capability point of view. After completing the test program, subjects were given a question-naire which considered physical characteristics of the display. The results are shown in Table 2.1.
2.4 Map Information for A TSD
Although not intended as an area navigation display, a TSD should
include limited map information. A basic map serves as a reference frame
for evaluating target information. Much lead information is gained on target
behavior by observing target progress relative to airways, nominal approach routes, navigation facilities or waypoints. This is especially true for targets which are maneuvering in the terminal area.
It is felt that the following four options should be provided as the basis of the map display.
1. high level airways,
2. low level airways,
3. terminal area arrival routes (STARS + Transitions), and
4. terminal area departure routes (SID's + Transitions).
A map, appropriate for the particular phase of flight, should be select-able at the pilot's discretion. Data which should be included on each of the four maps is listed in Table 2.2.
Although much information regarding obstructions, restricted areas, noise abatement procedures etc. could be included on the display, it is felt that information in addition to that listed in Table2.2would be of limited value in conventional IFR operations.
Table 2.1
Results of Display Survey
Response to Alternatives By Percentage
1. Display scope size was:
00/0 A. too small
100/a B. about right
0% C. too large
2. Location of the display (position in cockpit) is:
70 */o A. satisfactory
30/a B. should be closer to primary
flight instruments
3. Overall readability of scope (alphanumeric symbols,
clutter, orientation, intensity) was:
77% A. good
23% B. acceptable
0% C. poor
4. Display controls panel is:
93% A. useful and easy to understand
0% B. useful but confusing
Table 2.2
Recommended Graphic Map Data
Symbols to be included on high level and low level maps:
- airway centerlines
- key navigation facilities and waypoints
-- delay and holding fixes
Symbols to be included on terminal area arrival and departure routes.
- SID's and transitions (departure)
- STAR's and transitions (arrival)
- key navigation facilities and waypoints
(arrival and departure)
- holding fixes (arrival)
- primary airport symbols which include runway
orientation. (arrival and departure)
- final approach course for ILS, VOR, ADF or
R-NAV approaches including initial and final approach fixes
- missed approach routings (approach)
A feature which should be included on the display is the ability of the
pilot to control alphanumeric selection of map data. A set of controls should
be provided to permit selective display of identification tags for items listed in Table 2.3.
Table 2. 3
Recommended Alphanumeric Map Data
ITEM EXAMPLES
- ai rways and procedures J 121 ACTON ONE ARRIVAL
- key waypoints and fixes MILLIS BOS
- important inbound/outbound
Identification tags enable the pilot to positively identify routes, pro-cedures and fixes so that proper correlation with enroute and approach charts can be accomplished.
Every effort should be made to ensure simplicity and freedom from clutter in the design of the map features of this display.
TSD maps at this time should not be designed to replace enroute
radio charts and approach plates as a source of information regarding radio frequencies, procedures, minimum enroute altitudes, obstructions and the numerous other details which are required for IFR flight.
Map data can be provided in several ways including storage in an airborne computer memory or transmission via the TSD data link.
If possible, the CRT used for the TSD should be able to display weather radar data from either airborne or ground equipment.
2. 5 Channel Selection
Regardless of which map, traffic, or alphanumeric options are in-cluded on a TSD, efforts should be made to keep cockpit workload associated
with management of a TSD at a minimum. Station or channel selection
methods must be chosen carefully. Most likely, a method will be needed to
automatically control TSD frequency selection. The following alternatives
are suggested.
Data link frequencies could be preprogrammed before takeoff, as is presently done with waypoint selection on inertial navigation systems,
and changed in flight by an execute command entered manually. Alternatively, the execute commands could be coupled with navigation or communication frequency selection. As a predetermined frequency for navaid was selected,
the TSD would automatically switch channels to the preprogrammed frequency which corresponded to the navaid which was chosen. Another method of
switch-ing would make use of paired radio frequencies. The same procedures which
are applied to DME channels being associated with VOR frequencies for auto-matic switching, could be applied to TSD control. In this case, TSD frequencies would be matched with navigation or communication frequencies so that selec-tion of a nav/com frequency would automatically control TSD staselec-tion selecselec-tion. If communication frequency pairing is used, an appropriate ARTS TSD data channel would be provided when approach or departure control frequencies were selected, and NAS TSD data channels would correspond to ARTCC sector
frequencies. In navigation frequency pairing,enroute H or L class VOR
fre-quencies would be paired with NAS TSD channels and TVOR, ATIS, or ILS frequencies could be paired with appropriate ARTS channels.
2.6 TSD Benefits to the Pilot
At present, pilots construct a mental image of the traffic environment from information received through radio communications, visual scanning for other traffic, knowledge of standard procedures, and previous
ex-perience. A pictorial situation display provides this traffic information
to the pilot at a glance. The uncertainty and ambiguity associated with mentally synthesizing a time varying traffic situation is largely eliminated. Unlike the information received through present sources, data from a TSD is available whenever a pilot needs it.
Positive and continuous indication is given when adequate
sepa-rations between aircraft exist. A TSD provides assurance to the pilot
will become increasingly important as new procedures are introduced which greatly reduce lateral, longitudinal and vertical separations between air-craft.
Through the advanced cues which a TSD provides, a crew can plan
farther ahead and make better decisions. Flap schedules, pressurization
regulation, completion of checklists and many other items can be more
appropriately timed. A picture of the overall traffic situation can provide an indication of when pilot requests for direct routings, altitude changes, detours
etc., can or cannot be approved. If ground or airborne weather radar data is included on the TSD, pilots will be able to monitor weather detours of
other aircraft. Cooperation between pilots in a heavy weather area can lead to a better choice of alternate routes for all aircraft involved. Also, by
seeing the overall traffic situation, weather deviations can be chosen which will both satisfy weather avoidance criterion and keep disturbance of the traffic flow to a minimum.
Reaction times in an emergency situation can be greatly reduced by a TSD. Response to a "surprise" clearance resulting from an airborne or ground emergency sometimes requires time consuming preparation, espe-cially if aircraft configuration changes are involved. A TSD can take away
the surprise in most situations because a pilot can detect the earliest deviations from the normal. The traffic situation can be continuously monitored in
parallel with the air traffic controller. By careful observation of the TSD,
pilots can be alerted to unusual or potentially threatening situations much
sooner than can now be expected. Through this advanced notice pilots can
be awaiting an amended clearance and preparations to execute that clearance can be initiated much sooner. A TSD would be particularly useful for monitoring
aircraft on parallel ILS approaches. In the event that a nearby aircraft unexpectedly deviated from its intended course, the TSD would provide timely warning that a conflict was developing before the situation became critical. The pilots would have a source of information for evaluating the threat, considering alternative courses of action and accomplishing an evasive maneuver in the event that a clearance which resolved the issue
was not forthcoming. If an emergency clearance or collision avoidance
instruction was issued by ATC, the pilots would have an indication of the urgency of the situation by being able to see the reason for the clearance. When certain types of ATC failures occur, such as loss of a radio communications channel during radar vectors, a TSD can offer an added margin of safety or even an avenue of escape by showing potentially con-flicting traffic. If the controller's intentions were known, appropriate maneuvering for landing could be continued until a workable frequency was found.
A traffic situation display provides the pilot with a means to cross check the validity of an ATC clearance. Altitudes, routings, headings and speeds can be evaluated in the context of the traffic situation. In cases where many aircraft are being handled, clearances are being transmitted at a high rate and reception is garbled. Messages can be misdirected to
air-craft or accepted by incorrect airair-craft. Pilots are often the first to discover such inconsistencies. A TSD will better enable pilots to identify inappropriate clearances and it will provide assurance when proper clearances are issued.
Providing data on the surrounding traffic environment will be espe-cially important if dependence on voice communication channels is reduced due to introduction of the digital data link. Radio channels enventually are to
be used in a backup mode which will provide little information about clear-ances to other aircraft. A TSD can restore the pilotbs image of the surrounding traffic environment which otherwise will be lost as voice communications
are phased out.
A TSD can contribute to increased safety by providing proximity
awareness information. Current ATC practices provide traffic advisories
to pilots of certain VFR and IFR aircraft on a controller-workload-permitting basis. Range, azimuth,and altitude (when known) are "called" at various warning distances varying from about 8 miles to 1 mile. The amount of warning distance or time given varies with closure speed, anticipated miss distance, assumed target altitude, visibility and many other parameters. Considerable variation of criterion and limits has been observed among controllers within a particular facility and between facilities.
Due to the controller's inability to accurately determine aircraft head-ing, the azimuth component of a radar traffic advisory is frequently found to
be in error. Errors of +600 are typical and errors as large as +1200
sometimes occur. When traffic is heavy, advisories are sometimes given
only at very low range values or not at all, particularly if an unidentified target is believed to be at an altitude above or below the subject aircraft.
A TSD provides the pilot with a continuous display of information with
predictable quality. Because own aircraft heading data is used to orient the TSD, target azimuth will have better accuracy than can be expected with
radar advisories. The progress of an approaching aircraft can be monitored
on the TSD until the target is within visual range. The pilot can then con-centrate his outside traffic search in the specific area indicated by the TSD.
By monitoring the TSD,pilots can become aware of traffic long before a threat develops. A small path correction which is made while a target is far away may eliminate the need for large corrections or evasive maneuvers.
At present,it is not envisioned that TSD's will take the place of col-lision avoidance (CAS) or proximity warning (PWI) systems. However, it
does appear that TSD's can contribute to their effectiveness. When used
with a CAS, a TSD can provide confirmation of maneuver commands. The
pilot of an aircraft which receives an instruction for a collision avoidance maneuver will, through knowledge of the evolving traffic situation, be able to see:
1. that a threat actually exists,
2. that the sense and magnitude of the command are correct, 3. if the other aircraft is responding and
4. if the maneuver instruction is likely to cause further conflicts.
TSD's can be used in conjunction with PWI systems to determine and carry out acceptable responses to collision threats.
Subject pilot opinions regarding the effectiveness of a TSD as a prox-imity awareness device are summarized in Table 2.4.
When operations are being anducted in certain types of instrument weather condition such as "in and out of clouds", near sloping cloud decks, or at night, visual illusions regarding adequacy of separation can occur. A traffic situation display can assist the pilot in combatting these erroneous sensations by removing the element of surprise. By keeping the pilot aware of location, altitude and heading for nearby aircraft, visual illusions and potential threats can be more readily identified.
Table 2.4
Proximity Awareness and Collision Avoidance Survey Results Percent Response for
Each Alternative
Opinion Sc ale
Pilots rated statements 1 through 4 with the opinion scale shown at the left
93% Agree 1. A TSD will assist in sighting other
7%C
Mostly Agree aircraft because it will show thepilot where to localize and
concen-Neutral trate his search and when it is
Mostly Disagree necessary to look outside.
Disagree
7%
Agree 2. A T SD will direct the pilots attention23%C~ Mostly Agree inside the cockpit to the point that traffic scan will be degraded and
7%
Neutral possible threats will be missed.7%C
Mostly Disagree5 6% Disagree
Agree 3. A TSD will degrade the pilots
7%E
Mo stly A gree search for traffic because of thecontinuing need to change between near
Neutral vision focus for the TSD and distant
vi-Mostly Disagree sionfocusto spot aircraft.
78%[ __ Disagree
7%C Agree 4. A TSD will distract pilot attention
7%/a Mostly Agree from other necessary cockpit
functions.
7 %C Neutral
7%C Mostly Disagree
72% Disagree
5. As a proximity warning or collision avoidance device a TSD:
65% A. Will enable the pilot to successfully detect,
resolve, and avoid most collision threatswithout a separate collision avoidance system which gives maneuver commands. Misinterpretation of situations and misreaction to threats will be infrequent.
B. Will enable the pilot to successfully detect, resolve, and avoid some threats but misreaction may be a significant problem.
13% E C. Should be used only as a device which
supple-ments collision avoidance system commands by showing the relationship of maneuver commands to traffic situation.
Two additional questions we're included in the post-run questionnaire. The first solicited pilot opinion regarding misuse or misreaction to data provided by a TSD and the second considered the overall effect of a TSD on safety. The results are given in Tables 2. 5 and 2. 6.
2.7 TSD Benefits to ATC
Response time to controller commands can be reduced because awareness of the overall ATC situation can enable a pilot to plan ahead for
anticipated maneuvers. Reaction can be more precise and at the proper
rate to achieve the controller's intention.
The information transfer process between the controller and pilot can be more efficient when a TSD is available. Controller's instructions can be simplified and abbreviated because a common data base is used. Stipulations of a clearance can be defined relative to the actual ATC traffic constraint,
instead of indirectly through navigation fixes such as crossing radials, DME distances or altitudes.
A cockpit traffic situation display can significantly reduce the con-troller's communications burden by elimination of the need for most situation
or traffic advisory messages. This alone can account for a sizable reduction
of communications. In a brief study of present operations in the Boston
TRACON, it was determined that 34% of the messages initiated by an approach
controller observed at random were advisory in nature. The sample was
taken over a 30 minute period with high density traffic in bad weather.
Weather: Ceiling 500' broken, 1000' overcast, visibility 2 miles
light rain and fog. Wind 1800 at 14 knots
Time: 2000 EDT to 2030 EDT
Controller: 126. 5 MHz approach control position
Table 2.5
Display Misuse or Abuse Survey Results
Definition: MISUSE OR ABUSE
Unauthorized operations or operation contrary to
ATC clearance - Also, operations which violate
good operating practices, though being legal.
Examples: Attempting to take unauthorized shortcuts in procedures,
disregarding clearances, frequent requesting of special treatment which may unduly increase controller work-load, maneuvering so as to "beat out" other traffic for approach, etc.
Percent Response for Pilot misuse and abuse of information
Each Alternative presented on a TSD:
1. Will be widespread.
2. Will occur with sufficient frequency that the overall usefulness of the display function will be in question.
6 4 %1 3. Will occasionally occur but will not
signif-icantly detract from the usefulness of the
display function.
3 6 % I 4. Will rarely occur.
Table 2.6
Safety Survey Results
Percent Response for Evaluation of the overall contribution of this
Each Alternative display to flight safety is:
75%1 1. The display provides a great improvement
in safety.
2 5
%
[
2. The display provides a slight improvementin safety
3. The display has a neutral effect on safety-improvements in some areas are balanced by adverse effects in other areas.
4. The display contributes to a slight reduction in safety.
5. The display create hazards through potential
distraction, misreaction, and misuse and greatly decreases safety.
Messages of an advisory nature are considered to be those which are non-essential for control purposes but are related to keeping the pilots informed
of the overall situation. Examples of typical advisory messages are:
"American 11 you are number three for approach behind an Eastern DC9, 11 o'clock 6 miles, just passing the Lynnfield beacon".
"Allegheny 862 I'll be taking you through the localizer for additional spacing, expect a speed reduction in
5 miles".
If the aircraft being controlled during this sample period were equipped with TSD's,most of the advisory messages (34% of the total number of trans-mitted messages) could have been eliminated.
Another area where a TSD can make a significant contribution is in providing increased flexibility for the ATC system. Cases arise where con-trollers must exercise judgements regarding pilot and aircraft performance
capability. The examples which occur most frequently are controller
estima-tion of climb, descent and speed capability. Often unduly restrictive proce-dures and safety margins must be employed to accommodate a wide range of aircraft performance and pilot responses. However, if pilots are aware of the controller's objective, compliance with a clearance can be accomplished in a specific manner favorable to ATC, thus freeing airspace which would be pro-tected for a range of responses. With a TSD, pilots can cooperate with con-trollers in this way much more frequently than now possible because of an increased awareness of overall traffic flow and control objectives. Timely suggestions and increased assistance in achieving specific aircraft response can contribute to greater efficiency in both terminal and enroute operations.
The effectiveness of certain procedures currently employed in terminal area operations in visual conditions can be increased through use
of a TSD. A prime example of this is the potential for improvements to
visual approach procedures for IFR aircraft. A TSD can provide the pilot
the means to positively identify traffic of interest such as an aircraft which is to be followed. Speed and path changes can be observed much sooner than now possible by visual estimation. Range and range rate can be
deter-mined more accurately and at greater separations. A TSD would be
parti-cularly helpful for flying in haze conditions, at night, towards a sun low on the horizon, or in other reduced visibility conditions. As a result, more precise maneuvering can be expected and clearance for visual approach may be granted sooner in the approach profile and in a wider variety of weather
conditions. The significance of improved or extended visual approach
pro-cedures is very great because flow capacities are generally much higher when these procedures can be employed. Pilot opinion of TSD merit in a visual approach situation is given in Table 2.7.
Table 2.7
Pilot Opinion of TSD Merit in Visual Approach Situations Percentage response to
visual approach statement
79%1 Agree
A TSD will enable pilots to attain and
7%E
Mostly Agree maintain more accurate spacing duringvisual approaches.
7%C
NeutralMostly Disagree
THE EXPERIMENTAL PROGRAM
3.1 Description of the Simulation Facility
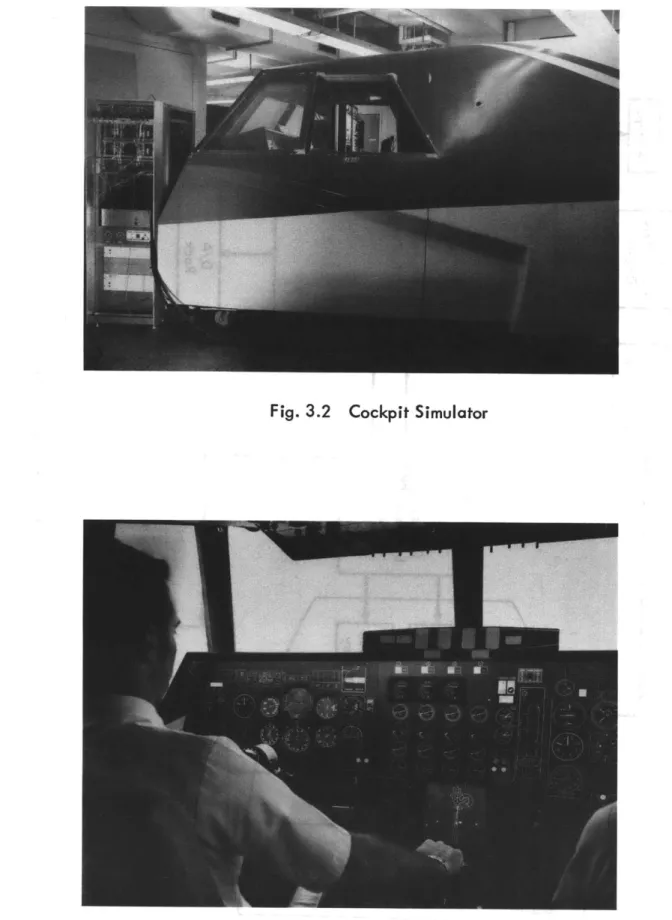
The essential elements of the real world that were to be modelled were the cockpit environment, aircraft characteristics, and ATC situations. Since TSD's would most likely be introduced in transport category aircraft, initial simulation was directed towards this application.
A fixed base research simulator using CRT's to generate both flight instruments and the TSD served as the basic component of the simulation.
Its aircraft dynamics were similar to a Boeing 707-123B. The cockpit,
computer, associated hardware, and data recording equipment are shown in schematic form in Figure 3.1.
A fixed base simulation was used in initial experiments because time constants associated with the tasks which would be performed were long compared to motion cues experienced in flight. Turbulence effects, which may contribute to decreased task performance, were estimated by subject pilots in post-run questionnaires. Exterior and interior views of the cockpit are shown in Figures 3. 2 and 3. 3.
The captain's flight group instruments were a CRT generated
repre-sentation of the Collins FD-109 integrated flight system. This system is
typical of instrument systems used in current generation transport aircraft. Because of the high percentage of time inwhich full or partial autopilot components are used in air carrier work, initial tests were conducted with
"control wheel steering" (CWS). This flight control system provides air-craft attitude stabilization while the pilot uses the control wheel in much the same manner as when manually flying the aircraft.
-38-Fixed Base Research Simulator Cockpit
Figure 3.1 Simulation Facility Block Diagram
ADAGE AGT-30 Digital Computer
Fig. 3.2 Cockpit Simulator
Similar CWS systems are available on Boeing 737, Douglas DC-10 and several other types of aircraft.
All approaches were flown using raw localizer and glide slope data.
Coupled approaches and steering commands are to be included in later experimentation.
Co-pilots were provided as part of the ecperimental setup. ATC clearances and communications were simulated by the experimentor for all
cases except the ones which tested controller performance. In these
ex-periments, line ATC controllers were used.
In post-run questionnaires, subjects were asked to rate the acceptability of the aircraft simulation. Subject responses are given in Table 3.1.
Table 3.1
Simulator Evaluations The aircraft simulation:
3 3
/o
1. Realistically models the performanceand response of a transport category jet aircraft in the essential-parameters
which bear on the tasks of the experi-mental program.
67*/
1
2. Has minor deficiences, but for the
pur-poses of this set of experiments, it adequately models a transport category jet aircraft. (The deficiencies of the simulation are noticed by the pilot but they will most likely not affect the validity of the data. )
3. Has notable deficiencies which may
affect the validity of some data. 4. Has serious deficiencies which will
The Adage AGT-30 digital computer served as the central element
of the simulation facility. The Adage computer has a 16K core memory
with a 2 microsecond cycle time. In real time,the computer calculated
flight dynamics, recorded and processed data, generated target aircraft profiles and maintained the following three displays:
1. flight instruments,
2. traffic situation display, and
3. air traffic controller ARTS III display.
In addition, the computer provided analog outputs for data recorders. A software summary which lists major programs, subroutines and
describes their function is given in Table 3. 2.
Table 3.2 SOFTWARE
PROGRAM SUBROUTINES DESCRIPTION DISPLAY
NAME
ACSIM (AERO, SICOS, AIRCRAFT SIMULATION
DIRCS)
(FNSW) READ FUNCTION SWITCH BOX
(RDISC) READ DISCRETE INPUTS
(VCD 1) READ ANALOG OUTPUTS
(MKLTS) CONTROL MARKER LIGHTS
FINST (ICAL 1, FLIGHT INSTRUMENT FLIGHT
ICAL 2) CALCULATIONS INSTRUMENTS
MMAP (SSFLS, MAP DISPLAY CALCULATIONS MAP
BPARL)
TRFFL (TMOVE) TRAFFIC DISPLAY AND TRAFFIC
MOVEMENT CALCULATIONS
VALUP (VALUP) REAL TIME DATA PROCESSING
HOMR (HOMR) HEAD ORIENTATION MONITOR
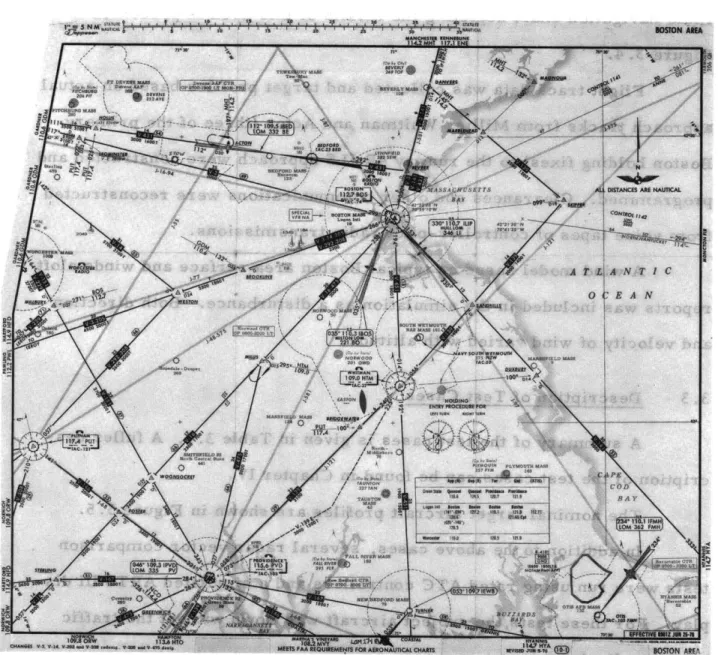
3.2 ATC Environment
ATC situations were based on the Boston terminal area. An area
radio navigation chart depicting the details of this area is presented in Figure 3. 4.
Flight track data was collected and target profiles based on actual approach tracks from Millis, Whitman and Acton (three of the primary Boston holding fixes) to the runway 4R ILS approach were constructed and
programmed. Clearances and other communications were reconstructed
from voice tapes of controller-pilot radio transmissions.
A wind model based on typical Boston area surface and winds aloft
reports was included in the simulation as a disturbance. Both direction and velocity of wind varied with altitude.
3.3 Description of Test Cases
A summary of the test cases is given in Table 3. 3. A fuller
des-cription of the test cases can be found in Chapter IV.
The nominal target aircraft profiles are shown in Figure 3. 5. In addition to the above cases, several radar vector comparison tests were run using rated ATC controllers and a simulated ARTS III dis-play. For these tests,the subject aircraft was flown without the traffic situation display.
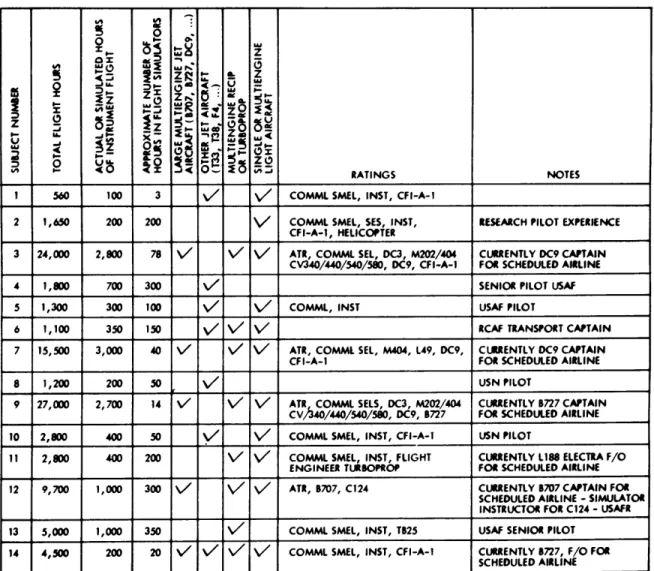
3.4 Subject Pilots
Subjects chosen for the experiments were all rated pilots. Primary
emphasis was on using subjects with either large aircraft (gross weight over 12, 500 lbs) or high performance jet aircraft experience. For initial tests