COMPUTER-AIDED DECISION MAKING: SERVICE ALLOCATION BY TRANSIT PLANNERS
by MAREK BANASIAK.
B.Sc.(Enq) Hons., Imperial. College. (1982)
SUBMITTED TO THE DEPARTMENT OF CIVIL ENGINEERING IN PARTIAL
FULFILLMENT OF THE REQUIREMENTS FOR THE
DEGREE OF MASTER OF SCIENCE IN
TRANSPORTATION at the
MASSACHUSETTS INSTITUTE OF TECHNOLOGY
June 1984.
O)
Massachusetts Institute of Technology 1984 Signature of authorDepartment of Civil Engineering
Certified by
-Nigel H,M. Wilson Thesis Supervisor Accepted by
Amedeo Odoni
Chairman, MST Piogram Committee Accepted by
Francois Morel Chairman, Department Committee
ZSA,,gCHjUSETTS INSTITUTE OF-ECHNOLOGY
,N2 81985
ARCHIVLt,
ACKNOWLEDGEMENTS
I would like to acknowledge the financial support provided by the
Urban Mass Transportation Administration of the U. S. Department of
Table of Contents
Abstract ... ... . . . 2
Acknowledgments ... ... 3
Table of Contents ... .... 4-5 List of Figures ... ... ... . -7
Chapter One: Frequency Determination: The State of the Art . 8 1.1: The Objectives and Scope of this Study ... ... 8
1.2: Service Allocation in the Bus Planning Process ... 9
1.3: Service Allocation: Current Practice . . . . . . . . . . 13
1.4: Decision Support Systems in Frequency Determination . . 19
1.'.1: Alternative Roles for Computer Models. 19 1.4.2: Prior Work ...- • * .. .• ... -21
: Thesis . . . . . . . . . . . . . . . . 25
Chapter Two: The Service Allocation Model ... . . ... 27
2.1: Evaluating a Model Form .. . . . . . . . . . . . . . . . 27
2.2: Laying the Foundations for the Model . . . . . . . . . .. 2
2.3: Detailed Model Description . . . . . . ... 32
2.3.1: The Objective Function ... . . . . . . . . . 36
2.3.2: The Constraints .. .. ..... * 39
2.4: Descriptive Elements of the Model ... ... 41
2.4.1: Demand Variation ... . . . . .... .o .. * 41
2.4.2: Determining Capacity .. . . ... 2.4.3: Operating Cost Functions ... . . . . . . . . . 2
Chapter Three: Data Reauirements. ... .. . . . . .. . . . . . 54
3.1: Model Inputs ... . .* * * * * * * * * * ' ' 55...
3.2: The Effect of Empirical and Judgemental Inputs on the Model's Character .... . . . . . . . . . . . . . . .. . 57
3.3: Obtaining the Model Inputs . . . . . . ... 59
3.4: The Data Requirements of the Model . . . . . . . . . . .. 61
Chapter Four: Solution Techniques ... . ... . . . . . . . 70
4.1: Simplifying the Capacity Constraint .. ... . ... 70
4.2: Approaches to Finding Optimal Solutions to the Frequency Problem .. ... . . . . . . . . 72
Page
Chapter Five: Application and Evaluation . . . . . . . . . . . . .
5.1: The Data Inputs . . . . . . . . . . . . . . . . . 5.2: The Recommendations . . . . . . . . . . . . . . . 5.3: Aspects of Cost-Benefit Analysis . . . . . . . . 5.4: Other Model Effects . . . . . . . . . . . . . . . 5.5: Sensitivity and Robustness Analysis . . . . . . .
5.5.1: Capacity Constraints . . . . . . . . . 5.5.2: Values of Wait Time and Social Benefits 5.5.3: Elasticity . . . . . . . . . . . . . . . 5.6: Broader Examination of the Model Paradigm . .
5.6.1: Dependence Between Routes . . . . . . . . 5.6.2: Marginal Value of Benefits . . . . . . . 5.6.3: Demand Variation . . . . . . . . . . . .
5.7: Summary.. ... Chapter Six: Recommendations and Conclusions . . . . . .
6.3.: Points of Departure ... ... 6.2: The Present Decision Making Process . . . . . . .
84 90 96 104 112 114 118 126 131 131 138 142 144 147 147 149 154 161 162 165 167
6.3: Recommended Decision Framework for Service Allocation . 6.4: Research Suggestions . . . . . . . . . . . . . . . . . 6.5: Concluding Remarks . . . . . . . . . . . . . . . . . . Bibliography . . . . . . . . . . . . . . . . . . . . . . . . . . Appendix A: The Planner's Role . . . . . . . . . . . . . . . .
· · · · · · · · r· · · · · · · · · e· · r··· · · · · · · · · · · · · · · · · · · · · · · · · · · · · · · · · · · ·
List of Figures Page Figure 1.1: Figure 2.1: Figure 2.2: Figure 2.3: Figure 2.4: Figure 3.1: Figure 3.2: Figure 4.1: Figure 4.2: Figure 4.3: Figure 5.1: Figure 5.2: Figure 5.3: Figure 5.4: Figure 5.5: Figure 5.6: Figure 5.7: Figure 5.8: Figure 5.9(a): Figure 5.9(b): Figure 5.10(a): Figure 5.10(b): Figure 5.11(a): Figure 5.11(b): Figure 5.11(c): Figure 5.12(a): Figure 5.12(b): Figure 5.13(a): Figure 5.13(b):
Sequential Components of the Bus Planning Process . 11
Frequency Determination Model ... 33-35
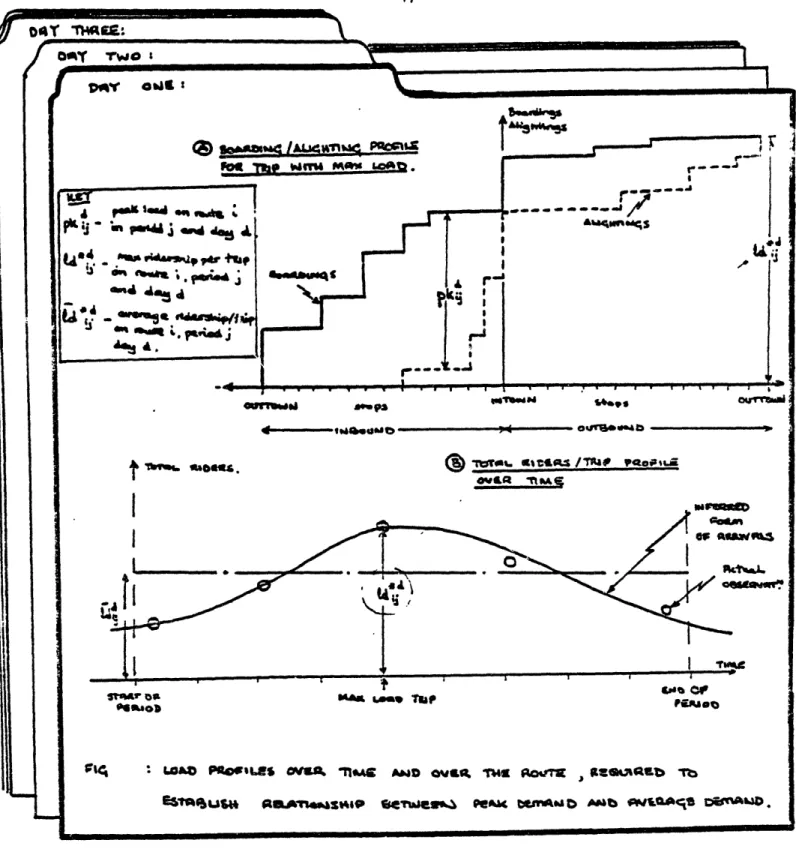
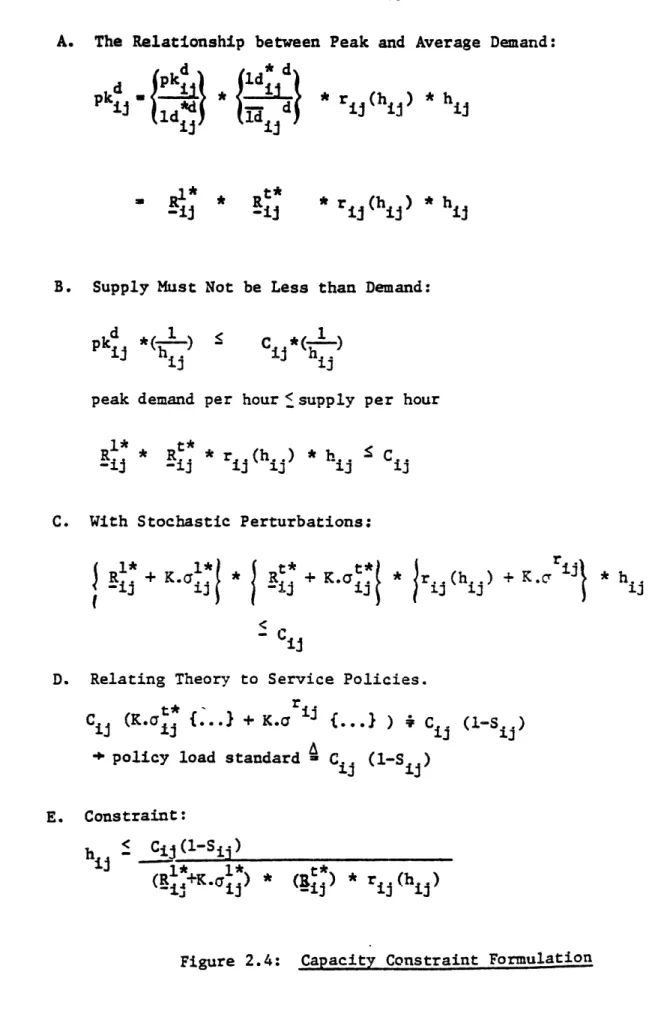
Pivot Point Logit Demand Function ... 43 Diagram Relating Peak Load and Average Ridership . 47 Capacity Constraint Formulation ... 48-49
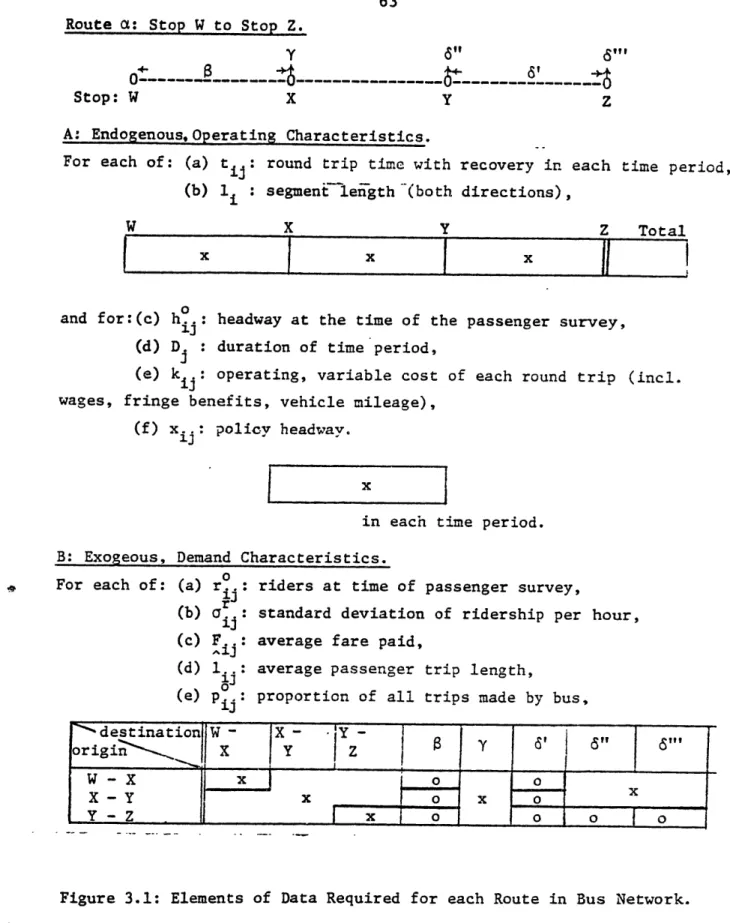
Elements of Data Required for each Route in
Bus Network ... ... .. ..63-64
Possible Data Sources ... 66-67
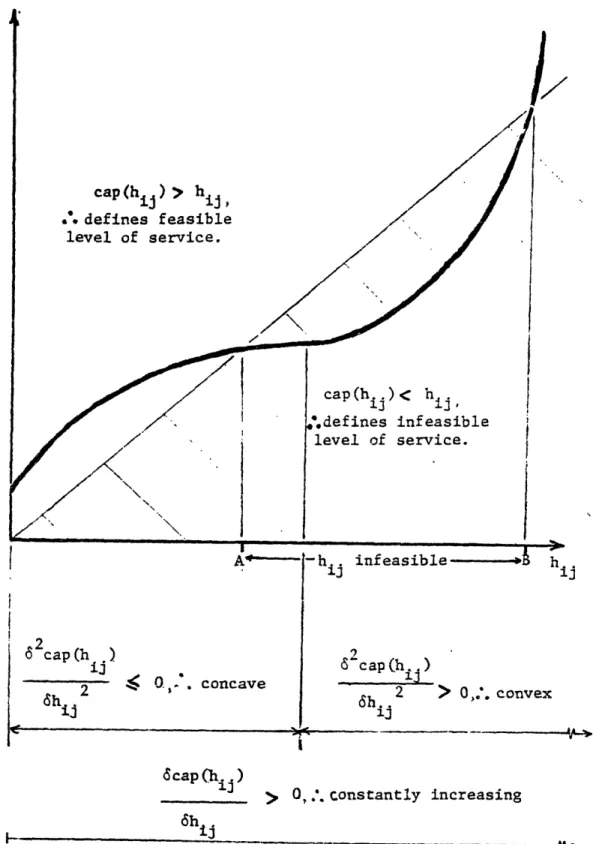
Graph of cap(h..): the Headway Required to Provide
Enough Capacity for the Ridership attracted at hj. 71 Furth's Program at Different Levels of
Decomposition ... 74-75
Illustration of Stable and Unstable Objective
Function Forms .. ... .. ... 80
Sources Used to Generate Model Inputs ... 85-87 Recommended Fleet Allocation. ... 91-92
Disaggregate Benefits ... . ... 97-98
Marginal Benefit Cost Analysis ... .100-101
Summary Cost-Benefit Effects .. ... 103
Relation Between Service and Demand .... . . ....106-109 Differences Between Non-Integer Solution and
Actual Allocation Aggregated by Headway ... 111 Differences between Non-Integer Solution and
Actual Allocation Aggregated by Subway Connection . 113 Relaxed Capacity Constraint Solution .. ... 115 Summary of Effect of Relaxing Capacity Constraint . 117 Increased Wait Time Value Solution .. . ... 120 Summary Effect of Increased Wait Time Values . . 122 Route Specific Differences Between the Situation
in Fall 1983 and the Solution for Doubled Peak
Benefit Values. ... . 124
Comparison Between the Base Non-Integer Solution
and that for Increased Peak Benefit Values .... 125 Comparison Between the Situation in Fall 1983
and the Solution for Increased Peak Benefit Values. 125 Comparison Between Variable and Fixed Demand
Solutions. ... ... ... ... ... .... ... 129 Summary Comparison of Fixed and Variable
Demand Effects ... . . . . . . . . 130
Constant Elasticity Solution ... ... . 134
7
List of Figures Pa ge Figure 5.14: Figure 5.15: Figure 6.1:Summary Effects Aggregated by Date Dependent
Rout2 Grcupings ... 137
Distribution of Expected Wait Time Changes Due
to Non-Integer Solution ... . 141
CHAPTER ON'E: FRE"OUE'iCY DETE"" .. T. "" : .T T.. .. . . T"HE ART
1.1: The Objectives and Scope of this Study
Recent developrments in computing and .!-it;a collection technolo.:-'is have awakened hopes tnat the art. of planning in the bus >idustry can be drawnr, t5war!s a sounder em-ir,,i'cal!v-basPd st rc,. In tlSe -ast. Lp to the costs of c3nt"1t uous -t ',rmati. CIile,:r ' .-:;: r -, in ,
theory and practice have focused on emnirical :vi enco .r.n fCr
-,atters of sin7u!ar i• portanc ' ... .. ....
that L uc.h cost cunstraints are :I ti z , h r2: 3>, :. , -ra .. -interaction between the theory of otffici.nt and effect;io bus ser'i e: :nd
bus
planningpractice.
Thus far such technologies have been apnliod to the btter defined, more mechanistic aspects of the olanning racess suc:h -driver run cutting and bus scheduling. These h!avp been relati'3'ivl-simple theoretical exerciseos since ihey r...quirred mi'i;, a amounts o human interaction to produce satisfactory results. However many other problems are either not very well defined or have no clear criterion as the basis for the decisions. The question tierefore arises, can theory incorporate enough
flexibility
in its for- to allow forinteraction and yet still have useful impact on the way decisions are made. This requires that extensions to theory :must be closely tied to
theory is sympathetic to the conditions of the decision environment; an environment about which little is formally known.
A number of models have been developed to look at the more "difficult" planning decisions, however none have been adopted for regular use. The implication being that the theoretical and empirical worlds are still set up too far apart. This study attempts tis raw together these two parts in a specific problem context and to study their interaction.
By introducing one of those models into a real decision context
it
snould be possible to helb define the appropriate course tfrfurther theoretical development if this is aopropriate. It i, not clear what role a comruter model may actually play in the process of naking a decision 'et alone in the wider organizati,-ai context.
tC-this is fundamental to dictating the forn the final model should ta:ke. This study should shed new light on both those aspects of the form and role of the model as well as on the specific problem of
determininz -ervice levels.
l.2: Service Allocation in the Bus Planning Process
I will examine the particular aspect of the short range transit planning (SRTP) process which determines the distribution of the operating subsidy over the bus network. Once the bus transit planner has decided which routes to operate, which stops they will serve, and tne hours of service, the next broad decision is the levels of service that should be provided on each route. Looking at this in another
way, the planner must decide how the operating resources are to be distributed over the routes. This decision determines the headways for each route at each time of the day, which is subsequently used as a basis for the bus scheduling and the driver run cutting decisions.
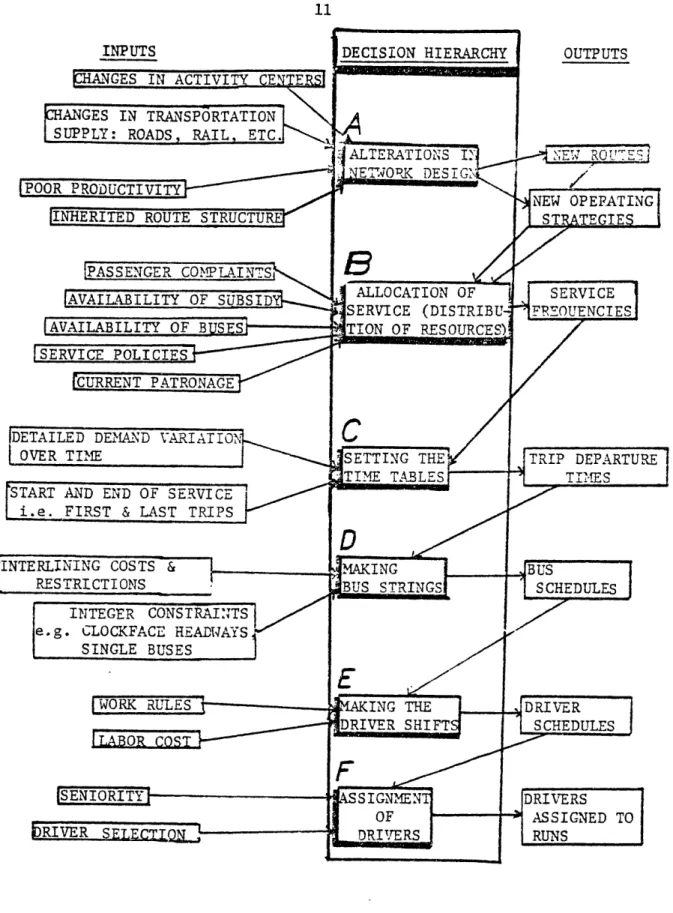
Figure 1.1 (adapted from a similar figure produced by Ceder [19:1) sows the rplanning orocess as a systematic decision sequence. Each dcisi:' which is positioned hi-her in the sequence beccom s an important input to the lower level decisions. Clearly the
indoendence nd orderliness of the separately identified decisions exists only in the diagram. To some oxtent decisions made furt Ir '!own tnCe sequi:nct- t.i il', haive so.: e effect on the ones made ".•rviou:l'". .•everth·c-ss, si;nc t his I sequence is repeated frequently and in as ;fr as the decisions in somne way frequently refer to the oxi,;L•.? ? system, feedback will occur over time. Thus an assumption of
independence is ameliorated, since the effects of the last cycle will be the basis for the next iteration, thus reducing the overall
accumulation of error.
Such a characterization of the bus planning process is useful for examining how the bus agency organizes the necessary standard
operating procedures. Furthermore, of particular relevance to this study, it establishes smaller independent decisions that define the context for computer model usage. In such a way it is further possible to establish the characteristics which will influence the allocation of service decision.
11
L
INTEGER CONSTRAINTS e.g. CLOCKFACE HEADNAYS
SINGLE BUSES
ALLOCATION OF ISERVICE (DISTRIBI
TION OF RESOURCE"
Figure 1.1: Sequential Components of the Bus Planning Process OUTPUTS
I
i
The allocation of service decision which I shall examine in this study is viewed as dependent on, but separate from, other decisions including: the amount of subsidy available, which is external to the whole process; the availability of buses which is also in some part externally dictated; the stops that are served by each route; and the scheduled start and finish of the daily bus service; all of which precede the service allocation decision in our sequence.
One question immediately arises: is it possible to draw accurate and consistent conclusions about what makes a service allocation
fficirent '-itnout reference to the schedules, -us and driver runs
which are determined subsequently?
We
can consider the 1acroOscO icaspects of scheduling, however, unless te decision can can e made
independent of the microscopic details rhis sequential frane:mork
W.,
i l have to be revised. The alternative of modelliin. th:e whoe sequence of decisions jointly would be difficult theoretically and inflexible in practice. This touches on a second issue; the need to allow expert judoement to interact with -:.e standard operating procedures, .in' wnat the-,nost desirable form of this interaction nmight be?The frequency setting decision is still one of the most complex components in the planning process. It aims for an efficient
allocation of service system-wide, between each route, as well as across time of day and over different days. It is a decision at precisely this scale that is most amenable to application of economic theory and computer-based analysis and most difficult to conduct
so much more global than that taken within present practice it is
likely that at least some interesting tlporetical insight may: rs,,lt. 7r-sont praci ce can • CI. described as
both
n.vopic and incremental: myopic because it does not look beyond a snall route cluster at atime, and incromental because the decisions made can be politically very sensitive :Ji h large transitional costs. ,W sweeping asi ie both these aso•cti.,
good
model may challenge rePscent conventional isdom.prac [ ic ath -:.;n'eC :. ii dec;Ji• s3 : Z. 2 fi• .1 5" -0 .a" ,:cD rica: , .
n ';it I
1.3: Service . location: Current trctic !2
A :plausiDle
way of examining
the
nat:ire
ore.~sent
o
the
rocesis
to envisage the role of a single act-r, the -ianner, poised iq the position of examining changes on the route networK. ýHe will recommend ::2e
general
fIorm
,f the bus service to ,- sc- :ulin, -.-eparCnent ,oSe job it is to make new schedules. New schedules would nor-at13 v ')e madeevery 3-6 months, hence the decision seq:uence_ oscribed pre•viously
I
frequently repeared.
Possible changes will be initiated either by comDlaints from the public or the operating staff, or from systematic collection and .nalysi; of information on the current state of the bu_ operations. in the first case, as pointed out by r;ilson and Gonzna:e , 82j. , hi
actions will be biased towards problems that occur rather than opportunities to improve the service. Passengers or drivers do not comolain that their buses are e~nov Q n the cond rqse the a~l-~~r
must identify the problems or opportunities that exist from the operating data that is collected. The simplest way in whiich this i: done is by relating the data to the servic• ,olicies of the agency. Here again the result is largely problen centernd s;•cý r?,'nt
service policies stress satisfc cicing raLc e" Znan comaraciv'.
criteria. They do not distiniuish vrv weli [etween di--,Grnt rou,
where the existence of opportuni-tios to inrve r''''
er',,
-different nanifestations.Therefore a service frequency on a route remains as it is unt:l
som
ething occurs,usually a "problem," which forces a chanle. Historically, tLe schedules were cut manually and there were noautomated data collection procedures, so this approach was clearly the only one feasible. Small changes to a schedule had to be localized and readily incorporated, since the implemeontation costs aind
constraints were so significant. Often service increases were only
possible where there was slack in the
bus
or driver allocation. So the cost of a service increase was probably less than the average cost of the bus or driver. Also changes were deliberately incremental to allow for operating uncertainties as well as political realities.The question is what distribution of service will ultimately
result from this sort of reactive incremental process. For the
scenarios. If the planner is aware only of capacity problems, he may act only to rectify these problems. This is typical of the "crisis planning" mode some planners like to identify as charactoristic of
their job. Essentially it results in the service being dictated by complaints with the routes having the highest peak loads or the most vocal passengers and drivers receiving the benefit of service
adjustments.
This approach does not really tell us what occurs on the routes without capacity problems. Presumably to some extent the service will remain at the level at which the route last experienced some capacity
problems.
Clearly demand may have decayed over that tv;i.e such thatthe service provided now is very inefficient. However, there is also the obverse side to this problem: where does one obtain the
buses
needed to provide the extra service? This is not cloar in thisscenario, though it does leave the impression of a bloated bureaucracy that complains of resource pressures while not having properly revised its outdated service desizn.
Planners do often have an idea about where service can be reducec to provide plaster for the cracks that emerge elsewhere. They speak of "slack" in the schedule; this could mean under-utilized buses, but often includes buses that could be saved by minor re-scheduling. However, it is beyond the scope of the service allocation decision we have defined to identify runs that couli be short turned, or to
arrange for more buses to travel in the peak direction at the peak point, since these are scheduling and operating strategies. The
political nature of the process of identifying this slack means it is often spoken of in terms of a vanishing trick: removing service in
such a way that nobody will notice. Such a trick spotlights routoe with high frequencies where the perception of wait time loss is diluted into small impacts spread over a large number of riders.
Clearly this is not just a frivolous practice that can be ignored when formulatinz .3 "3t ional" decision framework.
An idea about wrat may result from such practice produces a second scenario connected with the distribution of service. It is quite possible that a ;whIole history of capacirty comp~laints would result in the sittuation ,nereb- a3ll the routes; had service
frequencies p orortional to the peak demands on those routes. In
oehavioral
terms this is a case of peak demand driven suppiy; however,the same result may also be achieved if a service policy of equal peak load factors is taken seriously as an objective. It has in fact been su;gested by Furth (1980) and Morlok (1974) in two separate studies
that actual operating relationships reflect this sort of critorion for service allocation.
In a normative sense this distribution only makes sound sense in a situation where all the routes are capacity constrained. Only in this capacity constrained case should the service provided be
proportional to the peak demand. Alternatively, this service allocation may occur since it is a broad approximation to an efficient service allocation if the information about the system utilization is poor. However this type of allocation does not
acknowledge the possibility of increasing the benefit obtainable from running bus service. Rider benefits such as wait time improvements are not considered within the service object ives tha!t r:'lt
an allocation, but rather some objective of parity between levels of comfort on different routes is the overriding criteria.
If the planner assumes a constant relationship between peak and total demand over all the routes then the service frequency is also proportional to the total demand per hour on each route. Ostensibly this decision criterion provides an
equitable
distribution of service but it does not mean that the operating su sidv is equally -istributer to each passenger since some runs are more expensive to opert,- than others. From this it is clear that an appropriate criterion forservice allocati"on should include both thle effects of the neakq dernanrd loads and the efficient distribution of service to all riders.
The efficiency criterion is equivalent to balancing the marginal
costs and marginal benefits of providing service each route.
Theoretical approaches that attemot to ffr-.alize on this seemingly simple decision criteria are presented in the context of a literature
survey in the next section.
The inability to show conclusively that any single approach is the basis for the existing frequency allocation decision supports a hypothesis that the question itself is never explicitly posed at the system level; if some relationship is perceived it is the result of a historic and on-going process. This may be because routes are not similar enough to make a plausible comparison of benefits and costs.
In this case not even a more complicated theoretical model will help. Alternatively, the costs of data collection and of the computation
required for a comprehensive analysis may simply have been
prohibitive. In which case new technologies promise to alleviate these constraints, so an examination of a more rigorous analysis leading to a change in the planning process may be productive.
At present, it is probable that route frequency setting is only explicitly considered after a large change in the network is made e.g. if a new route is added, or if 2eiand is expected to change
,!-2stically. in such cases demand predictions are probably sketched and service allocated according to the general principle of satisfying
the demand subject to resource availability. Actual demand is tohen observed on each route and adjustments made as necessary.
Nevertheless, the decision concerning route frequencies is so fundamental to the efficient use of the operating subsidies that it deserves more formal consideration. A credible and sound criterion
for allocating service may provide leverage for the lanner against the more political aspects of the process.
Turning from the focus planning practice, the next sections examine what researchers have made of the whole situation. First of all a short section will describe how it is envisaged that computers may be used in the planning process. Then a comparison is made
between examples of models created to tackle aspects of the service allocation decision with the conceptual roles it has been suggested they might play.
1.4; Decision Suppoort Systems in Frequency Determination 1.'..: Alternative :oles for Comout~r .Models
1hus far i ave suggested a decision context and described some
current decision criterion for setting frequencies. In terms of analyzing the decision m akirn: ?rocess, three interdependent factors delineate the particular approach that will be used. First oE all the decision as to be clear!v defined. The form of this definition has .ilraadv ii. n ,ri 5 tiC- • -I'.-.ted .· -: .'- : ": t 1 :- • )): us U- 1,l•.i-:,
-process. In the terminol:?y *f system-,:- analysil thiS is alna -;: :! to
- " ... - o. .m c. on,
riori anpLrai sal ofI te J0ciiCn crit.eriuC tu .we :jsed is r 2ui reI aSs an input to the conceptualization process. Finally, and closely related to both t.h, h ihe -,odeler -1n:st decdin AKat role the model will play in the decision irocess. C'learly, quite different models would be appropriate for JFiffrent p-rc ptions of the model's role. iere it is important to assess the role that expert judgement should play in the process and what parts of the decisions can be
standardized without affecting the overall flexibility of the process. The particular role of the model as a tool can be seen in three different perspectives:
(a) it can help in the understanding the central mechanisms of the problem,
(b) it can act in a predictive sense by describing the behavior
(c) it can have an evaluative role comparing different solutions
or suggesting new solutions.
T.hich role is dominant dep? nd4 on t!e ov-' r•.I1 ' ..i-i-I makin,;'1-
process.
For instance an analyst or planner may not be able to suggest a single unrequivocal Zriterion for makiing the decision. Howver,
without such a criterion it is impossible to c,:h- e b)etwee-.h ff-rl~, solutions. Even so, in the absence of an ovaluarin ,stce~, a
,escriptive or predictive model may still -roeviie uweful inior-nari which will assist the decision maker. -it~h 1 -r ::c ive ,c1 scenarios can be olaved out in a realis tic -.anner ' ithut :e 1 ccil
costs of actually implementation. "Nota.bly, the model form that serves an evaluation role has to include all theo elements necessary for a descriptive role; at least in as far as there are no tra1,e-offs
involved with the costs of greater complexity. In toers of -odellin' methods, simulation is characteristic of the descriptive role, whereas mathematical oItimization is most illustrative of
The
eaiuative roie.The first role of developing an understanding about the problem arises in the form of rules of thumb that are oroduced frr:;
cl:osed
form descriptions of the system. Here the critical question is concerned with the appropriate level of generalization about the problem. If the theory is such that it only reflects the broadest
aspects of the decision, an approximate rule of thumb may be the appropriate role for analysis to play in the decision. After all,
conceptualization that may not prove adequate for many actual problems.
On this somewhat abstract basis I shall proceed to examine some
theoretical positions taken on the appropriate system, decision
criterion and role for a frequency setting model. Overall there is a striking contrast concerning the: criteria for the decision as
seen
5' researchers and that which is evidenced by observation of practice.1.A.2: Prior
Work
The first interesting work on the service allocation • wroblem as presented by vMohri.:- (1972) -,ho developed a prescriptvoe relati-nsniv between the optimal headway and the inverse of the square root ,f
taf
total ridershii on that route. By simply
m.inimizin'z
the sum of ride!rbenefits in terms of wait time savings and the cost of providing t'h
service, the following expression can be derived:
t =
where 1 = I eadway,
c = operating cost per run, b = value of wait time, r = total ridership.
The significance of this expression lies in the way that it
contradicts the common practice of allocating service so that peak loads are equal. Mohring's rule suggests that service should be
related to the total ridership rather than the peak ridership, and furthermore that the relationship is not linear. One explanation of this contradiction rests on the fact that Morlok does not consider the possibility of this criterion producing a capacity constrained
condition. However more complicated analyses still do not support the
equal load rule, except in the exceptional circumstances of capacity
loading thr:•ugnout the system.
Since Alohring a number of studies have been carried out by Europeans, attempting to apply network optimization techniques to produce a model covering a more comprehensive domain. Hol. (1973),
'lrv ("1969) a:ndi fi-:aiy -c S:eI'ele and Erlancder (1971) focussed mainly on e descrItive S:iernsion ,ven though optimal solutions were
ultimatelv deternmi : . The research took a narrow theoretical perspective, which avoided the problems of predicting passenger behaviour accurately when mode choice, route choice and individual capacity tolerances were all involved. The objective functions used to represent appropriate decision criteria received little attention.
Scheele and Erlander (1974) modelled the whole trip but assumed that passenger behaviour was dictated by the condition that a system optimum could be achieved. (One of the difficulties, evidenced here,
is to represent behavior in a concise but flexible mannei.) This strictly limited the descriptive and intuition-building uses of the model since in practice system optimum solutions do not normally occur. In general, there are practical constraints in terms of data requirements and computational ability that make the use of such
models unrealistic. It is clear that a practical descriptive model must assume away some of the more intricate aspects of the operation of the entire system. Alternatively, it may be approprit : ·1,, ..- . a detailed Monte Carlo simulation for a single route if the routes can be effectively assumed to be independent.
Uhrv (1969) was the only one of these three to sug•'est an economic efficiency criterion for the objective function. He
maximized the riders' benefit using consumer surplus. It is commonly accepted however that some of the benefits from operating a bus ;ystem are in fact the social benefits to cie non user. "ence, if a
cost-benefit approach is appropriate, social benefits should be included as well as user consumer surplus.
Three more recent studies byv iasselstroj (1982), Kocur and
Hendrickson (1982) and Ceder (1982) examine at least in part the
frequency allocation decision. Interestingly they differ dramatically in the role, scope and the criterion used in eachi model.
Both Rasselstrom (19'32) and Kocur •nd -ten'rickson (12)' appr•ach the much wider decision context which includes route network
adjustment and in Kocur and Hendrickson's case even fare setting. These matters, however, are strongly governed by factors beyond thu planner's domain. Even though this sort of approach has been popular in the theoretically oriented literature, I would argue that a useful tool must be more realistic about which decision variables are really under the control of the decision maker.
Hasstlstrom uses a mathematical programming technique
incorporating a descriptive framework based on assumptions much more relevant to the European context. The cost-benefit analysis approach
suffers from being simplified into a trip maximization objective.
This model requires a series of weak assumptions, mainly to facilitate a more complicated inte-er programming technique which is in itself
not relevant to the decision context I have isolated. One of the most important features of the service allocation decision will in fact be determining a credible .lecisiun criterion, so I propose to expend more effort in expanding this direction in particular.
On the other hand, Kocur and Hendrickson accept descriptive
simplicity in order to obtain greater flexibility between a series of
management objectives which form the alternative decision crit
eria
-orthe model. However for t!ie particular service allocation decision, it is not clear that deficit minimization for instance, is an important criterion for the planner who perceives a fixed operating budget. Kocur and Hendrickson attemat to
grneralize
a number oft aspects orf a bus network- and the SRTP process and do not offer as much flexibility and insight as one would like for the particular problem at hand.Ceder (1982) approaches the frequency allocation problem without a clear decision criterion, but is extremely aware of the operating environment around this computer model. For ' stance the form of the
model is skillfully oriented towards dealing with the forms of data available to planners. The
frequency
can then be determined on the basis of either peak demand observations or average occupancy on thecomplete route. However, neither of these are based on a very soundly argued criter-ion, and no prtference is mentioned, although they ar, criteria that Iainners c,,,.monly use.
Through a survey of relevant, literature I have attempted to examine the important aspects that establisi the
sort
of uses a cI•p:Lut::r tool may be good .far. Furthermore-, there seems tcbe
a .ap between "'hat ,uI .ti .- `'ive as the ni 'the that rer.sent. s thaTanner~ e e,:oiS for suchi a tooi and t'ie tools :seve(lped so far. A r q-..uencyv 1 Loc:i;t i e-. ; - : : . s :
-. n- "
and 1 . , that t'-11
4W i be jaseC1 on.
1.5: Thesis Contents
Th" next chapter : stabli3hes more reci seIv the tteorcticai
nature of the model we shall be using to examnie the decision environment. Subsequcent chat ters xcamine eimpircal omissions, theoretical xtensions and issues that test and
exnmine
:he actual usage of the nodel as a tool. 1Chater Tut o coucentLrates on a deduc: Iyecriticism of t1he way the descriptive qualities of the bus ne[wor. have been reduced to
make
a mathematical mode& tractable. This leads into the empirical test in Chapter Five which prioritises the shortcomi;gsidentified in Chapter Two for a specific case. Chapter Three is
concerned with the practical issues of producing the data required to run the model. Chapter Four is concerned with iqsues concerning the wider solution space discussing matters that are otherwise outside the
26
models paradigm including risk, stochasticity, uncertainty and systrn dynamics. Finally some constructive recommendations and concliusions
in Chanter Six wi 11 refocus th- 'is-Ion i'f -,T, r -onf ,3': qtemS analysis in supporting decision-making. Chapter Six also includes a recommended framework for
making
the decision with computerized analysis aids.CHAPTER TWO: THE SERVICE ALLOCATION MODEL
2.1: Evaluatinz a •Model Form.
In this chapter I will present a detailed description of the frequency determination rodel. It is based on a formulation presented
ov
Furth (193')), but I would like to reappraise every judemental decision made to come up with that formulation. 1 . general, I wouldidentify two categories of such judgementaI inputs that affect the Cinal character of the model.
First of all, an analyst delineaLes the rorad
aspects
s oc ii -od"l:thie
methodology,
the scope and the decision criteria. These decissoo1 are characterized by the discreteness of the possible choices .ind wi I be dictated to a large extent by the analyst's specific skilli and 'i-experience with the particular problem. Even so these jecisiunsprobably also have the most profound impact on the character of the model which in turn reflects on the focus of our study: the potential
rses
and roles of such o ;del• In
practicP.
Later in the chapter i shall set the scope of the judzemental decisions which involves finding approoriate trade-offs between the costs of computation and data collection as opposed to the accuracy of the model. These analyses have a different character because threy concern finding the optimal mix rather than being either/or decisions. These inputs are also dependent on the outcomes of the first set
identified. The kinds of issues which affect accuracy of the model inc lude:
(a) Whether parameters can be assumed constant over the variables of the model, e.g. assuming marginal cost equals average cost.
(b) W'heth-r some impacts can be neglected.
(c) Whether points of discontinuity are acceptable e.g. how the definition of discrete time periods affects the results.
(d) Finally,
whether
certain probabilistic variables can beapproximated . Itcier-lini tic.
Effectively these assumptions are dictated by computational
complexity and data unavailaoility. So it should
be
borne in miind, when reviewing these details ,W t:t;e model ihat future tecihnoloaicaldevColrentrts -7av roeaix t!';* cnstr ints and may make more comolex f:[r-ms
,
th
ef model Iore tenable.2.2: La-v2in • -e 7ou Idations f.r the •!oeI!
_efore tackling the details of the model I would like to dwell on the broader issues which set the frarmework of the analy'sis. I assert that it is deciding on these points of departure that ultinately plays a large part i! deC,errinin .:lhe usefulness orf t•"e model in -ractice.
Furthermore the criteria for making these broader decisions must be developed cocsiderin; the model's intended future use. Unless the model
is developed in a state of awareness about this decision context, the arguments may arbitrarily follow the economic or operations research paradigms. Each area of theoretical specialization is based on certain rarely questioned a priori statements that lock into these specific paradigms so I i•hall examine how these broad decisions about the scope
of the model, the decision criteria and the role of the model might effect the ultimate character of the tool being produced.
First of all there are certain characteristics pertain2; .:.
mathematical programming structure which we shall be using. Clearly mathematical programing is primarily a procedure concerned with
generating optimal solutions. As such this approach is predicated :)
the existence of a single objective function that represents the sole decision criterion. Sometimes multiple objectives can be included,
though only when trade offs between the objectives are defined. This i. turn
neans
that. the role of this optim•ization model can be chief:lidentified within the evaluative category :mentioned previousl!.
Therefore thle interaction of exnert judgement with the computer-aied decision process can readil "/ be neglected. Descriptive models allow greater interaction because the planner rather than the machine is the originator of the solutions.
The optimal solution as specified does not address the path to be taken fro-i the
present
state to arrive at the op.timal state. In this way the model is static rather than dynamic and each solution is described only by its own characteristics. Therefore the costs and constraints associated with the change processes are ignored, since this would involv'e characteristics of other states.Mathematical programming also distinguishes between sets of
feasible and infeasible solutions by introducing a set of constraints. However no trade-offs are allowed between the solutions within the constraints and those outside the constraints. This marked contrast
with the trade offs allowed within the objecrive function defines the
different characters of those two elements of the model. This is most
striking when for instance the issue of bus capacity is considered. It
is difficult to determine a loading at which a bus is "at capacity",
since one more passenger can always be found who will squeeze himself on
to save himself an uncertain wait. R-owever planners usually tak in terms of a physical bus capacity. The first notion places capacity issues strictly in the objective function of the program since trade-offs are present between perceptions of capacity. The second
.:iewoint i4oulu establish capacity concerns as )operational constraint since the notion of physical capacity is absolute.
Another aspect of these broad issues arises from the decisions concerning what is appropriately included in the model, that i3 the scope of the model. This is determined througil the interpretation of the decision sequence that we have accepted as a context for the service allocation decision. Since the process of bus scheduling is subsequent
to, and separate from this decision, the b)us arrivals and hence the
passenger arrivals can only be described at the level of bus flows and passenger flows. Stochastic variation in the arrivals is described by
the uncertainty concerned with the rate of flow. Clearly when the level of service at a bus stop is only being described as a flow the concept of a discrete bus trip disappears. This is not really a simplification as much as it is an analogy and hence it will introduce certain
Alternatively the scope of the model can be seen in terms of where thea analyst i• prepared to a3sume away the • ,,iStecn ofU complicatedI ,i1e,endencites. In the deri-;ion sequence characterizing the bus olanni isn process, we presented a simplified form of dependence between individual decision units. Similarly I h;all be assuming that t he extent of the interaction occurring betwce,'n 'uses operating on a single right of -ray
is not :a function , 'r.m rrc ,; effectiv.!y ignorin: •.is bunch, -,
t. ,- Cs .:n Lra·v6 t ieS. , In d i iI, c:. ErCffe r cCs or.C :- part, ;,iir
i so S .Or.i, '1 .1'I.; -'1,,ii I .
7' -hirl a ect thit .. :ave detfine.:; -i • f --itive )f i,, -.--;
th!e ,,aliuat ive critc:ria :e shall be using. L. s ikely that t hi is . critically imporrtant as)occ: of :he exercise s;incC frequencv .a'locatiofl in current practice displays sC:r.e ao arien ano'.ma1 ns i about te ,atare ,r
this criterion. I shall use an
economically
based criterion, oriented towards an efficient cost-benefit analysis of the decision. As statedt.,is paradimn chiefly imnoses the restrictions that .i!i the costs and benefits are both measureable and tradeable. owever as Lo fur:tier in defining the problem, I shall need to discard a social welfare
representation so that the model makes few distinctions between the needs of different people. In addition, I shall have to reconcile forms of parameter measurement that themselves are contradictory and
contentious. Nevertheless, given the need for a single explicit
decision criterion, I feel cost benefit analysis represents the clearest available rationale which can incorporate the goals of a bus agency.
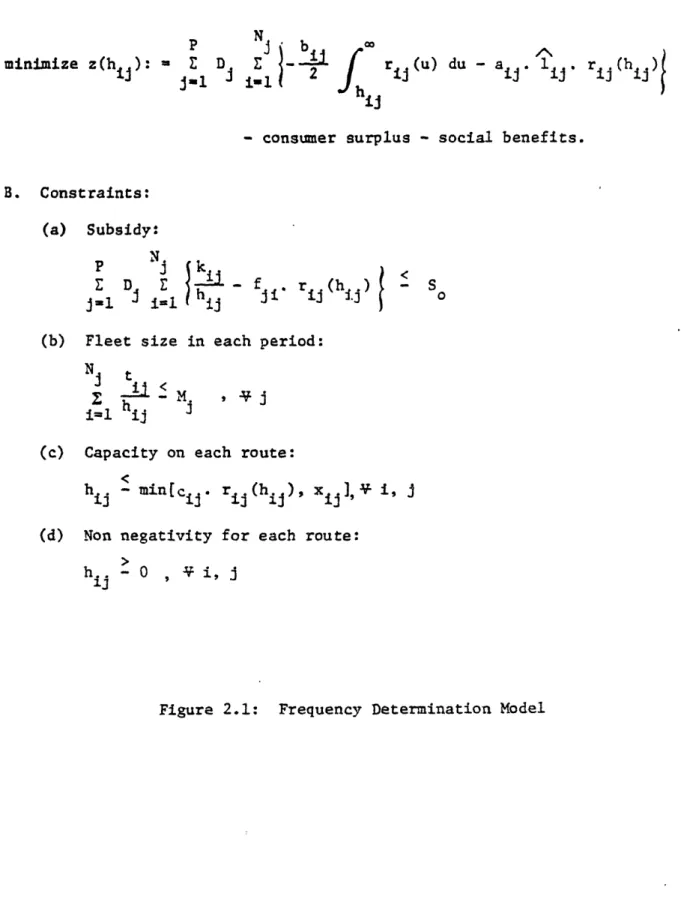
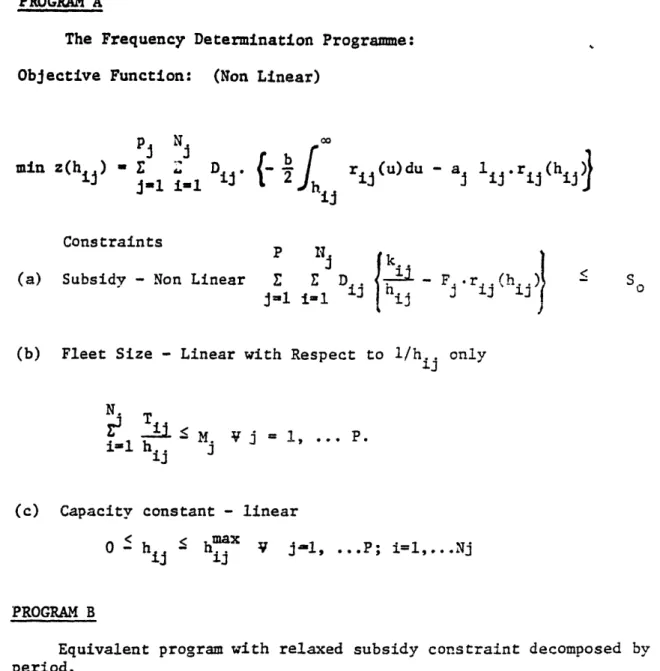
2.3: Detailed Model Description
The mathematical form of the modr• i i:~ .iivcn in 1u'r 2.1. Si:ic-it is very similar to the form Furth (;93C) used
i
shall cricicallvexamine its elements rather than explaining just the methodology. In general the model is quite typical of a number of apporoaches presently being advocated tackling management/planning models, so the comments
also have some wider implications. I am aiso vi,-Wi,'', ,thi as t,-e Stiat, of the art in computer modeoin. for t:i• -. :-.rm i
decision area software engineers presently, are opening 1 , •..: ,discussion includes a critical exai i .
computer tool deve.lopment and advancen:ent.
Furth's model is typical of the way t.,e matl.matical ro-gramm1in method styliises a decision. This forT includes a: OjOctive f::::Ct in
which is the embodiment of the decision criterion and the constrairt_ which identify a set of feasible solutions. Furt!hermore, the way :;at
the dimensions of the problem are sialified to facilitate the analysi: also strong'l influences the character of t!e final .cl-dl, e. .
the spatial and temporal dimensions are continuous or in 'what fashion they are made discrete.
This particular model establishes a descriptive framework
based
onsteady-state characterizations typical of the operation of the transit network at particular times of the day. So each period is represented by a "snapshot". Within this "snapshot" the flows of buses and
33
A. Objective Function:
Maximize benefits
minimize z(hij): =
j
N
P
j
b1
= i- 1i 2ij
r
j(u) du
-
a1. 11
.
- consumer surplus - social benefits.
B. Constraints:
(a) Subsidy:
p N
D j
j-iD ir
j
a
i=
Skj
h
1 ji rij (hij(b) Fleet size in each period:
j t
i=1 ij
(c) Capacity on each route:
hij - min[cij. rij(hij), xj],9 i, J
(d)
Non negativity for each route:
hij - 0 , V i, j
Figure 2.1: Frequency Determination Model
ri.
(hij)I
Glossary:
j
-
index number for each time period
P - total number of time periods i - index number for each route
Nj - total number of routes
hij - headway on route i in period j
rij(hij) ridership on route i boarding in period j
bij - monetary value of wait time
a - monetary value of additional passenger miles attracted
sý - operating cost per round trip - average fare collected
So - total subsidy available
" - round trip travel time with recovery
- buses available
3 - capacity factor incorporating load profile characteristics and design loads
,D - duration of period in hours 1 - average length of trip
ij
x.. - policy headway 13
a Monte Carlo simulation process which would represent buses and
passengers discretely as individuals. This form of representation only considers steady state conditions and does not e'xamine cha•',,;. T;,
reality, of course, the system will need to adjust between these states if the recommended solution is adopted, however this is not an i•sue thi3s rmet"hodolo0;y can easily assimilate.
lNot beirg able to model flux in the system has many iipliic•tions. Some of the character of this flux can to a certain extent be subsumed by incorporating it as a l+evel of uncertaint'/.
Powever
•he uncertaintydoes not comnpltely capture tne nhenomenon., ince the amr-.o'It
uncertainty: itself has to be at a steady tate. ;evpertihetless it is in this way possial to include to a certain level of confi~dence that say the ridershi, iv (ne of these snapshfots wi I not exceed a certain: peak
ridership. rhis is done by including perturbation terms which nodify the mean ,alue by a certain number of standard deviations. The
shortco-nings of representing the system statically rather than
dynamically sugigests the periods shoul-i be defined :icross times irh•o?
little flux occurs and the single snapshot used is reasonably representative of the whole period.
The objective function calculates the changes in benefits and costs between the steady states that represent the present strategy and the recommended strategy. This may not be a very accurate description since in reality the system is always in transition and these steady states may never be observed. This becomes especially important as one considers how to model demand. Between these two steady-state
conditions there are likely to be ridership changes resulting from the
service changes. The real potential benefit from any change in the service allocation, hlowever, may not be achieved because the ridership may not change quickly enough between subsequent adjustments of the service allocation.
Optimality therefo)re is not really independent of time as this approach assumes. In fact optimality should be cxamined in the transition sta'es that occur between the change in service and the lagged change in ridership. It i hoped toat the initial change
recommendjat ins wil I
be
the largest and at future changes will staoiliz t as the recommendedi and actual strategies convergc.2.3.1: The Obj;ective Function
he objective function is sui-mary of the "benefit~ one <PC.ectL) to
be derive-i froim ,pP(rating the bus system. "enco maximizing thie benefits
wit:i: a
set
of .:-eratingconstrints
(incl•di~gthe
costof
runnin- t',system) is a more direct way of measuring the performance of the svste-tihn aan exanination o.j service objectives. In their current
situations,
transit agencies are focusing on efficiencv, goals similar to those incost benefit analysis. Nevertheless in as far as it is useful to simplify the mathemarical formulation, service objective representation nay just represent a more concise form of an objective function
evaluated in cost benefit terms. The only other special aspect of a cost benefit approach is the apparent need to quantify the elements of the analysis in dollar terms. In fact dollars may be used for more
intuitive appeal, but the medium of exchange is not an integral part of the analysis, only the fact tCiat there must ;~' some consistent medium of
A cost benefiL analysis considering welfare effercts is the fullest, most complicated .rm of a cost benefit rceplsentation possible.
Huw•v:r it i.ltroucs levels of complication and data requirtement, that .:.,0 Pe ,- .fi if• .::n "n r-e in a.l r'n a r ctical ?7 :,''t . [ . '•:1n
i. r kIuir es li-irificatcion about equityv ibjective' s l,)iat wo0!lii b, 1o3 iticallv ver; cor, n io ',. ' t'iscu ;.r
a.;:.,? C- , 'r• : -ros c: s a -. t, ' ." 3: 1[ in-' '
,. r.s> t ; ;il e- ,ii:-I cu: t to incorporat c'r ' - trar, ;t
-o.Yjectives that are oriented towards serviag special needs rat,•(r t:ian
te
.looba
l1emand
and focusio:: on special 2ro.ups. .-uch as thl agd,(
thdisabled and t.ne unemnloyed. Equally it does not consi".er in
any
favored light .roups which may be paying more towards the syst.m subsidy.
The objective function identifies t wo sources of '.,nefit that arise from operating a bus system. In broad terms they are benefits t.hat are accrue to the riders of the system, and benefits that accrue to users of other modes due to bus ridership. When improvements occur in bus
service, riders incur benefits from shortened wait times and non-riders incur benefits from the increase in bus rider3hip that occurs.
As in Figure 2.1 the riders benefits are formulated using the concept of consumer surplus. This measures the difference between the wait time the rider is willing to accept, and still travel by bus, and
that wait time which the rider actually incurs. To simplify the
calculation of waiL time, the average wait ti:nLe is assumei', equal to
one-hall f tho average heaadway. St-icctl V, .vt tI . ~ i '1 1 ,:--ao ,•;i'
unreliaoility in the service and decrease with b)etter knowledge of the timetable. Furthermore there will be a certain inconvenience associatoid ..itl a specific schedule. 4.t.'ether thi4 .. Tit teans tihe estirnat of
wait time is crude but is .a!so th- rest r•rt is.r as c1nc•Ci fn.-- .
L&is situation.
3enefits incurred by thow non-ri:v-r.s, the social wenefi -, .r., assumed collinear with bus passenger ni ,s .r:i?:. •.(
-representative ,measure of the ext.ent of • us u.is. •- . -e •necifi<
fr-:
of externality which this represents are for nst.ince the relief ofcongestion, reduction in poIlution, conservat ion of scarce resources -:d benefits from land use changes. These are usually related to the iun.ter of miles travelled on the bus system rather than in cars. Further-ore maximizing passenger miles is used by London Transport as the overrilding service objective, and much recent work has shown it to be a very ,-ood measure of these externalities (Glaister 1983). Hence since the service objective of maximizing passenger miles serves quite accurately as a proxy for what would otherwise require a complicated analysis, it is quite reasonable and convenient to use it here.
The final components of this objective function are the parameters
b .. and a. that represent the conversion of these physical
ij
13
measures into their monetary equivalents. One issue here involves
is concerned with what level of disaggregation of these parameters is appropriate. Assuming no welfare effects only a single "b" is required for the whole analysis. Different values of "a" are sug.ested when the size of the social benefit varies across routes. This however requires knowledge about the transport and urban system generally outside the transit planner's domain. If more information is available about 'ho make-up of the ridership and how these numbers shouldl vrvy bt-'e,?n ri•"er groups, welfare effects may in fact be assimilated into the modei.
Furthermore the marginal values of these ben-efits are assuried cons•~nt in the model over the service changes and their subs-Pquent ,fttct;.
-hall discuss measurement and calibration of these values in Chatfer 4.
2.3.2: The Constraints
The constraints included in this model formul3tion r'prresent
aspects of the operational environment that restrict the for-. of service that can be provided on each route. Due to the general formulation t:hey do not include operational aspects that may be specific to a -articular application of the model. Tilere a,'a: also be aspects of the one-'rnti.n-. environment that cannot be formulated or cannot be included in of the model. Identifying these cases is a major goal of examining the model
in action in Chapter 5.
The constraints included cover:
(a) the limited amount of subsidy available for the service,
(c) the need to provide a certain level of service due to capacity considerations and/or service policies.
The subsilv constraint is formulated in terms of the difference between the revenue collected and the operating costs. The marginal fare and operating cost in this formulation are assumed constant over all service chanes and for each time period and route, hence the
proportions :of r:'1 fare
mix
are assumed not to vary. In other words service improvements are assumed not to attract proportionally more, for example, pass nidLers or aged passengers. The model also effectivel: ass•uns that there are no economios •f scale from operating -ore buses Jn a1 route.The ca'cuLat iri of the fleet requi red for a particular headw:ay is
based
on an assumption of constant travel times although this may not ,:etime where increased ridership delays buses during boarding and alighting.
A constraint that has been excluded from this set is the preference for integer solutions some bus agencies have in their operating
strategies. This may be due to a desire for clock face headways, but also some operating strategies require integer solutions because little interlining occurs in tLhe scheduling stage. Hence the number of buses allocated to each route in each time period must be an integer.
However, integer optimization methods are far more complex than
continuous optimization methods and with reasonably robust solutions and well behaved objective functions the nearest integer solutions should be good approximations to the optimum integer solution.
The next section describes in more detail the descriptive quality
of these constraints. It looks at how demand variation, the bus
network, operating costs, and bus capacity are, representrd.
2.4: Descriptive Elements of the Model 2.4.1: Demand Variation
In general two areas of deoate exist about representing demand variation in the model. First of all, it is not clear whether fixed or
ivriable demand representation is more appropriate.. SecCrndl', -Pi 1n . need for variable demand representation, an aproprirate form of the Oe-nand function rmust be determinied in order . to cI'cuI te cons: r ' enefits,
social
Denefits, revenue and the capacity constrai-t for aparticular route operation.
If the model is to be applied every three monthis, then the dvra'nics of rirdership change may be such that a steady state will not have been reached b.y the time the next decision is made. Demand in fact may change very little over these
periods
of time. So a need far variable udemand formulations arises from thie extý,nt to wJhic demand carn 'eexpected to vary in three months and the importance of anticipatin a the long term steady state conditions associated with a service change. The dynamic behavior of the system is even more olusive than the steady
state description. However, it is also reasonable that one would expect a certain stabilization to occur after the initial chanze corresponding to the new operating strategy. The demand predictions are iteratively adjusted as the effects of the changes are observed. So the difference
would be that in one case one would approach the variable demand optimal directly, and in the other case the same solution would be reached via a diversion in the direction of the fixed demand solution. The slower
rate of change in the second case will be less beneficial when transition costs are considered in the evaluation.
Clearly, the best model would be flexible enough to represent
bo.th
variable demand and fixed demand (variable demand with zero elasticity) to enable the planner to examine sucri dynamics. Furthermore, since we are able to model both, and the only extra data rcquiremenC is some knwiidge
aiJcut
theelasticit
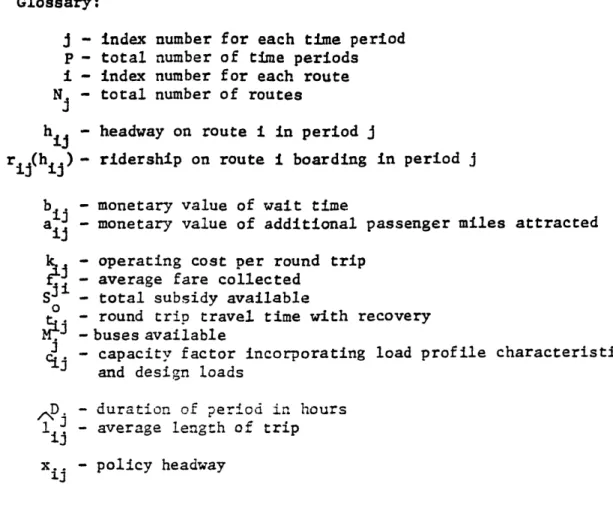
whicni ir not nearly as restrictive as assuning zero elasticity for the fixed demand model, one may as well formulate a variable demand model.The demand function selected is tlie pvot-poiint logit mo-el shown in Figure 2.2. It models ,)nly demand variation that results from
headway,
and hence wait time changes. The elasticity is also encoded ina way that accounts for its exoected variation with trip length. One would expect that for longer
tri&s
the proportion of generalizod cost represented by-wait time is smaller and so these trips would be less elastic with respect to headway changes. Other terms correspondin'g to cross elasticities would be required if the demand is affected byheadway changes on other routes.
The primary feature of the pivot point logit that makes it the most suitable demand function is that it reproduces the observed ridership,
so
that demand variation is considered only from the actual point of observation. This at least ensures that the present steady state43
Figure 2.2:' Pivot Point Logit Demand Function
i
-p
r.. (h ) = L - (1 +-I
* ex (-J( j) * (h..-hO ))) -13 ij O o -J(l) ij .ij ij Glossary: r. (hr..): ij 0 O . ijJ(1..):
ij 13number of riders on route i in period j
obser~ved number of rider,
obser-ed proportion of the t3cal possibie travellars
choosing bus
Elasticity bet-ween the headway and the ridership on route i
average trip length
observed headway on route i
conditions are reproduced in the model. Inaccuracies associated with ridership prediction will increase with the size of the service change. Secondly the loi it function is based o- ) 1isair,;• • ~ •t'ilt
maximizing model which reflects accepted concepts about travel
decisions. The disadvantage arises from having to estimate the modal split term,
2
, which describes the percentage of the potentialmarket that travels by bus currently. This i volves informati' -on, : travel modes other than bus, information wfrich is i,-ss readi' available to the agency.
2.4.2: De.terining Capacit•
Decidin:, when a route is operating at capacity is very crucial. AL
one extreme a perception that all routps are in fact capacity constrai.ned would reduce the allocation problem to one of simpl,)
equalizing load factors. Furthermore, there is a strong indication fro-n current practice that peak load conditions should have a large effect
'>-the decision. The crucial point in modelling capacity is to be able to describe the equilibrium state when the peak demand is just satisfied by
the service the operator supplies. This equilibrium creates the
critical condition that is formulated in the capacity constraint; peak demand must not exceed supply. This still does not indicate what a satisfactory criterion is, however, only how to describe it.
The peak demand is created by a complicated nixture of various aspects of the model. It will, of course, be related to the total ridership on the route, as given by the demand function; but will also