Publisher’s version / Version de l'éditeur:
Vous avez des questions? Nous pouvons vous aider. Pour communiquer directement avec un auteur, consultez la
première page de la revue dans laquelle son article a été publié afin de trouver ses coordonnées. Si vous n’arrivez pas à les repérer, communiquez avec nous à PublicationsArchive-ArchivesPublications@nrc-cnrc.gc.ca.
Questions? Contact the NRC Publications Archive team at
PublicationsArchive-ArchivesPublications@nrc-cnrc.gc.ca. If you wish to email the authors directly, please see the first page of the publication for their contact information.
https://publications-cnrc.canada.ca/fra/droits
L’accès à ce site Web et l’utilisation de son contenu sont assujettis aux conditions présentées dans le site LISEZ CES CONDITIONS ATTENTIVEMENT AVANT D’UTILISER CE SITE WEB.
Internal Report (National Research Council of Canada. Institute for Research in
Construction), 2001-09-01
READ THESE TERMS AND CONDITIONS CAREFULLY BEFORE USING THIS WEBSITE.
https://nrc-publications.canada.ca/eng/copyright
NRC Publications Archive Record / Notice des Archives des publications du CNRC :
https://nrc-publications.canada.ca/eng/view/object/?id=8de1159f-8e33-455a-987e-6a8dbdb0caea https://publications-cnrc.canada.ca/fra/voir/objet/?id=8de1159f-8e33-455a-987e-6a8dbdb0caea
NRC Publications Archive
Archives des publications du CNRC
For the publisher’s version, please access the DOI link below./ Pour consulter la version de l’éditeur, utilisez le lien DOI ci-dessous.
https://doi.org/10.4224/20386144
Access and use of this website and the material on it are subject to the Terms and Conditions set forth at
Renovations of the IRC/NRC acoustical transmission loss facility for
walls, and their effects
Renovations of the IRC/NRC Acoustical Transmission Loss Facility for Walls, and their Effects
Halliwell, R.E.
IR-826
Renovations of the IRC/NRC
Acoustical Transmission Loss Facility
For Walls, and their Effects
IRC Internal Report IR-826
By R.E.Halliwell September 2001
Introduction
Introduction:
In 1997/98, a major refurbishing of the NRC/IRC acoustical test facility for the measurement of sound transmission through walls was undertaken.
This renovation was intended to correct a number of deficiencies with the original test suite, to improve safety and operational efficiency, and to enhance the low-frequency performance of the facility.
As discussed more fully below, the changes included:
• demolishing the existing small reverberation chamber and constructing a larger one
• enlarging the test opening
• replacing the test frames with larger, heavier frames that move on rails, to ensure rapid and accurate placement of the test specimen and reduce the potential for structural flanking due to vibration transmission via the frame.
Because of these changes, it was necessary to perform a series of qualification tests to verify that the facility functions acceptably, and to provide an accurate characterization of any changes in facility performance.
This report describes the changes, and presents results of the systematic testing to assess facility performance.
The report is organized as follows:
Introduction:... 1
Changes to the Reverberation Chambers... 2
Size and Shape of the Chambers ... 2
Wall Specimen Opening ... 3
Wall Specimen Frame ... 4
Measurement System... 6
Commissioning Studies ... 8
Spatial Variance of Sound Field... 8
Effect of Loudspeaker Position ... 11
Limiting Transmission Loss... 14
Flanking Considerations for Test Frames ... 16
Evaluation of "Flanking Shields" ... 19
Bi-directional Measurements ... 22
Comparison of Sound Transmission Results: (Renovated Facility versus Old Facility) 24 ASTM Reference Specimen ... 24
Changes to the Reverberation Chambers
Changes to the Reverberation Chambers
Size and Shape of the Chambers
The original large reverberation chamber, shown at left in Figure 1, has a volume of 250 m3. This room is made of reinforced concrete, 300 mm thick, and is mounted on springs to provide vibration isolation. It was not modified in the renovations of 1997, except that the opening to the test specimen was enlarged.
The original small test chamber, shown at right in Figure 1, was a rectangular room with a volume of 65 m3. This room was made of reinforced concrete, 300 mm thick, and was mounted on springs to provide vibration isolation. The opening for the wall specimen was 2.44 m high by 3.05 m wide, and because of the room geometry, created a tunnel 1.42 m long between the test chambers.
The wall specimen was built into a moveable test frame, which was then moved into the space between the two test chambers. Due to the design of the original test frames changing the frame was a time consuming task, and it was difficult to ensure that there was no coupling between the test frame and either of the two test rooms.
Figure 1:
Original Test Chamber
This drawing shows the plan view and a vertical cross section for the old reverberation chambers, constructed in 1955.
Although this met the essential requirements of both ASTM E90-97 and ISO 140-1:1997, it was felt to be inadequate for studies of low
frequency noise transmission.
250 m3 65 m3 Plan View Cross-Section 6.48 m 7.96 m 4.8 8 m 3.93 m 4. 88 m 2 .9 7 m
Changes to the Reverberation Chambers
Figure 2:
New Test Chambers
The larger (250 m3)chamber is unchanged
except for expansion of the wall opening. The new small chamber, at the right in Figure 2, is non-rectangular and has a
volume of 139 m3. The floor and ceiling of
the chamber are made of reinforced concrete 200 mm thick. The walls are 190 mm concrete blocks filled with mortar during construction. Like the large chamber, the new chamber is mounted on springs sitting on resilient pads. This provides vibration isolation between the test chamber and the rest of the building. Part of the test chamber wall incorporating the test opening (shown with dark shading in Figure 2 and Figure 3) was isolated from the rest of the test chamber. This was done to permit the construction of wall specimens thicker than the 380 mm of the test frame, while still providing structural isolation from the test chamber 5.47 m 8.31 m 5.09 m 2.78 m 3. 28 m 5.09 m 3.48 m 250 m3 139 m3 Plan View Cross-Section 6.48 m 7.96 m 4.88 m
Wall Specimen Opening
The width of the test opening was increased from 3.048 m to 3.658 m, changing the specimen area from 7.44 m2 to 8.92 m2. This is much closer to the area of 10 m2
recommended in ISO 140-1. The new dimensions also provide some benefits for specimen construction:
• The width of the test opening is now a multiple of both 406 mm and 610 mm - the common spacing between studs (measured on center) in North American walls. In the old facility this was not the case - with 406 mm stud spacing, a smaller cavity was inevitable at one or both ends. In this situation, it was necessary to mask off the end section of test specimens, because for small cavities the sound transmission has been shown to depend strongly on stud spacing.
• The height and width of the test opening is also a multiple of 1.22 m, the width of gypsum board sheets. Increasing the area to 10 m2 would have entailed changing the height of the test opening from 2.44 m to 2.734 m, requiring an extra small strip of gypsum board to be added. This was felt to be undesirable, since it is incompatible with the standard height of 2.44 m used in most residential construction, and appreciably increased the complexity and cost of constructing test specimens.
In order to minimize the time during which construction prevents use of the test suite, specimens are built in moveable frames, rather than in situ in the opening between the test chambers. This results in a tunnel or niche between the two rooms, comprising the
Changes to the Reverberation Chambers specimen frame and a matching opening through the wall in each chamber. Studies1 have shown that when a specimen is placed in such a tunnel, the transmission loss is lowest when the specimen is in the middle of the tunnel. The variation is most marked at low frequencies, and is a function of the niche depth. The length of this tunnel was reduced from 1.42 m in the old test suite to 0.96 m, by cutting off the protruding lip around the test opening on the large test chamber, narrowing the test frame, and reducing the wall thickness of the small chamber.
Wall Specimen Frame
Two identical specimen frames can be interchanged in the test opening. Each frame is made from a steel box beam, 0.305 x 0.381 m and filled with concrete. The inside perimeter has a wood liner 38 mm thick, to which test specimens are attached. A cross-section of the test frame and the geometry of the test opening are illustrated in Figure 3. The frames have four 150 mm diameter holes through the top section, which can be used for access to add materials (e.g. concrete in cast in place concrete walls) to a wall
specimen in the test frame, or for utility pipes or wires. These holes are blocked with concrete-filled steel plugs when access ports are not needed. The location of these holes and the dimensions of the test opening are shown in Figure 4.
Figure 3:
Cross-section of test frame, showing frame liner and isolated test room wall.
76 mm 44 mm
Large Chamber Small Chamber
Isolated wall Sealed with resilient damping material 381 mm 216 mm
368 mm 32 mm wood liner on 6 mm neoprene closed cell foam glued to test frame
Inflatable seal Inflatable seal
gap sealed with tape gap sealed with tape
The frames move on a steel rail system with an overhead guide track, shown in Figure 5. This system provides a safe and convenient way to ensure that the specimens are always located at the same position between the test chambers. Despite the weight of the frames (about 5,000 kg empty and 10,000 kg with a wall specimen of 200 mm concrete), the test frames can easily be moved without mechanical aids. One benefit of the easy and rapid change of specimens has been the shift of construction activity to the preparation area outside the chambers, greatly reducing dust inside the chambers and also reducing construction time.
1
Halliwell, R.E.; Warnock, A.C.C. "Sound transmission loss: comparison conventional techniques with sound intensity techniques" Journal of the Acoustical Society of America 77(6), 1985 pp. 2094-2103.
Changes to the Reverberation Chambers
3670 +/- 5 mm (12' 1/2")
2
4
4
6
+
6
m
m
(
8
' 1
/2
")
381 mm C B A Frame A B C mm mm mm South 125 172 291 North 126 172 300 Large Chamber side Small Chamber sideAccess Ports
Cross-SectionFigure 4: Drawing of test frame showing the maximum specimen size. The
test frame opening is 13mm larger, in both dimensions, than the test chamber opening to facilitate the insertion of prefabricated specimens
Changes to the Reverberation Chambers With the test frame in position between the test chambers, air seals are inflated to fill the 13 mm gap between the rooms and the test frame, and provide a resilient seal around the perimeter of the test opening. The 13 mm gap between the frame and the chamber walls is also normally sealed with tape during testing. This system ensures that test specimens are positioned reliably with negligible leakage of airborne sound around the frame, and without significant structural connection that can provide vibration
transmission between the test chambers.
Figure 5:
View of the test frame showing the overhead guide track.
The test frames have a 32 mm thick wood liner to which the test specimen is attached. The liners are glued to a 6 mm thick layer of closed cell neoprene foam, which is glued in turn to the test frame. The wood liner is divided into four unconnected strips to avoid vibration transmission between the layers of a multi-layer specimen, as discussed in detail in the following section on Commissioning Studies.
Measurement System
The original small chamber was equipped with a rotating boom microphone. This was stepped through nine positions to obtain average sound pressure levels and
reverberation times for the test chamber.
The new chamber is equipped with a moving microphone system, shown in Figure 6, having three degrees of freedom and capable of accessing nearly all of the test
chamber. As before, the standard measurement of airborne sound insulation use sound pressure measurements are made at nine positions. However, the new microphone positioning system allows sampling over a much larger volume than was possible with the single rotating boom.
Changes to the Reverberation Chambers
Figure 6:
Microphone positioning system in new small chamber
Figure 7:
Microphone positioning system in large chamber
The new microphone positioning system also provides the capability for conducting detailed scans of the specimen surface, for acoustic intensity measurements to identify the specific contribution of subsystems such as windows placed in a complete wall assembly. This extends the type of tests that can be done on a routine basis.
The large chamber microphone-positioning system, shown in Figure 7 (which allows the microphone to be moved throughout the volume of the room, except the cylindrical space occupied by the rotating vane) remains unchanged except for the upgrading of some components.
Further details of the instrumentation and software used to perform the tests are given in the IRC Quality Assurance documents for these reverberation chambers and the ASTM E90 test procedure.
Commissioning Studies
Commissioning Studies
Spatial Variance of Sound Field
A series of measurements were made to evaluate and minimize the spatial variance in the chamber. Although there is no direct method to determine the diffusivity of a sound field, the spatial variance of the sound level and/or reverberation time is at least a good indicator. The smaller the spatial variance, the more accurate the estimates of the mean sound pressure level or reverberation time from a limited sample of measurements. The ASTM reference specimen for sound transmission loss (sheet steel panels as specified in ASTM E1289) was installed in the test opening and the sound transmission loss was measured using the new small chamber as the receiving room.
Fixed diffusers were added to the room to vary the degree of diffusivity. The number of positions in which it was possible to place diffusing panels was determined by the layout of the room, coupled with the space swept out by the microphone robot. Measurements were made with 0, 2, and 4 diffusers in various orientations and positions about the room. The configurations are tabulated below.
Test Condition 1 Two diffuser panels installed:
• one in upper north-east corner (1.24 m x 1.86 m)
• one on floor along south-east wall (1.24 m x 2.13 m) Test Condition 2 Four diffuser panels installed:
• one in upper north-east corner (1.24 m x 1.86 m)
• one on floor along south-east wall (1.24 m x 2.13 m)
• one upright on west wall (1.24 m x 2.46 m)
• one along north wall (0.93 m x 2.46 m) Test Condition 3
(case selected and shown in Figure 10)
Four diffuser panels installed:
• one in upper north-east corner (1.24 m x 1.86 m)
• one hanging by upper south-east wall (1.24 m x 2.13 m)
• one upright on west wall (1.24 m x 2.46 m)
• one along north wall (0.93 m x 2.46 m) Test Condition 4 Four diffuser panels installed:
• one in upper north-east corner (1.24 m x 1.86 m)
• one upright on floor along south-east wall (1.24 m x 2.13 m)
• one upright on west wall (1.24 m x 2.46 m)
• one along north wall (0.93 m x 2.46 m) Test Condition 5 Two diffuser panels installed:
• one in upper north-east corner (1.24 m x 1.86 m)
• one along north wall (0.93 m x 2.46 m) Test Condition 6 No diffusing panels
Sound pressure level measurements were made at nine points using a single
Commissioning Studies positions were chosen, conforming to the requirements of ASTM E90 and ISO 140-1, and all measurements were made using the same microphone positions.
The standard deviation of the receiving room sound pressure levels for the set of 9 microphone positions in the small chamber was determined for each one-third-octave band. The results are shown in Figure 8. Corresponding standard deviations for reverberation times measured in the small chamber are in Figure 9. There was no obvious correlation between the standard deviation of the receiving room levels and the standard deviation of the reverberation times. Above 160 Hz there was no significant basis for discrimination among the configurations. The standard deviation of the receiving room levels and the reverberation times at lower frequencies were then used as a measure of the relative diffusion in the new chamber.
Figure 8:
Standard deviation of sound pressure levels in the small chamber as a function of the diffusing panel test condition. 0 1 2 3 4 5 6 7 50 63 80 100 125 160 200 250 315 400 500 630 800 1000 1250 1600 2000 2500 3150 4000 5000 6300 Frequency, Hz St d D ev of SPL, dB Test Condition 1 Test Condition 2 Test Condition 3 Test Condition 4 Test Condition 5 Test Condition 6 Figure 9: Standard deviation of reverberation
timesin the small
chamber as a function of the diffusing panel test condition. 0 0.1 0.2 0.3 0.4 0.5 0.6 0.7 50 63 80 100 125 160 200 250 315 400 500 630 800 1000 1250 1600 2000 2500 3150 4000 5000 6300 Frequency, Hz
Std Dev of Reverberation Times, sec
Test Condition 1 Test Condition 2 Test Condition 3 Test Condition 4 Test Condition 5 Test Condition 6
For sound transmission loss measurements, the absorption correction calculated from the reverberation time constitutes a small correction to the receiving room levels. Hence
Commissioning Studies it was felt that reducing the standard deviation of the receiving room levels was more important.
The differences among the six arrangements evaluated were rather small, The following criteria were used to select the best case:
• Three cases (Conditions 2, 4, 6) resulted in a significantly higher standard deviation in the sound levels at 125 Hz. These were discarded, because of the sensitivity of the STC rating system to the level difference at this, and other low frequency bands, for lightweight constructions. (There was negligible difference at other bands relevant to the STC).
• Of the three remaining cases, one (Condition 1) exhibited the highest standard deviation in the receiving room levels. It was also the highest at several frequencies for the reverberation time. This configuration was also eliminated.
• From the remaining two cases (Conditions 3 and 5), the one with the lowest average standard deviation below 125 Hz, (Condition 3), was chosen. The choice between these two configurations was not considered to be critical, because there was no significant difference at 125 Hz and above.
Overall, the presence of the set of diffuser panels does slightly reduce the sources of measurement uncertainty relative to the case without diffusers.
The selected configuration is shown in Figure 10.
Figure 10:
Plan of the small chamber showing final diffuser locations. The shaded diffusers are hanging from the ceiling, the other two are resting on the floor. 1 2 3 4 1 2 2 3 4
Commissioning Studies
Effect of Loudspeaker Position
ISO 140-3 contains a procedure for determining the optimum number and position of loudspeakers in the source room. There is no corresponding qualification procedure in the ASTM E 90. Hence the ISO procedure was used as the basis for evaluation. Since it is normal practice in the IRC laboratory to make measurements in both
directions through the test specimen, this procedure was applied to both test chambers. The procedure (given in Annex C of ISO 140-3) involves measuring the level difference between the two rooms for each of the loudspeaker positions under consideration, and determining the standard deviation over all loudspeaker positions.
Figure 11:
Loudspeaker positions – solid coloured speakers are mounted from the ceiling. Position 5 in the small chamber is the same as position 2 but with the
loudspeaker tilted up and position 4 is directly above position 1. 1 3 5 6 7 8 1 2 5 7 8
The tests were carried out with a small specimen having low sound insulation, mounted in a filler wall. Such a configuration has been found to be most sensitive to the position of the sound sources. For these tests a single layer of mass loaded vinyl with an area of 2.145 m2 was used. Diffusers were installed in the previously identified case 3
configuration.
A set of loudspeaker positions that satisfy the requirements of ISO 140-3 (shown in
Figure 11) were chosen in each chamber. An additional loudspeaker configuration was
defined for each chamber by the simultaneous operation of four loudspeakers at positions 1, 2, 3, and 4 (with independent incoherent source signals). For each loudspeaker position or configuration, the sound level difference was determined by measuring the average sound pressure over nine microphone positions in each room. The mean sound pressure level difference and spatial standard deviation were
determined for the set of individual loudspeaker cases in each chamber. Condition C.3 of ISO 140-3 requires a minimum of 2 loudspeaker positions; a larger number may be required depending on the standard deviation in the measured level differences.
For each loudspeaker position j, Annex C of ISO 140-3 requires that the sum (Sj ) of the
Commissioning Studies be calculated. An extended version including frequency bands down to 50Hz was also determined. The results are listed in Table 1 and Table 2 below.
Table 1:
Deviation of level difference for each loudspeaker position in the small chamber, relative to the mean for all individual positions tested. Sj (the sum of squares of these
deviations) is listed for a sum over the bands from 100 to 315 Hz (as required in ISO 140-3) and with the frequency range extended down to 50 Hz.
Loudspeaker Frequency Position 100 125 160 200 250 315 Sj (100-315) Sj (50-315) 1 3.12 0.78 0.17 1.97 0.06 0.13 4.40 7.83 2 0.00 0.12 0.01 0.12 0.00 0.04 0.58 11.09 3 2.79 0.03 0.00 2.07 0.85 0.40 4.37 54.50 4 0.40 0.15 0.26 0.07 0.14 0.06 0.50 12.26 5 0.01 0.00 0.27 0.71 0.01 0.04 1.45 17.48 6 6.13 1.14 0.23 0.35 0.33 0.01 11.91 31.19 7 3.56 0.58 1.75 1.77 0.33 0.44 6.11 11.74 Set of Four 1.01 0.20 0.00 0.02 0.07 0.03 0.36 2.24 Table 2
Deviation of level difference for each loudspeaker position in the large chamber, relative to the mean for all individual positions tested. Sj (the sum of squares of these
deviations) is listed for a sum over the bands from 100 to 315 Hz (as required in ISO 140-3) and with the frequency range extended down to 50 Hz.
Loudspeaker Frequency Position 100 125 160 200 250 315 Sj (100-315) Sj (50-315) 1 1.76 0.26 0.00 0.00 0.13 0.06 2.23 10.84 2 9.04 0.01 0.00 0.09 0.17 0.00 9.31 37.42 3 1.05 0.54 1.38 0.39 0.01 0.09 3.47 6.64 4 0.82 0.93 1.81 0.17 0.04 0.05 3.82 7.81 5 0.03 0.33 0.26 0.06 0.18 0.23 1.09 36.14 6 0.58 0.09 0.07 0.06 0.01 0.04 0.84 17.07 7 3.98 0.00 0.07 0.06 0.02 0.09 4.21 23.82 8 0.28 0.04 0.03 0.17 0.33 0.08 0.93 35.77 Set of Four 0.15 0.01 0.00 0.00 0.00 0.00 0.17 2.55
Annex C of ISO 140-3 deals with only a simple subset of the measurement options permitted by the test method. In the simple case, where only one of the rooms is used as the source room and a single loudspeaker is used, the loudspeaker positions with the smallest values of Sj should then be chosen as the test positions.
Commissioning Studies However, ISO 140-3 identifies several possible extensions beyond the basic equipment and procedure required by the standard, and some of these are used for the IRC facility. In particular, the option of using multiple loudspeakers simultaneously driven by
incoherent sources is explicitly identified. In this case, presumably the system would satisfy the intent of Annex C of ISO 140-3 if the value of Sj for the set of loudspeakers
were lower than that for the individual loudspeaker positions. This was the case. The values of Sj for the sets of four incoherent loudspeakers were much lower than those for
any individual loudspeaker, and thus these two 4-speaker configurations provide better performance than the basic requirements of the annex.
It is interesting to note that only one of the four individual loudspeaker positions routinely used in the large chamber (positions 1 to 4) was among the four test positions with the lowest Sj. In the new small chamber three of the four positions chosen for operational
reasons were found to be in the lowest four.
The IRC instrumentation and procedure offer several benefits:
• The use of four incoherent loudspeakers reduces the region affected by the direct field of each loudspeaker, because the reverberant field in the source room combines the sound power from all four loudspeakers. Hence the effect of
loudspeaker directionality and biased measurements at positions near a loudspeaker are lessened.
• Measuring in both directions (i.e.- using each room in turn as the source room and averaging the sound transmission loss results) automatically compensates for any error in calibration of microphones, and averages out bias due to modal response at the selected microphone positions. This is discussed further in the section on bi-directional measurements.
Note: Similar measurements made using the ASTM reference specimen showed that the ordering of the loudspeaker positions was a function of the test specimen, suggesting that the ISO procedure may not be a good test of loudspeaker position.
Commissioning Studies
Limiting Transmission Loss
One of the characteristics that must be established at each frequency is the facility limit -that is, the maximum transmission loss -that can be measured. This limit is controlled by three factors:
• sound level in the source room.
• background noise level in the receiving room.
• structural and airborne flanking paths.
Ideally the limit imposed by any structural flanking path should be significantly greater than the limit imposed by the source and background levels. In practice, the flanking paths appear to limit transmission loss in this facility.
Figure 12 illustrates what happens as a specimen's apparent transmission loss
approaches the test facility limit.
The specimen has two rows of 92 mm structural steel studs, placed 165 mm apart. The studs in each row were spaced 610 mm on centre and the entire cavity was filled with glass fibre insulation. Layers of 16 mm type X gypsum board were mounted on resilient channels attached parallel to the studs. Measurements were made after the addition of each layer of gypsum board, up to four layers on each side.
It is clear that the change in apparent transmission loss is less for each doubling of the layers, particularly in the 1000 Hz and 1250 Hz bands. Another noteworthy feature is the disappearance of the coincidence dip. The final test in the sequence has the test opening covered with a heavy steel door 330 mm from the surface of the wall specimen and the resulting cavity filled with glass fibre insulation. This sequence shows how the apparent transmission loss converges to the limiting curve as the transmission loss of the wall specimen approaches and exceeds the facility limit.
Figure 12:
Apparent Transmission loss for a double steel stud wall with one to four layers of gypsum board on each side, ending with the sliding door between the test chambers closed. As transmission loss through the wall increases, flanking transmission via other paths limits the apparent
transmission loss. 20 30 40 50 60 70 80 90 100 63 125 250 500 1k 2k 4k Frequency, Hz Appa re nt Tr a n s m is s ion Los s , dB
4 layers each side and sliding door closed STC 81 4 layers each side STC 79
3 layers each side STC 78 2 layers each side STC 75 1 layer each side STC 64
Commissioning Studies
Figure 13 shows the apparent transmission loss measured with the sliding door closed
for two of the walls used in the sequence. The first had four layers of gypsum board on each side and the deep cavity between the specimen and the door filled with glass fibre, and the other had two layers of gypsum board on each side and no insulation in the door cavity.
Figure 13:
Apparent Transmission loss measurements with the sliding door closed, to establish the facility limit 40 50 60 70 80 90 100 63 125 250 500 1k 2k 4k Frequency, Hz Appa re nt Tr a n s m is s ion Los s , dB
2 + 2, door closed, no insulation STC 81 4 + 4, door closed, with insulation STC 81
If the direct airborne path through the specimen were the dominant path, then adding weight to the wall and absorption to the cavity between the specimen and the additional door panel would increase the measured transmission loss. No significant difference is observed between the two measurements. This indicates that the apparent sound transmission loss was controlled by flanking transmission via structure-borne paths, rather than by the direct air-borne path through the test specimen.
This establishes the highest transmission loss that can be measured in this facility. If airborne sound transmission through a wall specimen approaches this limit, the apparent sound transmission loss will be lower than the true performance of the specimen.
For purposes of ISO140-3, the maximum sound reduction index that can be measured without significant flanking (R'max as specified in Annex A of ISO 140-1) is obtained by
subtracting 6 dB from the highest sound transmission loss value at each frequency in
Commissioning Studies
Flanking Considerations for Test Frames
The test frames were originally built with the wood liner attached directly to the test frame as shown at left in Figure 14
Figure 14:
Test frame with 37 mm thick wood liner bolted to test frame.
Left: first version, with wood lining bolted directly to metal surface of the frame.
Right: second version with resilient rubber layer between wood and frame.
38 mm wood liner bolted to test frame
32 mm wood liner glued to 6 mm neoprene foam that is glued to test frame
It was believed that the change in impedance between the specimen and the test frame would ensure negligible vibration transmission despite the coupling between the test specimen and the test frame. This was not the case. Figure 15 compares sound
transmission through a double stud wall when mounted directly to the original wood liner, or with sill gasket placed between the stud assembly and the wood liner. There is clear evidence that sound energy was being transmitted from one row of studs to the other via the connection through the test frame.
Figure 15:
Effect of adding a resilient layer between the stud assembly and test frame, for a wall assembly with two rows of studs, installed on the frame lining shown at left in Figure 14. 0 10 20 30 40 50 60 70 80 90 63 125 250 500 1k 2k 4k Frequency, Hz T ra n s m is s io n L o s s , d B
Solidly mounted sole plates Sole plates mounted on sill gasket
The test frames were then rebuilt with 13 mm of closed cell neoprene foam installed between the wooden liner and the steel frame as shown at right in Figure 14.
Commissioning Studies In the case of single stud walls built on a single section of the liner (Figure 16) it was found that there was another problem. Walls built so that a small part of the liner was exposed on both sides of the wall were compromised by a flanking path through the liner. Shielding the liner in either chamber effectively broke this path, but a more permanent solution was to split the liner so that the two exposed faces were no longer connected.
Figure 16:
This shows effect of shielding the exposed frame liner. 0 10 20 30 40 50 60 70 80 63 125 250 500 1k 2k 4k Frequency, Hz T ran smi ssi o n L o ss, d B
Flanking shields installed No flanking shields installed
With the wood liner sections mounted on closed cell neoprene foam, the lack of any physical connection between the wood sections becomes very important. Figure 17 shows the severe degradation of the mid-frequency TL for a double stud wall when the gap between liner sections was partially bridged by a bead of caulking. With caulking in the gap, the transmission loss was lower than that observed in Figure 14 for the case with the rigidly-mounted liner.
Figure 17:
This shows the effect of bridging the two parts of the liner for a double stud wall
0 10 20 30 40 50 60 70 80 90 100 63 125 250 500 1k 2k 4k Frequency, Hz T ran smi ssi o n l o ss, d B
Liners not joined
Sill gasket between studs and liner, no gasket under liner Liners joined with bead of caulking
Commissioning Studies Removing the accidental connection due to the caulking between the liner sections increased the transmission loss, to better than had been observed with sill gasket isolating the studs from the direct-mounted liner. The result with the sill gasket between the stud assembly and the liner (also shown in Figure 17) exhibited lower transmission loss above 3 kHz. Presumably this is due to transmission via the point connections where screws secured the studs to the liner through the sill gasket. With the liner sections glued over the resilient material, an improvement of 5 dB was evident at 3kHz and higher.
Comparisons with the results obtained in the laboratory before the renovation are given in the later section on Comparison of Sound Transmission Results.
To attenuate any residual radiation from the surface of the test frame, caused by
coupling between the test specimen and the test frame, the frame liner was extended to cover the entire width of the test frame as shown in Figure 18. Additional cuts were made to separate the sections of the liner, so common multiple-leaf assemblies could be mounted without a flanking path caused by the liner exposed on both sides of the wall assembly. Pertinent dimensions are identified in Figure 4.
Figure 18:
Final configuration of the test frame showing liner extended to cover entire test frame
32 mm wood liner on 6 mm neoprene closed cell foam glued to test frame
38 mm wood liner bolted to chamber opening
Commissioning Studies
Evaluation of "Flanking Shields"
To determine whether radiation from the test frame constituted a significant problem, a series of walls were built in the test frame, close to the large chamber edge. These walls formed a progression - from a single layer of 16 mm gypsum board (STC 27), up to a wall with resilient channels on both sides of the studs, supporting multiple layers of gypsum board (STC 57). Each wall was measured with and without shields covering any exposed area of the test frame.
Figure 19:
Test frame showing a "flanking shield" installed to mask the exposed surface of the frame liner.
Flanking Shield: 16 mm particle board over 16 mm glass fibre
Figure 20 shows the change in transmission loss observed for the test walls.
The specimens are identified in the legend of Figure 20, using a short hand description, for which the key is given below:
Surface Layers: nGxx ‘n’ layers of gypsum board with nominal thickness ‘xx’ mm
Framing WSxx(ss) Wood studs with a nominal depth of ‘xx’ mm spaced ‘ss’ mm apart.
RCxx(ss) Resilient channels with a thickness of ‘xx’ mm and
spaced ‘ss’ mm apart.
Inter-stud Cavity GFBxx Glass fiber batts with nominal thickness ‘xx’ mm. Note that for this key, all dimensions are rounded to the nearest millimetre. Thus, for example 12.7mm gypsum board is listed as G13.
If radiation from the test frame was an important flanking path, then the transmission loss should increase when the shields are added, and this effect should be more pronounced for walls with higher transmission loss.
Commissioning Studies
Figure 20:
Change in transmission loss produced by the addition of flanking shields, for series of gypsum board wall assemblies. -3 -2 -1 0 1 2 3 4 5 63 125 250 500 1k 2k 4k Frequency, Hz C h an g e i n tr an sm issi o n L o ss, d B WS89(406)_G16 G16_WS89(406)_G16 G16_RC13(406)_WS89(406)_G16 G16_RC13(406)_WS89(406)_GFB89_G16 G16_WS89(406)_GFB89_RC13(406)_G16 2G16_RC13(406)_WS89(406)_GFB89_G16 3G16_RC13(406)_WS89(406)_GFB89_G16 3G16_RC13(406)_WS89(406)_GFB89_RC13(406)_G16
There is no clear trend of increasing benefit due to the added shields as transmission loss of the wall specimen increases. Most walls show improvement at some frequencies and lower transmission loss at other frequencies. Many of the better walls actually show a decreased transmission loss at most frequencies due to addition of the "flanking shields".
Figure 21 shows the transmission loss for the series of walls tested without "flanking
shields".
Figure 21:
Transmission loss for the test walls measured without flanking shields installed. 10 20 30 40 50 60 70 80 90 63 125 250 500 1k 2k 4k Frequency, Hz T ran sm issio n L o ss, d B WS89(406)_G16 G16_WS89(406)_G16 G16_RC13(406)_WS89(406)_G16 G16_RC13(406)_WS89(406)_GFB89_G16 G16_WS89(406)_GFB89_RC13(406)_G16 2G16_RC13(406)_WS89(406)_GFB89_G16 3G16_RC13(406)_WS89(406)_GFB89_G16 3G16_RC13(406)_WS89(406)_GFB89_RC13(406)_G16
If radiation from the test frame were a significant flanking it should be revealed as a limiting transmission loss in Figure 21, as the transmission loss of the test wall is increased. The results show no clear evidence of approaching a limiting transmission loss caused by this or any other flanking path.
Commissioning Studies It is clear from Figure 20 that there is an effect due to the addition of flanking shields. However, there is no evidence to support the premise of flanking through the test frame. The observed effects are not fully understood, but are believed to be associated with a modification of edge conditions around the perimeter of the test specimen.
Based on the lack of any clear indication of flanking through the frame, and the somewhat erratic behaviour caused by the addition of the shields, it was decided that these shields would not be used.
The results provide no indication of frame surfaces acting as flanking elements that radiate significant sound power.
Commissioning Studies
Bi-directional Measurements
The size and shape of the two chambers that comprise the test suite are quite different, and the position of the test opening with respect to the adjoining walls also differs. These differences create a measurement system that is quite asymmetric. Asymmetry results in differences in the modal coupling between the sound field in each test chamber and the specimen in the test opening.
The differences in coupling cause differences in the sound transmission loss at low frequencies, for measurments in different directions through the specimen (i.e. with the sound source in the large or in the small chamber). To reduce the bias due to room response, measurements are routinely made in both directions and then averaged.
Figure 22 shows the mean difference between transmission loss results measured in the
two directions, averaged over all test results for two sets of data:
1. 44 wall specimens measured during 1997 in the old test suite, and 2. 15 wall specimens measured to date in the new test suite.
For the new facility the difference between the two directions of measurement is generally smaller than that typical of the old facility, and is less than 0.5 dB for all frequency bands above 80 Hz. At the lowest frequencies, much larger differences are evident; with the new facility these large variations are shifted to frequencies below the 100Hz band.
Figure 22:
Plot showing the difference between the transmission loss measured in two directions, averaged over a number of measurements. -8 -6 -4 -2 0 2 4 6 63 125 250 500 1k 2k 4k Frequency, Hz Tr a n s m is s ion Los s , dB
new facility mean 1997 old facility mean
Figure 23 shows the standard deviation of the difference between forward and reverse
transmission loss, for the same data set. Again it is evident the deviation is reduced for most of the frequency bands above 80 Hz. The shift of the large deviations to lower frequencies is again evident (such as the shift of the large peak from 100 Hz to 63 Hz).
Commissioning Studies Figure 23: Standard deviation of the difference between forward and reverse transmission loss measurements 0.0 0.5 1.0 1.5 2.0 2.5 3.0 3.5 63 125 250 500 1k 2k 4k Frequency, Hz S ta nda rd D e v ia ti on, dB new facility SD 1997 old facility SD
From this it can be concluded that for frequencies above 80Hz (the normal range for standard methods) the increased room volume and specimen size in the new facility has increased the low frequency accuracy relative to that for the original facility.
Comparison of Sound Transmission Results
Comparison of Sound Transmission Results:
(Renovated Facility versus Old Facility)
The facility had been used for numerous major series of measurements before the renovation, and reports presenting the data from those studies have been published and widely circulated. In order to relate measurements after the renovation to the pre-renovation database, some systematic comparisons have been made.
ASTM Reference Specimen
Figure 24 shows sound transmission loss data for the reference specimen defined in
ASTM E1289. This specimen is a single layer of 24 gauge (0.71 mm) steel. It has been used for an inter-laboratory round robin by ASTM Committee E33, and has been re-tested periodically in the IRC facility.
Figure 24:
Measured sound transmission loss of the ASTM E1289 reference specimen. The solid line is for one installation in the renovated test suite, and the dashed lines show the mean plus and minus one
standard deviation for all measurements in the old test suite with this wall re-installed at
various times 0 5 10 15 20 25 30 35 40 45 63 125 250 500 1k 2k 4k Frequency, Hz T ran smi ssi o n L o ss, d B
Figure 24 shows the transmission loss for the ASTM reference wall measured in the new
test suite, relative to data for the same specimen tested in this laboratory in periodic evaluations of the facility before renovation. The dashed lines show the range of plus/minus one standard deviation about the mean, for the set of results before the renovation. The results with the new facility clearly fall within the range characteristic of the old facility.
For an individual measurement in the facility, one would expect qualitatively that the results would fall within this range 67% of the time (i.e. - for the 22 frequency bands measured, typically 7 would fall outside the dashed curves). This assumes a normal "bell curve" distribution, and treats the levels for individual frequency bands as
Comparison of Sound Transmission Results statistically independent. In practice, results in adjacent bands are not completely
independent, so deviations are rather consistent for adjacent bands. Overall, the results for the renovated facility satisfy this criterion, which suggests there has been no
significant change.
Once these facility evaluation measurements have been repeated enough times to create a statistically meaningful sample (as part of the annual quality assurance process), more rigorous statistical tests can be applied, to provide a more sensitive comparison of the mean curves.
Results for the reference specimen can also be used to compare the renovated facility with other laboratories.
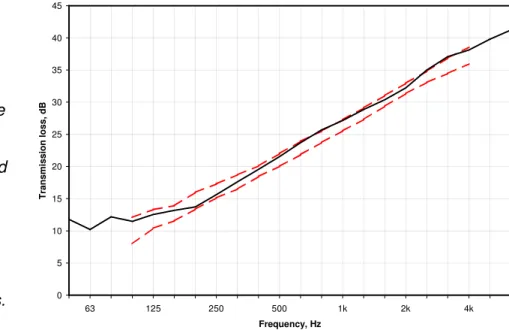
Figure 25 shows the mean transmission loss for the ASTM reference wall measured in
the new test suite, relative to data for nominally identical specimens tested in a round robin comparison study of North American testing laboratories, conducted by ASTM Committee E33 in 1985.
The ASTM study only provides data down to 100 Hz, but considering the variation in size among the laboratories it is likely that the standard deviation would increase rapidly at low frequencies (and readily encompass the results for the new facility at these very low frequencies).
Figure 25:
Measured
transmission loss for the ASTM E1289 reference specimen in the new test suite. The dashed lines are the mean plus and minus one standard deviation of the results in the inter-laboratory round robin2 of 1985, which included 9 North American testing laboratories. 0 5 10 15 20 25 30 35 40 45 63 125 250 500 1k 2k 4k Frequency, Hz Tr ansmission loss, dB
It can be seen from Figure 25 that the IRC facility is also very near the mean of those evaluated in the ASTM Round Robin. These results show that the renovated IRC chambers are fully consistent with other North American facilities.
2
Comparison of Sound Transmission Results
Wood-framed Wall Assemblies
To provide further confidence in the reliability of the measurements, comparisons have been made between measurements in both the old and new test suites for several wall constructions.
The data shown in Figure 26 were from nominally equivalent walls whose gypsum board surfaces were mounted directly on one side of the wood studs, and on resilient channels on the other side. The data from the old test suite were from six walls with gypsum board from the same manufacturer, having surface densities in the range 45.13 - 45.54 kg/m2 and STC in the range 56 to 59. The walls tested after the renovation had nominally matching construction details. The only obviously significant difference is that the gypsum board in the post-renovation assembly had a surface density of 44.0 kg/m2.
Figure 26:
Transmission loss of a wood stud wall (studs 406 mm o.c and glass fibre insulation in the cavity) with resilient channels on one side, and two layers of 15.9 mm type X gypsum board on each side. The dotted lines are the mean plus and minus one standard
deviation for the set of results obtained in the old test suite.
0 10 20 30 40 50 60 70 80 63 125 250 500 1k 2k 4k Frequency, Hz Tr ansmission Loss, dB TLA-98-162a STC 58 TLA-99-113a STC 58
The STC of 58 observed after renovation is within the range observed for nominally equivalent specimens from before. The curves do not agree as well as those reported above for the ASTM reference specimen. In particular, the transmission loss appears to be slightly lower in the new facility at most mid and high frequencies. The lighter weight of the gypsum board could explain a reduction in transmission loss of approximately 0.5 dB, but the observed changes are considerably larger than that. Below 160 Hz, the results appear to be slightly higher for the new facility.
Another case, with a different stud assembly, is illustrated in Figure 27. All of the wall assemblies whose sound transmission results are shown here had nominally identical construction details and used type X gypsum board from the same manufacturer. The four walls used to provide the data from the old test suite had surface densities ranging from 21.8 to 21.9 kg/m2 and STC in the range from 48 to 49. The two tests done in the
Comparison of Sound Transmission Results new suite have densities of 22.2 and 22.0 kg/m2, and the STC values are slightly higher. As in Figure 26, there are noticeable differences in the measurements after the
renovation.
Figure 27:
Transmission loss for two single wood stud walls with resilient channels on one side. There is one layer of 15.9 mm type X gypsum board on each side and glass fibre insulation in the cavity. The studs are spaced 610 mm o.c. The dotted lines are the mean plus and minus one standard deviation for the set of results obtained in the old test suite.
0 10 20 30 40 50 60 70 63 125 250 500 1k 2k 4k Frequency, Hz Tr ansmission Loss, dB TLA-98-130a STC 51 TLA-98-122a STC 51
One aspect of the change in the low frequency behaviour of the test suite appears to be a tendency towards increased low frequency transmission loss. For wall assemblies where the STC value is controlled by the low frequency performance, usually at 125 Hz, this may result in a small increase in the STC rating.
It must be stressed that this is not a result of changed testing or construction
procedures, but it is indicative of the difficulties associated with making measurements at low frequencies. This is reflected in the range of sizes and shapes of test chambers at different testing laboratories, and the accompanying range in measured results, even on carefully controlled specimens such as the ASTM E1289 reference wall. The current state of knowledge is such that not all factors affecting the measurement of sound through a partition are fully controlled in standard measurements of sound transmission loss.
These results highlight the difficulties associated with using a single number rating (STC) for what is really a very complex phenomenon.
Acknowledgement
The author wishes to acknowledge J.D.Quirt, A.C.C.Warnock, T.R.T.Nightingale, J.S.Bradley, and J.A.Birta for their many contributions, both in discussions and the collection of data.