Publisher’s version / Version de l'éditeur:
ASCE Journal of the Structural Division, 97, ST9, pp. 2173-2187, 1971-09
READ THESE TERMS AND CONDITIONS CAREFULLY BEFORE USING THIS WEBSITE.
https://nrc-publications.canada.ca/eng/copyright
Vous avez des questions? Nous pouvons vous aider. Pour communiquer directement avec un auteur, consultez la première page de la revue dans laquelle son article a été publié afin de trouver ses coordonnées. Si vous n’arrivez pas à les repérer, communiquez avec nous à [email protected].
Questions? Contact the NRC Publications Archive team at
[email protected]. If you wish to email the authors directly, please see the first page of the publication for their contact information.
NRC Publications Archive
Archives des publications du CNRC
This publication could be one of several versions: author’s original, accepted manuscript or the publisher’s version. / La version de cette publication peut être l’une des suivantes : la version prépublication de l’auteur, la version acceptée du manuscrit ou la version de l’éditeur.
Access and use of this website and the material on it are subject to the Terms and Conditions set forth at
Statistical treatment of peak gusts on cladding
Dalgliesh, W. A.
https://publications-cnrc.canada.ca/fra/droits
L’accès à ce site Web et l’utilisation de son contenu sont assujettis aux conditions présentées dans le site
LISEZ CES CONDITIONS ATTENTIVEMENT AVANT D’UTILISER CE SITE WEB.
NRC Publications Record / Notice d'Archives des publications de CNRC:
https://nrc-publications.canada.ca/eng/view/object/?id=2eca6f6b-dfba-4dbd-8bd2-d859d8c245aa
https://publications-cnrc.canada.ca/fra/voir/objet/?id=2eca6f6b-dfba-4dbd-8bd2-d859d8c245aa
Ser
TH1
N21r2
no. 486
c.
2
ATIONAL RESEARCH COUNCIL OF CANADA
BLDG
;EIL NATIONAL D E RECHERCHES DU CANADA
STATISTICAL T R E A T M E N T OF PEAK GUSTS
ON CLADDING
by
W.
A. Dalgliesh
4
Reprinted from
American Society of Civil Engineers
Journal of the Structural Division
Vol. 97, No. ST9, September 1971
p. 2173-2187
Research Paper No. 486
of the
Division of Building Research
OTTAWA
C
N ~ T I O N A L RESEARCHSeptember 1971
YANAJQLYSE
STATISTIQUE DES
PRESSIONS DYNAMIQUES
D E P O I N T E S U R L E S PANNEAUX D E R E V E T E M E N T
S O M M A
I R E
Les m6thodes statistiques de prddiction des effets dynamiques d u
vent sur la structure des immeubles de grande hauteur sont de plus en
plus reconnues. I1 est possible d'utiliser des mdthodes semblables pour
les surcharges de vent sur les panneaux de revdtement
6
condition de
tenir compte de certaines diffe'rences telles que le degrd d'exposition,
les dimensions e t les caract6ristiques dynamiques des 616ments en
cause. Les pressions e t les succions d u vent enregistrdes
2
plusieurs
endroits sur u n immeuble de grande hauteur durant une p6riode de
grands vents sont utilise's pour prddire les efforts dynamiques de
pointe sur les fenetres e t les panneaux de revetement. L'article ex-
amine la m6thode de pr6dire les effets dynamiques de pointe fondde
sur le processus al6atoire. Les pressions dynamiques de pointe telles
que mesurCes sont compardes aux valeurs calculdes par la mCthode
usuelle d u coefficient de majoration pour la pointe de rafale e t
i
celles
obtenues par une m6thode plus d6taillde des effets de la vitesse de
pointe instantan6e. I1 apparait que cette derniGre m6thode doit Gtre
pr6f&rde, parce qu'elle est plus conforme au phdnom6ne de pression
dynamique de pointe. Cependant, il faudra une exphrimentation plus
poussde e t des relevCs additionnels avant d'en arriver
i
dtablir de
a
fij ;%, 5 3i8 7 :- q8356 September, 1971 ST 9
Journal of the
STRUCTURAL DIVISION
Proceedings of the American Society of Civil Engineers
STATISTICAL TREATMENT O F PEAK GUSTS ON CLADDINGa By W. Alan Dalgliesh,' A. M. ASCE
INTRODUCTION
F r o m a practical point of view, the best m e a s u r e of wind depends on me- teorological r e c o r d s , often mean wind speed averaged over a few minutes o r a n hour. F o r cladding design, however, the mean speed is not adequate. In- stead, gust effects m u s t be determined, i.e., the maximum p r e s s u r e o r s u c - tion that can reasonably be expected to occur during the expected lifetime of the cladding.
Translation f r o m mean wind speed to mean p r e s s u r e is a relatively straightforward procedure involving mean p r e s s u r e coefficients derived from model t e s t s i n a wind tunnel. A m o r e difficult problem a r i s e s in the deter- mination of wind turbulence effects. Anemometer r e c o r d s show random fluc- tuations about the mean speed and, similarly, r e c o r d s of p r e s s u r e measured on cladding indicate a continual random variation. One solution to this problem
is to r e l a t e the mean wind speed to the maximum gust r e g i s t e r e d within a given time by a fast-response anemometer. T h i s relation, a wind gust factor,
is used to convert the mean speed to a gust speed for use in design (6,7). The l a t t e r solution is inadequate for s t r u c t u r a l design of tall, slender buildings. The response of such s t r u c t u r e s to wind turbulence i s s o unlike the response of a n e m o m e t e r s that gust factors derived from them a r e completely unsuitable f o r predicting design loads. Thanks to nearly 10 y r of r e s e a r c h , wind gust effects on the s t r u c t u r a l f r a m e of tall buildings c a n now be esti- mated by means of gust loading factor methods (4,8,9). The gust loading factor is based on the statistical c h a r a c t e r i s t i c s of wind turbulence, the mean wind speed profile, and the s i z e and dynamic properties of the s t r u c t u r e .
Note.-Discussion open until February 1, 1972. To extend the closing date one month, a written request must be filed with the Executive Director, ASCE. This paper i s part of the copyrighted Journal of the Structural Division, Proceedings of the Amer- ican Society of Civil Engineers, Vol. 97, No. ST9, September, 1971. Manuscript was submitted for review for possible publication on May 13, 1970.
apresented a t the April 6-10, 1970, ASCE National Meeting on Structural Engi- neering, held at Portland, Ore.
l Research Officer, Division of Building Research, National Research Council of
2174 September, 1971 ST 9 In principle, one would not expect the simple wind gust factor approach to be entirely suitable for cladding design, although s o f a r there h a s not been the s a m e c l e a r indication of inadequacy in practical situations. Most wind damage affects roofing o r cladding and, although i t is usually difficult to fix the responsibility for damage on the design p r e s s u r e s used, improved under- standing of cladding loads and better methods of design a r e obviously worth pursuing.
Despite the r e s e a r c h already done, information on m e a s u r e d gust p r e s - s u r e s oncladding is relatively h a r d to find. The purpose of this paper i s two- fold, therefore: (1) To p r e s e n t a s u m m a r y of s t a t i s t i c a l information derived f r o m actual p r e s s u r e measurements on a tall building; and (2) to analyze the implications of this information with r e g a r d to a gust effect factor suitable for cladding design.
FIELD MEASUREMENTS
The Division of Building R e s e a r c h of the National Research Council of Canada s t a r t e d a program of wind p r e s s u r e measurements on tall buildings in 1962 to check available information used in wind load design. One of the main applications f o r the full-scale data was the checking of the validity of wind tunnel testing techniques (2); full-scale measurements a r e now examined directly to provide insight into the nature of gust action over localized a r e a s of one tall building.
A 45-story office tower in Montreal (Fig. 1) was instrumented in Septem- ber, 1968 with s i x p r e s s u r e transducers on each of two mechanical equipment floors. Each transducer m e a s u r e s the difference i n a i r p r e s s u r e betweena mea- s u r i n g a n d a r e f e r e n c e port by means of a s t e e l diaphragm, the deflection of which c a u s e s a proportional voltage in a s t r a i n gage bridge circuit. The measuring p o r t s were connected by s h o r t plastic tubes to the outside a i r through 1/8-in. holesinthespandrelpanels; a n d a l l 12 r e f e r e n c e p o r t s w e r e connected by long plastic tubes to a common c e n t r a l location on the 40th floor.
A plan view of the locations of the 1/8-in. holes, the s a m e for both levels, is given in Fig. 2. Locations on the upper mechanical floor (545 ft above the s t r e e t ) a r e designated a s shown in Fig. 2 with a one prefixed to indicate the level (e.g., 1W1 and 1W2) and t h o s e on the lower mechanical floor (195 ft above the s t r e e t ) a r e designated a s belonging to level 2.
The signals from each of the 12 transducers w e r e transmitted to a digital dataacquisition s y s t e m located on the upper mechanical floor. Wind direction and speed signals were transmitted f r o m a wind vane and anemometer on a n existing m a s t on the roof. Fourteen channels of information w e r e scanned e v e r y 1/2 s e c and recorded digitally on computer-compatible magnetic tape.
Half-hour r e c o r d s w e r e initiated automatically when the wind speed reached a p r e s e t limit, and a f t e r 10 months of operation m o r e than 30 h r of r e c o r d s with mean s p e e d s (at the 800-ft level) ranging f r o m 30 fps to 80 fps w e r e collected. The present study is based on 20 o r s o hours, representing winds f r o m the five wind directions shown in Fig. 2. Typical recorded time histories a r e shown in Fig. 3 for three locations on the upper level, 1W3 (windward), IN2 (sidewall, glancing wind) and 1 E l (leeward).
Definition of T e r m s . - P r e s s u r e s a r e s u m m a r i z e d in t e r m s of mean and r m s ( r m s about the mean value) p r e s s u r e coefficients. Peak p r e s s u r e s a r e
ST 9 CLADDING 2175 plotted a s histograms, o r observed probability distributions, of a reduced random variable to be defined in this section. Unless otherwise noted, a l l p r e s s u r e coefficients a r e based on the mean dynamic p r e s s u r e of the wind
FIG. 1.-SOUTH-EAST ELEVATION OF 45-STORY OFFICE BUILDING, MONTREAL,
INSTRUMENTED A T 195 F T AND 545 F T FOR WIND PRESSURE MEASUREMENTS
measured a t the 800-ft level a s follows:
i n which
p
= wind p r e s s u r e , i n pounds p e r s q u a r e foot; p = density of a i r , i n s l u g s p e r cubic foot; and V = mean wind speed a t 800 ft, averaged over 3-1/3 min, 10 min, or 30 min a s indicated, in feet p e r second.The mean p r e s s u r e coefficient, Crnean, r e p r e s e n t s the net p r e s s u r e differ- e n c e a c r o s s the exterior wall and is r e l a t e d to the external and internal p r e s -
2176 September, 1971 ST 9 s u r e coefficients a s follows:
The r m s p r e s s u r e coefficient, Crms, r e f e r s to the r m s value of either a 10-min o r a 30-min record. Maximum peaks of speed, p r e s s u r e , or suction a r e considered to be random variables that can be conveniently expressed in
FIG. 2.-PLAN LAYOUT O F CLADDING POSITIONS FOR WIND PRESSURE MEA-
SUREMENTS SHOWING DIRECTIONS O F RECORDED HIGH WINDS
0 . 0 2 5 . 0 5 0 . 0 75.0 \ 0 0 . 0 125.0 150.0
TIME, S E C O N D S
FIG. 3.-TYPICAL WIND PRESSURES ON CLADDING
t e r m s of the number of standard deviations by which they exceed the mean value a s follows:
maximum peak
-
meanX =
. . .
(3) r m s valueIn the reduced form given in Eq. 3 the maximum peaks observed from a l l the r e c o r d s a r e plotted a s probability distributions and compared with the
CLADDING
TABLE 1 .-MEAN PRESSURE COEFFICIENTS, Cmem AND CORRELATION
INDICES
a c o r r e l a t i o n index shown i n parentheses.
No value available-correlation index l e s s than 0.2. Cladding position ( 1 ) 1 E l 1N2 1 W l lW2 1W3 1W4 2 E 1 2N2 2Wl 2W2 2W3 2W4
TABLE 2.-RMS PRESSURE COEFFICIENTS, Crms
Wind direction P , in d e g r e e s a Correlation index. Cladding position (1) 1 E l IN2 1 W l lW2 1W3 1W4 2 E 1 2N2 2W1 2W2 25 2W3 0.12 (0.77) 0.07 (0.66) (0.78) (0.62) 2W4
1
0.101
(0.81)I
0.061
(0.62)1
::::
1
(0.87)/
:
1
(0.53) 10-MIN RECORDS (2) -0.12 0.19 0.38 0.43 0.36 0.34 -0.21 0.13 0.14 0.16 0.15 0.10 3 0 35 30-MIN RE CORDS (3) (0.40)a (0.45) (0.67) (0.67) (0.66) (0.64) (0.86) (0.64) (0.69) (0.71) (0.55) (0.11) (4) -0.26 0.14 0.40 0.37 0.26 0.23 -0.25 0.16 0.18 0.19 0.16 0.10 (6) -0.19 0.28 0.36 0.34 0.22 0.18 -0.32 0.10 0.16 0.17 0.15 -b (5) (0.85) (0.66) (0.92) (0.86) (0.76) (0.66) (0.85) (0.49) (0.67) (0.67) (0.66) (0.35) (7) (0.64) (0.72) (0.53) (0.64) (0.52) (0.50) (0.61) (0.3) (0.2) (0.2) (0.2) 4 0 Wind Direction p, i n d e g r e e s (8) -0.19 0.29 0.29 0.30 0.18 0.16 -0.28 0.18 - 0.10 0.08-
45 (9) (0.58) (0.78) (0.61) (0.81) (0.74) (0.67) (0.41) (0.3) (0.2) (0.2) (10) -0.14 0.38 0.12 0.22 0.14 0.11 -0.28 -b-
-
- - 3 0 (11) (0.66) (0.76) (0.24) (0.58) (0.32) (0.24) (0.71) 0.13 (0.76) 0.08 (0.56) 0.12 (0.77) 0.11 (0.72) (2) 0.05 0.07 0.14 0.13 0.11 0.09 0.13 0.07 0.13 (3) ( 0 . 6 2 ) ~ (0.69) (0.65) (0.63) (0.65) (0.67) (0.58) (0.76) (0.74) 4 0 (4 0.03 0.07 0.16 0.07 0.08 0.07 0.16 0.06 0.12 (5) (0.36) (0.42) (0.53) (0.33) (0.65) (0.73) (0.63) (0.68) (0.55) 30 (6) 0.05 0.07 0.14 0.13 0.11 0.10 0.13 0.07 0.13 4 0 (7) (0.60) (0.65) (0.62) (0.63) (0.68) (0.71) (0.57) (0.77) (0.75) (8) 0.05 0.10 0.19 0.12 0.10 0.09 0.19 0.07 0.15 (9) (0.53) (0.65) (0.72) (0.51) (0.54) (0.58) (0.88) (0.82) (0.80)September, 1971
TABLE 3.-FLUCTUATION RATES AND MODES O F PROBABILITY DISTRIBUTIONS
OF PEAK PRESSURES (REDUCED VARIATE, EQ. 3)
4 3 Samples Cladding position (1) I E l 1N2 1W1 1W2 1W3 1 W4 2E1 2N2 2W1 2W2 2W3 2W4 Wind s p e e d
PRESSURE I M A X . PEAK - M E A N l l R M S PRESSURE IMAX. PEAK - M E A N l l R M S
FIG. 4.-MAXIMUM PEAK PRES- FIG. 5.-MAXIMUM PEAK PRES-
SURES FOR POSITION 1W2, HIS- SURES FOR POSITION 1E1, HIS-
TOGRAMS A N D THEORE TICAL TOGRAMS, AND THEORETICAL
PROBABILITY DENSITY PROBABILITY DENSITY
Fluctuation Rates p e r second Modes
vc (2) 0.05 0.18 0.13 0.10 0.08 0.07 0.12 0.13 0.12 0.08 0.07 0.10 0.19 10-min r e c o r d s (4) 2.9 3.6 3.4 3.4 2.9 2.6 4.4 3.8 3.9 3.6 3.4 3.6 2.6
"P
(3 0.19 0.38 0.34 0.30 0.25 0.23 0.29 0.34 0.32 0.26 0.26 0.27 0.43 30-min r e c o r d s (5) 3.4 3 -6 4.1 3.5 3.1 2.9 5.6 3.9 4.4 4.1 4.2 3.6 2.9ST 9 CLADDING 2179 theoretical distribution defined by Davenport ( 3 ) f o r a stationary, Gaussian process:
.,
-
fcX, T) = x v T exp
[-
2 v T exp(-
$)I
. . .
in which f(x, v, T) d x = probability that the value of the maximum peak will lie between x and x+
d x ; v = average effective fluctuation r a t e p e r second; and T = length of the r e c o r d considered, in seconds.Finally, for cladding design the peak p r e s s u r e a t a point is required and is represented by the peak p r e s s u r e coefficient, Cpe&, a s follows:
The peak factor, g , can be considered a particular value of x, the reduced variate defined in Eq. 3. More will be s a i d about the selection of g in a l a t e r section. The absolute value symbols show that the addition for the peak in- c r e a s e s the absolute value of the panel p r e s s u r e , whether i t is positive o r negative.
SUMMARY O F EXPERIMENTAL RESULTS
Mean and r m s p r e s s u r e coefficients derived by linear r e g r e s s i o n of clad- ding p r e s s u r e s v e r s u s the corresponding velocity p r e s s u r e a t 800 ft a r e p r e -
I b l T
.
10 M i n u t e s 128 S a n o l e rP R E S S U R E I B A X . P E A K - M E A N I I R h ! S P R E S S U R E ( M A X P E A K - M E A N I I R M S
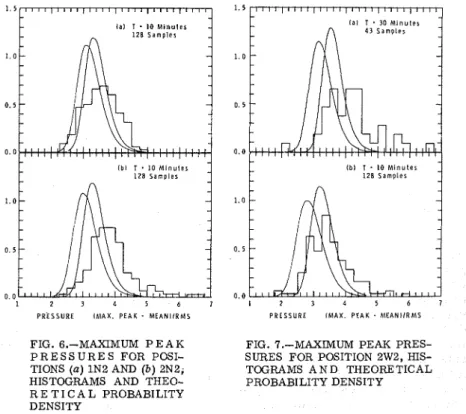
FIG. 6.-MAXIMUM P E A K FIG. 7.-MAXIMUM PEAK PRES-
P R E S S U R E S FOR POSI- SURES FOR POSITION 2W2, HIS-
TIONS ( a ) 1N2 AND ( b ) 2N2, TOGRAMS A N D THEORE TICAL
HISTOGRAMS AND THEO- PROBABILITY DENSITY
R E T I C A L PROBABILITY DENSITY
2180 September, 1971 ST 9 sented in s u m m a r y form in Tables 1 and 2. Mean p r e s s u r e coefficients a r e given in Table 1 for five wind directions. Each wind direction i s the central value for a 5" interval containing f r o m 30 to 60 individual 3-1/3-min a v e r - a g e s (200 s e c ) . Each value i s accompanied by i t s correlation index, r 2 , which indicates what fraction of the variance in p r e s s u r e could be attributed to variance in the r e f e r e n c e dynamic p r e s s u r e a t 800 ft.
R m s p r e s s u r e coefficients based on 10-min o r 30-min averaging times a r e given in Table 2 for two wind directions,
P
= 30" and 0 = 40°, in whichP
i s the angle measured to the north of the normal to the west wall.Fluctuation Rates.-The theoretical expression (assuming a stationary Gaussian random p r o c e s s ) for the probability distribution of maximum peaks i s shown in Eq. 4 to be determined by the length of the p r o c e s s , in seconds,
T, and the average fluctuation r a t e , v. F o r p r e s s u r e fluctuations on cladding v i s a random variable, i.e., the numerical value of v differs somewhat f r o m r e c o r d to r e c o r d in a random fashion. Nevertheless, the fluctuation r a t e s t i l l provides useful information for the checking and improvement of theoretical
0
0
1 2 . 0 1 3 . 0 0 1 5 . 0 6 0 17.0 1 8 . 0
T I M E , M I N U T E S
FIG. 8.-WIND RECORD SHOWING OCCASIONAL BURSTS O F INTENSE TURBULENCE
ON THE LEEWARD WALL
methods for predicting peak p r e s s u r e s . The theoretical interpretation of v i s that it r e p r e s e n t s the average number of c r o s s i n g s of the z e r o (mean) value with positive slope ( r e f e r r e d to a s plus c r o s s i n g s ) per second. F o r narrow- band random p r o c e s s e s the plus c r o s s i n g r a t e and the number of peaks p e r second a r e essentially the s a m e ; but f o r the wide-band p r o c e s s (one contain- ing energy contributions from a wide range of frequencies) represented by gust p r e s s u r e s on cladding the actual number of peaks was found to be about twice or three times the number of z e r o crossings. This i s indicated by the comparison of the plus c r o s s i n g r a t e , v, and the peak rate, vp. The average values found for each of these r a t e s , along with the modes of the probability distributions of the e x t r e m e peaks, a r e given in Table 3. Because of devia- tions from s t r i c t stationarity of the mean value, the observed plus c r o s s i n g r a t e tends to i n c r e a s e with decreasing lengths of record. Shorter r e c o r d s might be selected, for example, to obtain a c l o s e r approximation to station- a r i t y . Inany case, t h e p e a k r a t e , v,, i s clearly an upper bound for the effective fluctuation r a t e v, no matter w h 2 length of r e c o r d is used.
ST 9 CLADDING 2181
Distributions of Peak Maxima.-Figs. 4 through 7 a r e probability distribu- tions from t h r e e cladding positions on level 1 and two on level 2. Two curves defined i n Eq. 4 a r e superimposed on the observed distributions, that on the left based on v, and that on the right based on up. Figs. 4, 5, and 7 show the s a m e data partitioned into (a) 30-min r e c o r d s and (b) 10-min records. As expected, the distributions a r e shifted to the right when longer r e c o r d s a r e chosen, indicating that the expected maximum p r e s s u r e or suction i n c r e a s e s a s a function of s t o r m duration.
1 2 3 4 5 6 7
W I N D S P E E D ( M A X . P E A K - M E A N ) I R M S
FIG. 9.-MAXIMUM PEAK WIND S P E E D A T 800 F T , HISTOGRAMS AND THEORETI-
CAL PROBABILITY DENSITY
The observed distributions a r e i n good agreement with theory for cladding positions on the upper mechanical floor. On the lower level, however, they tend to be m o r e widely s c a t t e r e d and centered a t higher peak values than the theoretical curves, with the g r e a t e s t discrepancies occurring for position 2E1 (not shown). A possible explanation is suggested by s o m e of the r e c o r d s of measured p r e s s u r e differences v e r s u s time for position 2E1 ( s e e Fig. 8). They appear to consist of periods of low turbulence, alternating with periods of high turbulence during which the high peaks occur. The r m s p r e s s u r e is
2182 September, 1971 ST 9 bulence may be related to random shifts in position of s o m e strong vertically oriented vortex just behind the building.
Fig.9 shows almost the opposite discrepancy f o r wind speed; the observed distributions a r e centered a t lower peak values and the s c a t t e r a p p e a r s slightly l e s s than suggested by theory. P r e l i m i n a r y studies s e e m to verify the assumptions of a stationary Gaussian p r o c e s s and thus have not yet sug- gested a n explanation, but the investigation will be continued.
GUST E F F E C T FACTOR FOR CLADDING DESIGN
The 1970 edition of the National Building Code of Canada makes use of a gust effectfactor, which can be calculated either by a simple method based on judgement and a wind gust factor, o r by a detailed method (5). In the s i m p l e method the gust effect factor, Cg, is given a s 2.0 f o r s t r u c t u r a l design and 2.5 for cladding design. The detailed method i s a modification of the gust loading factor method proposed by Davenport (4).
The experimental r e s u l t s summarized in the l a s t section provide an op- portunity to a s s e s s the two methods by comparing calculated and measured
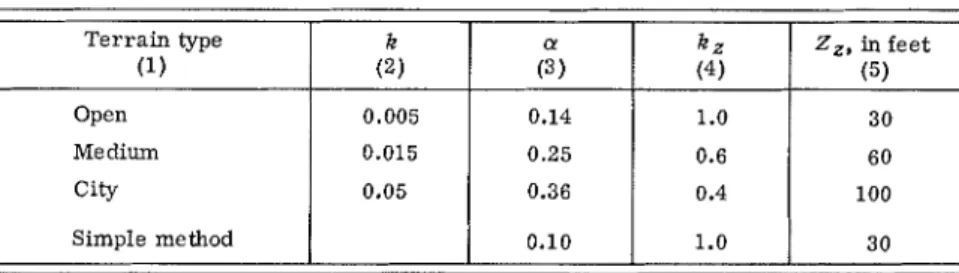
TABLE 4.-EXPOSURE PARAMETERS FOR COMPUTING DESIGN WIND LOADS ON
BUILDINGS T e r r a i n type (1) Open Medium City k (2) 0.005
p r e s s u r e s f o r the 12 cladding positions. Application of the gust effect factor to cladding design is demonstrated by
Simple method
in which
p
= equivalent s t a t i c design p r e s s u r e for cladding; q3, = r e f e r e n c e design p r e s s u r e appropriate f o r 30-ft height in open t e r r a i n , supplied a s cli- mate design data (1); C,, C, = exposure f a c t o r s ; and Cext, Cint a r e a s in112
Eq. 2.
Exposure Factor.-Both the simple method and the detailed method r e q u i r e anexposure factor f o r converting f r o m the reference design p r e s s u r e a t 30 ft in open t e r r a i n to the appropriate reference p r e s s u r e a t the building:
o!
(3) 0.14
in which Ce = exposure factor f o r height h (called C, and evaluated a t mid-
112
0.10
height of s t r u c t u r e f o r use with internal p r e s s u r e coefficient); kz = constant k z (4) 1.0 Z z , in f e e t (5) 30 1.0 3 0
ST 9 CLADDING 2183 of proportionality; h = height of s t r u c t u r e o r height to element being designed; 2, = a base height, i n feet and a = power law exponent for velocity profile.
Table 4 l i s t s the suggested p a r a m e t e r s for the simple method and for three categories of t e r r a i n roughness for the detailed method. T e r r a i n roughness to the west of the 45-story building was estimated to be between medium and city; interpolated v a l u e s f o r k,, 2, and a of 0.5, 80 ft, and 0.3 w e r e used, therefore, for calculations by the detailed method.
Gust Effect F a c t o r f o r Detailed Method.-For a relatively small, rigid cladding panel the dynamic properties have negligible influence and the gust effect factor reduces to
The measured cladding p r e s s u r e s presented herein a r e essentially indepen- dent of dynamic properties of the cladding through which the p r e s s u r e taps passed. Thus Eq. 8 i s appropriate for analysis of the data. Suggested values f o r the s u r f a c e roughness coefficient, k, f o r the three t e r r a i n categories a r e given in Table 4. The interpolated value used for calculating gust effect fac- t o r s by the detailed method was 0.03.
The linear relation between Crms and Cext, which i s required for Eqs. 5, 6, and 8, i s shown in Fig. 10 to hold reasonably well for the upper level. The deviations for the lower level a r e probably due to poor correlation in the evaluationof Cmean; the twopoints farthest from the r e g r e s s i o n line, cladding positions 2N2 and 2W4, have correlation indices of only 0.49 and 0.35, r e - spectively ( s e e Table 1).
Peak Factor.-The central factor in the relation between mean and maxi- mumpeak p r e s s u r e s o r suctions i s s e e n t o be the peak factor, g. As shown in Figs. 3 to 6, the number of r m s values by which the maximum peak exceeds the mean i s a random variable described by a probability distribution. The choice of g, therefore, affects the overall probability of exceeding the design cladding p r e s s u r e . In s t r u c t u r a l response evaluation the gust factor i s often selected to correspond to the average maximum peak value. The probability that this quantity may be exceeded i s about 0.43 and this s a m e probability level i s reasonable to be used in cladding design.
As the observed distributions generally had a l a r g e r s p r e a d than the cor- responding theoretical distributions, the observed peak factors, gi, (with probabilities of exceedance 0.43 f o r each ofthe 12 cladding positions) were in fact about 5
O/o
l a r g e r than the observed averages of the maximum peaks in each case. In comparing measured and calculated peak p r e s s u r e s the l a r g e r values of g i (having exceedance probabilities 0.43) were used to define mea- s u r e d peaks and the average of all 12 gi, o r 4.5, was used f o r calculations by the detailed method.Comparison of Measured and Calculated Pressures.-A practical compar- ison of the detailed method with the simple method must include the influence of the exposure factor; it i s not the s a m e for both. Comparison of measured and calculated p r e s s u r e s in Table 5 i s given in t e r m s of Cpeak times C,, o r the peak cladding p r e s s u r e divided by the mean velocity p r e s s u r e a t a height of 30 f t in open terrain.
The mean p r e s s u r e coefficients used were those determined from the mea- s u r e d p r e s s u r e s ; thus, any differences between measured and calculated val- ues a r e due solely to differences in Cg, the gust effect factor, and C,, the
S e p t e m b e r , 1971
TABLE 5.-COMPARISON O F MEASURED AND CALCULATED PEAK CLADDING PRESSURES (BASED ON MEAN WIND A T 30 F T IN OPEN TERRAIN)
C i n t = + . 0 9 r 2 =
.
9 9 6 L E V E L 2 - Cr,, = 0 . 5 8 C e x t C i n t = + . 0 3 Cladding position (1 ) 1 E l IN2 1W1 1W2 1W3 1W4 2E1 2N2 2W1 2W2 2W3 2W4FIG. 10.-LINEAR RELATION BETWEEN Crms AND Cext FOR 30' WIND
DIRECTION Measured gi (2 ) 3.9 4.2 3.2 3.5 4.7 4.2 6.6 4.6 4.2 4.3 4.6 4.7 Calculated Detailed method, Cpeak C e (5) -1.00 1.07 2.41 2.26 1.69 1.53 -1.47 1.12 1.25 1.31 1.12 0.74 Cpeak (3) -0.45 0.44 0.86 0.83 0.78 0.65 -1.11 0.48 0.73 0.71 0.66 0.52 Simple method, Cpeak Ce (6) -1.14 1.12 2.58 2.41 1.79 1.62 -1.98 1.50 1.67 1.75 1.50 0.99 Cpeak Ce (4 -0.90 0.88 1.71 1.65 1.55 1.29 -2.21 0.96 1.45 1.41 1.31 1.04
ST 9 CLADDING 2185
exposure factor. On the upper level the detailed method averaged 23
%
higher and the simple method 32'?(I
higher than the m e a s u r e d values. On the lower level the detailed method averaged 1 5%
lower and the simple method 19%
higher than the measured values.
Differences would be reduced by almost half for the detailed method if the average gi f o r the respective levels (4.0 for the upper and 4.9 for the lower) w e r e u s e d instead of the grand average, 4.5. Position 2E1, in particular, con- tributes t o a higher g for the lower level, but if a distinction w e r e made in the time s e r i e s between periods of relative calm and periods of high turbulence, g would come down and the r m s value would go up.
The t e r m s of Eq. 8 multiplied by g can be described collectively a s the co- efficient of variation of the fluctuating cladding p r e s s u r e ( r m s value/mean value), o r m o r e concisely a s the intensity of p r e s s u r e turbulence. F o r this important quantity the detailed method, a s applied, gave an under-estimate for the lower level and a n over-estimate for the upper level.
CONCLUSIONS
Calculationofagust effect factor for cladding design hinges on the estima- tion of two important quantities: intensity of p r e s s u r e turbulence, and peak factor. The intensity of p r e s s u r e turbulence i s the m o r e difficult quantity to estimate, although present r e s u l t s a l s o indicate s o m e variation in the peak factor from one position to another.
The detailed gust effect factor method recognizes the importance of the two quantities and provides s o m e improvement over the s i m p l e r and m o r e con- servative wind gust factor method, but neither method can yet be considered entirely adequate. A major difficulty is the evaluation of the turbulence gen- erated by s t r u c t u r e s in the immediate vicinity of the building to be designed. The l a t t e r point r a i s e s an interesting question: i f other buildings c a u s e significantly increased levels of turbulence (from wake interaction), to what extent should future changes in the surroundings be considered i n design? Perhaps considerationshould be given to specifying one o r m o r e standard ex- posures, with representative configurations f o r surrounding buildings.
In view of t h e n e e d f o r detailed information on turbulence intensities in city environments, efforts should be increased to gather climatic data a t typical building s i t e s . Admittedly this is no e a s y task. To make the best possible u s e of field data, which a r e expensive and time-consuming to collect and inter- pret, c l o s e cooperation should be maintained among meteorologists, wind tun- n e l experts, and those doing measurements on full-scale buildings.
ACKNOWLEDGMENTS
The w r i t e r is indebted to the owners of the building, Dorchester Commerce Realty Limited, the building manager, the superintendent, and the operating personnel f o r their cooperation in making full-scale measurements possible. Theassistanceof W. von Tobel in making the measurements and of other col- leagues in a s s e s s i n g the r e s u l t s is a l s o gratefully acknowledged.
This paper is a contribution from the Division of Building Research, Na- tional R e s e a r c h Council of Canada, and is published with the approval of the Director of the Division.
September, 1971 S T 9
APPENDIX I.-REFERENCES
I. Boyd, D..W., "Climatic Information for Building Design in Canada," Supplement No. I to the National Building Code of Canada, issued by the Associate Committee on the National Building Code, National Research Council of Canada, Ottawa. 1970.
2. Dalgliesh, W. A,, Wright, W.. and Schriever, W. R., "Wind Pressure Measurements on a Full- Scale High-Rise Office Building," Proceedings, International Research Seminar o n Wind Effects on Buildings and Structures, University of Toronto Press, 1968, pp. 167-200.
3. Davenport. A . G., "Note on the Distribution of the Largest Value of a Random Function with Application to Gust Loading," Proceedings. Institution of Civil Engineers, Vol. 28, June, 1964, pp. 187-196.
4. Davenport,A. G., "Gust Loading Factors," Journal ojStructura1 Division. ASCE,Vol. 93, No. ST3, Proc. Paper 5255, June, 1967, pp. 11-34,
5. Davenport, A. G. and Dalgliesh. W. A,. "Wind Loads," Canadian Structural Design Manual, Supplement No. 4 to the National Building Code of Canada, issued by the Associate Com- mittee on the National Building Code, National Research Council of Canada. Ottawa, 1971. 6. Deacon, E. L., "Wind Gust Speed: Averaging Times Relationship," Ausrralian Meteorological
Magazine. Vol. 51, 1965, pp. 11-14.
7. Durst, C . S . , "Wind Speeds over Shortperiods of Time," The Meteorological Magazine.Vol.89, July. 1960 pp. 181-186.
8. Vellozzi, J . and Cohen, E., "Gust Response Factors," Journal o j Structural Division. ASCE, Vol. 94, No. ST6, Proc. Paper 5980, June, 1968, pp. 1295-1313.
9. Vickery. B. J., "On the Reliability of Gust Loading Factors," Proceedings, Technical Meeting Concerning Wind Loads on Buildings and Structures, National Bureau of Standards, Washing- ton, Jan., 1969-Building Science Series 30, issued Nov., 1970, pp. 93-104, (a United States Department of Commerce Publication).
APPENDIX 11.-NOTATION
The following symbols a r e used in this paper: C,, C, = exposure f a c t o r s ;
112
Cext = external p r e s s u r e coefficient a t a point; Cint = internal p r e s s u r e coefficient a t a point;
Cmean = mean (time-averaged) p r e s s u r e coefficient a t a point; Cpeak = peak p r e s s u r e coefficient a t a point;
Crms = r m s p r e s s u r e coefficient a t a point;
f(x, v , T) d x = probability that value of maximum peak will lie between x and x + d x ;
g, gi = peak f a c t o r ;
h = height of s t r u c t u r e o r height of element being designed;
k = s u r f a c e roughness coefficient;
k , = proportionality constant;
p
= p r e s s u r e d i f f e r e n c e a c r o s s e x t e r i o r wall, i n pounds p e r s q u a r e foot;CLADDING 2187
q,, = referencedesign w i n d p r e s s u r e appropriate for 30-ft height in open t e r r a i n ;
r 2 = correlation index;
T = length of record, i n seconds;
V = mean wind speed a t 800 ft, averaged over 200 s e c , 10 min o r 30 min a s indicated, in feet p e r second;
x = reduced v a r i a t e representing e x c e s s of peak of random func- tion over mean value;
2, = base height, i n feet;
ff = power law exponent f o r velocity profile;
p = wind direction measured a s angle, in degrees, north of a per- pendicular to west wall;
v = average effective fluctuation r a t e p e r second;
v, = average fluctuation r a t e indicated by number of crossings of mean value with positive slope;
vp
= average fluctuation r a t e indicated by number of peaks; and8356 STATISTICAL TREATMENT O F PEAK GUSTS ON CLADDING
I
II KEY WORDS: aerodynamics; buildings; field testing; gust loads;
random processes; structural engineering; &; wind p r e s s u r e
ABSTRACT: Design methods based on a statistical approach to the prediction of cly-
I
namic effects of wind on frameworks of tall buildings a r e steadily gaining acceptance.I
Similar concepts can be applied to wind loads on cladding, although t h e r e a r e im- Iportant differences such a s exposure, s i z e , and dynamic properties of the elements I considered. Wind p r e s s u r e s and suctions a t several points on a tall building recorded during strong winds a r e used t o study the problem of predicting pcalc gust loads on I windows and cladding elements. The statistical approach t o the prediction of peak I gusts, based on random process theory, i s investigated. Measured pealc p r e s s u r e s a r e
I
compared to values calculated by a simple wind gust factor method and by a m o r e Idetailed gust effect factor method. It i s concluded that the gust effect factor method is
I
preferable because it promotes a better understanding of peak p r e s s u r e s , but furtherI
field data and experimentation a r e needed before entirely satisfactory design csti- I Imates can be made. I I
I
REFERENCE: Dalzliesh, W. Alan, 'Statistical Treatment of Peak Gusts on Cladding," -. ! Journal of the structural Division, ASCE, Vol. 97, No. ST9, Proc. Paper 8356, I
September, 1971, pp. 2173-2187. I
I I I