HAL Id: hal-00297054
https://hal.archives-ouvertes.fr/hal-00297054
Submitted on 2 Jan 2008
HAL is a multi-disciplinary open access
archive for the deposit and dissemination of
sci-entific research documents, whether they are
pub-lished or not. The documents may come from
teaching and research institutions in France or
abroad, or from public or private research centers.
L’archive ouverte pluridisciplinaire HAL, est
destinée au dépôt et à la diffusion de documents
scientifiques de niveau recherche, publiés ou non,
émanant des établissements d’enseignement et de
recherche français ou étrangers, des laboratoires
publics ou privés.
Islands tsunamis of 15 November 2006 and 13 January
2007
A. B. Rabinovich, L. I. Lobkovsky, I. V. Fine, R. E. Thomson, T. N.
Ivelskaya, E. A. Kulikov
To cite this version:
A. B. Rabinovich, L. I. Lobkovsky, I. V. Fine, R. E. Thomson, T. N. Ivelskaya, et al.. Near-source
observations and modeling of the Kuril Islands tsunamis of 15 November 2006 and 13 January 2007.
Advances in Geosciences, European Geosciences Union, 2008, 14, pp.105-116. �hal-00297054�
www.adv-geosci.net/14/105/2008/ © Author(s) 2008. This work is licensed under a Creative Commons License.
Geosciences
Near-source observations and modeling of the Kuril Islands
tsunamis of 15 November 2006 and 13 January 2007
A. B. Rabinovich1,2, L. I. Lobkovsky1, I. V. Fine2, R. E. Thomson2, T. N. Ivelskaya3, and E. A. Kulikov1
1Russian Academy of Sciences, P.P. Shirshov Institute of Oceanology, 36 Nakhimovsky Pr., Moscow, 117997, Russia
2Department of Fisheries and Oceans, Institute of Ocean Sciences, 9860 W. Saanich Rd., Sidney, B.C., V8L 4B2, Canada
3Federal Service for Hydrometeorology and Environment Monitoring, Sakhalin Tsunami Warning Center, 78 Zapadnaya Str.,
Yuzhno-Sakhalinsk, 693000, Russia
Received: 2 November 2007 – Revised: 21 November 2007 – Accepted: 21 November 2007 – Published: 2 January 2008
Abstract. Two major earthquakes near the Central Kuril
Islands (Mw=8.3 on 15 November 2006 and Mw=8.1 on
13 January 2007) generated trans-oceanic tsunamis recorded over the entire Pacific Ocean. The strongest oscillations, exceeding several meters, occurred near the source region of the Kuril Islands. Tide gauge records for both tsunamis have been thoroughly examined and numerical models of the events have been constructed. The models of the 2006 and 2007 events include two important advancements in the simulation of seismically generated tsunamis: (a) the use of the finite failure source models by Ji (2006, 2007) which provide more detailed information than conventional mod-els on spatial displacements in the source areas and which avoid uncertainties in source extent; and (b) the use of the three-dimensional Laplace equation to reconstruct the initial tsunami sea surface elevation (avoiding the usual shallow-water approximation). The close agreement of our simulated results with the observed tsunami waveforms at the open-ocean DART stations support the validity of this approach. Observational and model findings reveal that energy fluxes of the tsunami waves from the source areas were mainly di-rected southeastward toward the Hawaiian Islands, with rel-atively little energy propagation into the Sea of Okhotsk. A marked feature of both tsunamis was their high-frequency content, with typical wave periods ranging from 2–3 to 15– 20 min. Despite certain similarities, the two tsunamis were essentially different and had opposite polarity: the leading wave of the November 2006 trans-oceanic tsunami was pos-itive, while that for the January 2007 trans-oceanic tsunami was negative. Numerical modeling of both tsunamis indi-cates that, due to differences in their seismic source proper-ties, the 2006 tsunami was more wide-spread but less focused than the 2007 tsunami.
Correspondence to: A. B. Rabinovich
1 Introduction
Following the catastrophic 2004 Sumatra earthquake and global tsunami, seismic zones around the Pacific Ocean were thoroughly examined based on the seismic-gap theory (Mc-Cann et al., 1979). The Central Kuril seismic gap of about 400 km length which last experienced a major earthquake in 1780 (Lobkovsky, 2005; Laverov et al., 2006a) was de-fined as the zone of highest risk for a catastrophic event. To explore this seismic zone, detailed marine geophysical ex-peditions were conducted by the Russian Academy of Sci-ences on the R/V “Akademik Lavrentiev” in 2005 and 2006 (Laverov et al., 2006b). The main purpose of these expe-ditions was to examine the tectonic structure of the seismic gap, identify cross-shelf fault zones, and estimate possible source areas of the next expected earthquake. Based on the estimated seismic gap zone and preliminary results of these expeditions, numerical modeling of several scenarios involv-ing possible major tsunamis was undertaken (Lobkovsky and Kulikov, 2006; Lobkovsky et al., 2006). The area of primary concern was the northeastern shelf of Sakhalin Island in the Sea of Okhotsk, which is the principal region of the oil and gas industry in the Russian Far East. For the worst-case sce-nario, the expected wave heights were more than 16 m for the coast of the Central Kuril Islands and more than 5 m for the coast of Sakhalin.
The Mw=8.3 (USGS) earthquake of 15 November 2006
occurred on the continental slope of the Central Kuril Islands approximately 90 km offshore from Simushir Island (Fig. 1); i.e., very close to the expected source region. The earthquake was a thrust fault type that occurred at the inter plate bound-ary (cf. Fujii and Satake, 2007). Parameters of the earthquake
are: T0=11:14:13.6 UTC; ϕ=46.592◦N; λ=153.266◦E;
h=26–30 km; Mb=6.6; Ms=8.3; and M0=3.37×10²¹N m
(Global CMT, 2006), where T0 is the earthquake time
(hour:min:sec), ϕ is the latitude, λ is the longitude, h is the
Tide gauge Russian Japanese M =8.3 M =8.1 w w Magadan Starodubsk Kholmsk Hachinohe Hanasaki Tokachiko Kushiro Urakawa Petropavlovsk-Kamchatsky 140° 145° 150° 155° 160° 165°E 40° 60°N M =8.3 M =8.1 Hanasaki Tokachiko Starodubsk Kholmsk Magadan Petropavlovsk-Kamchatsky Pacific Ocean Sea of Okhotsk Kamchatka Sakhalin Kuril Islands Kushiro Urakawa Hachinohe Wakkanai
Wakkanai Urup I. Simushir I.
Bussol Str . Kruzensterna Str . 45° 50° 55° 1 1 2 2 3 4 5 Malokurilsk Yuzhno-Kurilsk Malokurilsk Yuzhno-Kurilsk w w Shikotan I. Kunashir I. Ituru p I. Paramushir I. La Perouse Str.
Fig. 1. Map of the northwestern Pacific showing epicenters
(stars) of the 15 November 2006 (Mw=8.3) and 13 January 2007
(Mw=8.1) Kuril Islands earthquakes and locations of tide gauges
on the coasts of the Russian Far East and northern Japan. Solid and dashed curved lines denote the 30-min isochrones of tsunami travel time from the 2006 source area.
moment. The earthquake generated a trans-Pacific tsunami that appears to have been the strongest since the 1964 Alaska tsunami 42.5 years ago. Parameters of the observed tsunami are similar to those predicted, except that the northeastern coast of Sakhalin Island was mainly sheltered from destruc-tive waves by the Simushir coast. Marked tsunami signals were identified in records from the Kuril Islands, Japan, Alaska, Canada, Peru, New Zealand and a number of tropical Pacific islands. Wave heights exceeding 1 m were recorded on the coasts of the Hawaiian Islands, Oregon, California and Mexico. Significant damage took place in the port of Crescent City (California) located roughly 6600 km from the source. The maximum wave recorded at this site was 177 cm
(Kowalik et al., 2008). The tsunami was also recorded
by a number of Deep ocean Assessment and Reporting of Tsunamis (DART) bottom pressure stations operated by the National Oceanic and Atmospheric Administration (NOAA), USA, and by deep ocean cable stations operated by the Japan Agency for Marine Earth Science and Technology (JAM-STEC) (cf. Fujii and Satake, 2007).
On 13 January 2007, a second earthquake of comparable
magnitude (Mw=8.1; USGS) to the November 2006
earth-quake occurred in the same region but with a source lo-cated on the oceanic slope of the Kuril-Kamchatka Trench,
about 100 km southeastward of the site of the earlier earth-quake (Fig. 1). The 2007 earthearth-quake was a normal fault event that took place at the interior portion of the subduct-ing plate (cf. Fujii and Satake, 2007). The main parameters
of the earthquake are: T0=04:23:21.2 UTC; ϕ=46.243◦N;
λ=154.524◦E; h=10 km; and M
0=1.65×10²¹N m (Global
CMT, 2007). Although less energetic than the 2006 tsunami, the 2007 tsunami was also clearly recorded at many sites in the Pacific Ocean, including the Kuril, Aleutian, and Hawai-ian islands, Japan, Alaska, California, Peru and Chile. De-spite the close proximity of the two source areas and their degree of similarity, the two tsunamis were essentially differ-ent due to differences in their respective seismic sources and sign of the first seaward propagating wave: positive for the November 2006 tsunami and negative for the January 2007 tsunami.
Both tsunamis were examined in detail using coastal tide gauges and bottom-pressure open-ocean stations. Numerical models were constructed for the local near-source area and for the entire Pacific Ocean. Simulated tsunami waves were found to agree closely with waves recorded at offshore island and deep-ocean DART sites; the energy flux of the waves was mainly directed southeastward toward the Hawaiian Is-lands and Chile. The present study focuses on the character of tsunami waves near the source region of the Russian Far East and northern Japan. Examination of the far-field char-acteristics of the 2006 and 2007 tsunamis is a subject of an independent paper now in preparation.
2 Observations of the 15 November 2006 Tsunami The 15 November 2006 (11:14 UTC) earthquake that oc-curred offshore of Simushir Island (Central Kuriles, NW Pa-cific) generated a trans-oceanic tsunami. Waves recorded around the Pacific Ocean revealed the wide-spread reach of the 2006 tsunami. Especially high waves were identified in records of near-field stations in Russia and northern Japan (locations of the stations are shown in Fig. 1). Unfortunately, the Russian tide gauge network is still under reconstruc-tion. In the near-source region of the Central Kuril Islands, there are presently no working tide gauges and most of exist-ing tide gauges located more than 500 km from the source (Fig. 1) are archaic “pen-and-paper” analog instruments. Nevertheless, significant tsunami waves were identified in records from Malokurilsk, Yuzhno-Kurilsk, Petropavlovsk-Kamchatsky, Magadan, Starodubsk, and Kholmsk. The qual-ity of these records and the signal-to-noise ratio for most of the tide gauges are relatively good.
The analog records were digitized at an interval of 5 min and examined using the data analysis procedure for the 2004 Sumatra tsunami records presented by Rabinovich et al. (2006) and Rabinovich and Thomson (2007). De-tided records from five stations (except Starodubsk which was too noisy) are shown in Fig. 2. These records were used to
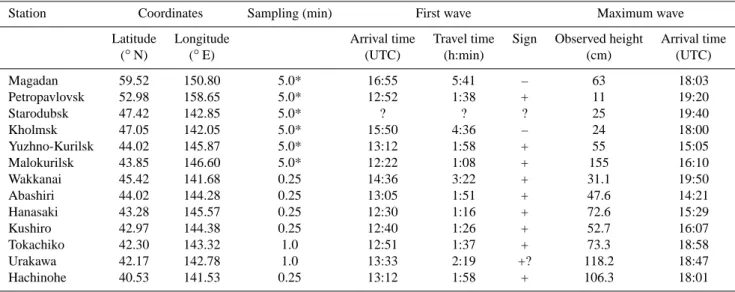
Table 1. Statistical characteristics of the 15 November 2006 Kuril Islands tsunami estimated from tide gauge records from Russian and
Japanese stations near the source region.
Station Coordinates Sampling (min) First wave Maximum wave
Latitude Longitude Arrival time Travel time Sign Observed height Arrival time
(◦N) (◦E) (UTC) (h:min) (cm) (UTC)
Magadan 59.52 150.80 5.0* 16:55 5:41 – 63 18:03 Petropavlovsk 52.98 158.65 5.0* 12:52 1:38 + 11 19:20 Starodubsk 47.42 142.85 5.0* ? ? ? 25 19:40 Kholmsk 47.05 142.05 5.0* 15:50 4:36 – 24 18:00 Yuzhno-Kurilsk 44.02 145.87 5.0* 13:12 1:58 + 55 15:05 Malokurilsk 43.85 146.60 5.0* 12:22 1:08 + 155 16:10 Wakkanai 45.42 141.68 0.25 14:36 3:22 + 31.1 19:50 Abashiri 44.02 144.28 0.25 13:05 1:51 + 47.6 14:21 Hanasaki 43.28 145.57 0.25 12:30 1:16 + 72.6 15:29 Kushiro 42.97 144.38 0.25 12:40 1:26 + 52.7 16:07 Tokachiko 42.30 143.32 1.0 12:51 1:37 + 73.3 18:58 Urakawa 42.17 142.78 1.0 13:33 2:19 +? 118.2 18:47 Hachinohe 40.53 141.53 0.25 13:12 1:58 + 106.3 18:01
∗Analog digitized records from float-type tide gauges.
estimate the principal statistical parameters of the observed tsunami waves (Table 1). Due to a technical problem, there was a ∼4.5-hour gap in the record of Malokurilsk, the site where the strongest oscillations were observed (Fig. 2). This prevented us from estimating exact statistical parameters for tsunami waves at this site. However, the general structure of the tsunami, in particular, the tsunami arrival times, were well defined (Table 1).
Tsunami waves first arrived at Malokurilsk (Shikotan Is-land, Southern Kuril Islands) at 12:22 (UTC), 1 h 8 min after the main earthquake shock. The first wave at this tide gauge, as well as at the most of the other gauges indicated in Fig. 1 (except Magadan), was positive (wave crest). However, the maximum wave at Malokurilsk occurred approximately four hours after the first wave arrival (Table 1). This wave, with trough-to-crest value of 155 cm, was the highest instrumen-tally recorded in the near-field zone and the second highest at all sites after the 177 cm wave at Crescent City, California. In fact, it is possible that even higher oscillations occurred at this site: a 137-cm wave was observed at 19:40 (UTC), about 8.5 h after the main shock, indicating the arrival of a new train of high waves (Fig. 2). Unfortunately, the instrument had stopped working for four hours and missed the passage of these waves.
The record at Malokurilsk is distinct in that the oscilla-tions were highly regular and monochromatic with a domi-nant period of about 18.6 min. Background oscillations with this specific period are very common at this site (cf. Dju-magaliev and Rabinovich, 1993; Rabinovich and Monserrat, 1998). The tide gauge of Malokurilsk is located on the north-western coast of a bottle-shaped bay with a narrow neck. Ra-binovich and Leviant (1992) and Djumagaliev et al. (1994)
00 06
18 12
06
100 cm
Time (hours, days) E
Relative sea level
Malokurilsk Yuzhno-Kurilsk Petropavlovsk-Kamchatsky Kholmsk Magadan 15 Nov 16 Nov TAT
Kuril Islands Earthquake (M = 8.3) of 15 November 2006
Tsunami
Russian stations
w
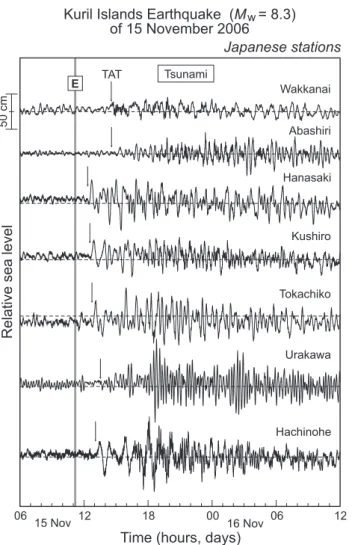
Fig. 2. Tsunami records for the November 2006 tsunami for five
analog tide gauges on the Russian Far East coast. Small arrows indicate Tsunami Arrival Times (TAT). Solid vertical line labelled
50 cm Hanasaki Wakkanai Abashiri Kushiro Tokachiko Urakawa Hachinohe 00 12 18 12 06
Time (hours, days)
15 Nov 16 Nov 06
E TAT
Kuril Islands Earthquake (M = 8.3) of 15 November 2006
Tsunami
Japanese stations
w
Relative sea level
Fig. 3. The same as in Fig. 2 but for seven digital tide gauges located
on the coasts of Hokkaido Island and northeastern Honshu Island (Japan).
examined the eigen properties of this bay and demonstrated that 18.6-min oscillations are associated with the fundamen-tal (Helmholtz) mode of the bay. The strong tsunami oscil-lations of 15 November 2006 observed at Malokurilsk are apparently related to specific resonant effects and to the high Q-factor of the bay (Q∼=12 in Malokurilsk Bay according to computations by Djumagaliev et al., 1994).
Tsunami oscillations at other Russian sites were much weaker and less regular than at Malokurilsk. Tsunami Ar-rival Times (TAT) were in good agreement with calculated Expected Tsunami Arrival times (ETA) (Fig. 1). Tsunami waves arrived at Petropavlovsk-Kamchatsky (Kamchatka Peninsula) located northeastward from the source area within 1 h 38 min of the main shock and at Yuzhno-Kurilsk (Ku-nashir Island, Southern Kuril Islands) located southwestward from the source within 1 h 58 min (∼50 min later than at Mal-okurilsk) of the main shock. The tsunami penetrated into the Sea of Okhotsk and was recorded at Starodubsk on the southeastern coast of Sakhalin Island and at Magadan on
the northwestern coast of the Sea of Okhotsk. (The exact TAT at Starodubsk was difficult to delineate due to the high background noise level.) Once through La Perouse Strait (Soya Strait), the waves propagated into the Sea of Japan and, 4 h 36 min after the main earthquake, were recorded at Kholmsk on the southwestern coast of Sakhalin Island. Observed tsunami wave periods at the various sites were markedly different, ranging from 18 min at Malokurilsk to 1 h at Magadan (Fig. 2), demonstrating that these periods are mainly determined by local topographic properties of the re-spective sites, rather than by the source characteristics (cf. Rabinovich, 1997).
The tsunami tide gauge data for Japanese sites for both the 15 November 2006 and 13 January 2007 tsunamis were pro-vided by the Japan Meteorological Agency (JMA) and the West Coast/Alaska Tsunami Warning Center (WC/ATWC). All data were from digital tide gauges with sampling inter-vals of 15 s or 1 min (Table 1). The tsunami waves were clearly recorded at stations on the coasts of Hokkaido and
northeastern Honshu (Fig. 3). The waves arrived at
sta-tions on the Pacific coast over the period from 12:30 UTC (Hanasaki) to 13:33 UTC (Urakawa); i.e. from 1 h 16 min to 2 h 19 min after the earthquake. At 13:05 UTC (1 h 51 min after the main earthquake) the first tsunami wave arrived at Abashiri on the northern (Sea of Okhotsk) coast of Hokkaido Island and approximately 1 h 30 min later (14:36 UTC) at Wakkanai, on La Perouse (Soya) Strait (Fig. 1). The high-est waves were recorded at Urakawa (118.2 cm) and Hachi-nohe (106.3 cm). We note that these maximum waves oc-curred a considerable time (∼5 h) after the first wave arrivals. Tanioka et al. (2008) attribute the late arrivals of maximum waves to influence of the Emperor Ridge. According to these authors, the maximum observed oscillations constitute “sec-ondary” tsunami waves reflected from the Emperor Ridge. Kowalik et al. (2008) also suggest that the Emperor Ridge, Koko Guyot and the Hess Ridge in the northwestern Pacific played a primary role in reflection of the 2006 tsunami and subsequent formation of new sets of high amplitude waves. Close agreement of the arrival times of the maximum waves at Tokachiko, Urakawa and Hachinohe (Table 1) supports the above suggestions.
A marked feature of tsunami waves observed on the coast of Hokkaido and the northeastern coast of Honshu is their high-frequency content, with typical wave periods ranging from 3–5 to 20–25 min (Fig. 3). Equally important is the positive sign of the first wave (Table 1, Fig. 3) which supports
the proposition (e.g., Tanioka et al., 2008) that the Mw=8.3,
2006 Kuril Islands earthquake was a thrust fault event.
3 Observations of the 13 January 2007 Tsunami
The slightly weaker (Mw=8.1) earthquake of 13 January
2007 occurred in close vicinity to the source area of the 2006 earthquake but with its epicenter on the oceanic slope of the
Kuril-Kamchatka Trench (Fig. 1). As with the November 2006 event, the 2007 earthquake generated a trans-Pacific tsunami that was clearly recorded far from the source area in New Zealand, southern Chile and Easter Island. How-ever, hazardous impact of the 2007 tsunami at remote sites such as Crescent City was highly tempered compared to the 2006 event due to its reduced energy (the typical ratio of 2006/2007 far-field wave heights is 3:1). Nevertheless, the impact of the 2007 tsunami at some islands of the North-western Pacific was quite significant. According to our anal-ysis, maximum observed wave heights were 83 cm at Chichi-jima Island, Japan, 71 cm at Miyakeshima Island, Japan, and 69 cm at Shemya Island, Aleutian Islands, USA.
The 2007 tsunami went undetected in records from Rus-sian analog tide gauges at Petropavlovsk, Starodubsk, Ma-gadan and Kholmsk due to low signal-to-noise ratios but was clearly detected by gauges at Yuzhno-Kurilsk and Mal-okurilsk. Tsunami waves at Malokurilsk were significant but poorly recorded because of problems with the ink which lead to gaps in the record. Nevertheless, we were able to digi-tize the record at a time interval of 1 min (Fig. 4, Table 2). In addition, the Institute of Marine Geology and Geophysics (IMGG), Yuzhno-Sakhalinsk, in December 2006 (soon after the first event), deployed two digital bottom pressure gauges with sampling intervals of 1 min in Malokurilsk Bay and Krabovaya Bay (both on the northern coast of Shikotan Is-land, Southern Kuriles). On 13 January the two gauges accu-rately recorded tsunami waves (Grigory Bogdanov, IMGG, personal communication, 2007); these records are also used for analysis.
The 2007 tsunami waves entered Malokurilsk Bay at 05:32 UTC (Table 2) and were recorded by two tide gauges almost simultaneously (the analog tide gauge at Malokurilsk is lo-cated on the northwestern side of the bay; the digital bottom pressure station is located near the eastern side of the bay about 1 km from the first gauge). The tsunami travel time was 1 h 9 min, which is only 1 min longer than the travel time to this site for the 2006 tsunami. Maximum recorded waves were 72 cm at the tide gauge and 57.7 cm at the bot-tom pressure gauge. As with the 2006 tsunami, tsunami waves recorded in Malokurilsk Bay in 2007 were regular and monochromatic with a dominant period of 18.6 min (at both gauges). Nine minutes later tsunami waves arrived at the bottom pressure gauge in Krabovaya Bay located about 8 km from Malokurilsk Bay. Recorded oscillations were also regular and monochromatic with peak period of 29.5 min, which is the period of the fundamental (Helmholtz) mode for this bay (Djumagaliev and Rabinovich, 1993; Rabinovich and Monserrat, 1998). Maximum observed waves at Krabo-vaya Bay were 41.9 cm, which considerably smaller than in Malokurilsk Bay. This difference is probably related to dif-ferences in the fundamental periods of the two bays: the res-onant period of 18.6 min in Malokurilsk Bay was apparently much more closely tuned to the characteristic periods of the 2007 tsunami source.
18 12
06
40 cm
Time (hours, days)
Relative sea level
Malokurilsk TG 13 Jan 00 Malokurilsk Bay Krabovaya Bay E TAT
Kuril Islands Earthquake (M = 8.1) of 13 January 2007
Tsunami
Russian stations
w
Yuzhno-Kurilsk TG
Fig. 4. Tsunami records for the January 2007 tsunami for coastal
tide gauges at Yuzhno-Kurilsk (Kunashir Island) and Malokurilsk (Shikotan Island), and at two bottom pressure stations located in Malokurilsk and Krabovaya bays (Shikotan Island). Small arrows indicate Tsunami Arrival Times (TAT). Solid vertical line labelled
“E” denotes the time of the main earthquake shock (Mw=8.1).
The tsunami waves at Yuzhno-Kurilsk were weak, with maximum recorded waves of only about 11 cm. We digitized this record with a 5-min step (Fig. 4) and estimated statistical parameters from the resulting time series. The tsunami waves arrived at Yuzhno-Kurilsk (Kunashir Island) at 06:12 UTC, 1 h 49 min after the main 2007 shock and 40 min after arrival at Malokurilsk Bay. This travel time is in good agreement with the 2006 tsunami travel time at this site (1 h 58 min). In contrast to the observed tsunami waves in Malokurilsk and Krabovaya bays, tsunami waves recorded at Yuzhno-Kurilsk were irregular and polychromatic, a typical feature for this site (cf. Rabinovich and Leviant, 1992). Resonant properties of the local topography in the vicinity of Yuzhno-Kurilsk are much less pronounced than in the bays of Shikotan Island and this probably is one of the main reasons why the observed tsunami waves at this site are much weaker than at other sites located in the same area (Table 2).
Table 2. Statistical characteristics of the 13 January 2007 Kuril Islands tsunami estimated from tide gauge records from Russian and Japanese
stations near the source region.
Station Coordinates Sampling (min) First wave Maximum wave
Latitude Longitude Arrival time Travel time Sign Observed height Arrival time
(◦N) (◦E) (UTC) (h:min) (cm) (UTC)
Yuzhno-Kurilsk 44.02 145.87 5.0* 06:12 1:49 + 11 14:05 Malokurilsk TG+ 43.85 146.60 1.0* 05:32 1:09 + 72 06:53 Malokurilsk Bay# 43.84 146.62 1.0 05:32 1:09 + 57.7 06:53 Krabovaya Bay# 43.82 146.51 1.0 05:41 1:18 + 41.9 06:34 Wakkanai 45.42 141.68 0.25 07:51 3:28 + 8.2 08:32 Abashiri 44.02 144.28 0.25 06:26 2:03 + 16.8 07:34 Hanasaki 43.28 145.57 0.25 05:43 1:20 – 28.3 08:32 Kushiro 42.97 144.38 0.25 05:53 1:30 – 25.7 21:38 Tokachiko 42.30 143.32 1.0 06:04 1:41 – 27.3 13:37 Urakawa 42.17 142.78 1.0 ? ? ? 35.3 13:28 Hachinohe 40.53 141.53 0.25 06:25 2:02 – 29.1 12:49 +
Coastal analog tide gauge.
#Digital bottom pressure station.
∗Analog digitized records from coastal float-type tide gauges.
Tsunami waves in 2006 and 2007 were recorded at the same sites on Hokkaido coast and northeastern Honshu coast. However, typical wave heights associated with the 2007 event were only 20–30 cm, or about 1/2 to 1/3 of the respec-tive 2006 wave heights (Table 2, Fig. 5). Although the first 2007 tsunami wave arrival at Urakawa was poorly defined at four other sites on the Pacific coast (Hanasaki, Kushiro, Tokachiko and Hachinohe), it was still quite evident (Ta-ble 2). What is remarka(Ta-ble is that the 2007 tsunami travel times at all four sites were only 4 min longer than the 2006 tsunami travel times at the same sites (Table 1), indicating extraordinary consistency in tsunami propagation. The signs of the first wave for the two events at these sites were oppo-sites: positive for the 2006 tsunami and negative for the 2007 tsunami. Similarly, open-ocean DART stations also recorded a first positive wave for the 2006 event and a first negative wave for the 2007 event (cf. Tanioka et al., 2008; Fujii and Satake, 2007; Kowalik et al., 2008), in good agreement with the known mechanisms for the seismic sources: thrust fault (2006) and normal fault (2007) (Global CMT, 2006, 2007; Fujii and Satake, 2007).
Differences in travel time for the 2006 and 2007 tsunamis to Abashiri (Sea of Okhotsk) and Wakkanai (La Perouse Strait) on the northern Hokkaido coast were 12 and 7 min, respectively, only marginally longer than the 4 min travel time differences to these Pacific stations noted in the pre-vious paragraph. Travel times were slightly longer in 2007. The sign of the first wave at these two sites, as well as at “in-ner” sites Malokurilsk and Yuzhno-Kurilsk (both located in the Yuzhno-Kurisk Strait separating Shikotan and Kunashir islands; Fig. 1) was the same for both events.
Table 2 and Figs. 4 and 5 further reveal that at all northern stations except those at Yuzhno-Kurilsk (specifically, Mal-okurilsk, Krabovaya, Wakkanai, Abashiri, and Hanasaki), maximum waves occurred 40 min to 3 h after the first wave arrival. In contrast, maximum wave heights at the south-ern group of stations (Kushiro, Tokachiko, Urakawa and Hachinoche) occurred 6 to 12 h after the first tsunami ar-rivals. Assuming that these much later arrivals at the “south-ern” stations were related to tsunami reflection from the Emperor Ridge or other large-scale Pacific topographic fea-tures, as suggested by Tonioka et al. (2008) and Kowalik et al. (2008), then the earlier maximum amplitude waves recorded at the “northern” stations are unlikely to have been reflected waves.
4 Numerical modeling
To further examine the properties of the 2006 and 2007 tsunamis, we constructed a numerical tsunami generation and propagation model formulated in a spherical geograph-ical coordinate system. The model has two computational domains: (1) a full Pacific Ocean domain with a 2-min ETOPO2 seafloor topographic grid (Smith and Sandwel, 1997); and (2) a Northwestern Pacific domain, which
in-cludes the rectangular area shown in Fig. 1 (40.0◦–60.0◦N;
140.0◦–165.0◦E) with 1-min GEBCO topographic data
(British Oceanographic Data Centre, 2003). Tsunami waves simulated by the first model were compared with open-ocean island and DART tsunami data in order to verify the model and to specify the initial 2006 and 2007 source parameters; the second model was subsequently used to simulate tsunami
waves for the near-field region and to calculate maximum tsunami wave amplitudes along the Kuril Islands.
4.1 Source parameters
The available fault models, such as the Global CMT (Har-vard), JMA, USGS, NEIC (National Earthquake Informa-tion Center), and GSRAS (Geophysical Service, Russian Academy of Sciences) models, give significantly different source parameters for the 2006 and 2007 earthquakes, mag-nitude included. For example, according to the CMT and
USGS estimates, the magnitudes (Mw) of the 2006 and 2007
earthquakes were 8.3 and 8.1, respectively, indicating that the first earthquake was stronger than the second. In con-trast, the magnitudes determined by the Japan Meteorologi-cal Agency (JMA) were 7.9 and 8.2, indicating that the 2007 event was larger (Fujii and Satake, 2007). None of these seismic models defines the spatial extent of the source area, which is normally identified on the basis of aftershock dis-tributions. The contradictions in estimated seismic parame-ters, including seismic moments and source sizes, prompted scientists to use inversion of the observed tsunami wave-forms to reconstruct the initial tsunami sources (cf. Tanioka et al., 2008; Fujii and Satake, 2007). In our numerical mod-eling of the 2006 and 2007 tsunami wave propagation, we used the finite failure source models constructed by Ji (2006, 2007). These models provide much more detailed informa-tion than conveninforma-tional models on the spatial displacements in the source areas and enable us to avoid uncertainties in source sizes. The close agreement of our simulated results with observed tsunami waveforms at the open-ocean DART stations (Sect. 4.2) supports the effectiveness of the finite failure source models.
The Ji (2006) analysis was based on teleseismic wave-form approximation (25 P and 21 SH body wavewave-forms), which were first converted into displacement by remov-ing the instrument response and then bandpass filtered from 2 s to 330 s. The fault plane was defined using the
CMT magnitude (Mw=8.3), the USGS hypocenter location
of the (ϕ=46.616◦N; λ=153.224◦E; h=26.7 km) and the
moment tensor solution of the Global CMT (http://www.
globalcmt.org). The low angle nodal plane (Dip=14.89◦;
Strike=220◦) was chosen as the preferred fault plane. This
plane, with dimensions of 400 km (along strike) by 137.5 km (across strike), was divided into 220 subfaults (20 km by
12.5 km). Long period surface waves were used to
im-prove the resolutions and to estimate downdip variation. The
seismic moment release of this model was 3.9×10²¹N m,
which is slightly larger than the Global CMT solution
(3.4×10²¹N m).
Using the equations of Okada (1985), we reformulated the slip distribution from Ji (2006) into 220 subfaults with ver-tical seafloor displacements. Such displacements (Fig. 6a) have a typical dipole structure oriented along the island chain with the uplift zone on the ocean-side and the subsidence
30 cm
Relative sea level
Hanasaki Kushiro Tokachiko Urakawa Hachinohe 18 06 12 06 00
Time (hours, days)
13 Jan 00 14 Jan
E TAT Tsunami
Japanese stations Kuril Islands Earthquake (M = 8.1)
of 13 January 2007 w
Wakkanai
Abashiri
Fig. 5. The same as in Fig. 4 but for seven digital tide gauges located
on the coasts of Hokkaido Island and northeastern Honshu Island (Japan).
zone on the island side. The maximum vertical displace-ment is +2.7 m; the length of the source area is about 250 km and the width about 100 km. The classical shallow-water ap-proximation assumes that the sea surface elevation (tsunami source) is the same as the vertical bottom displacement (cf. Kowalik et al., 2008). However, this assumption is not valid for small-scale sources located in deep water (Kajiura, 1963). Therefore, we used the full three-dimensional Laplace equa-tion (LeBlond and Mysak, 1978) to reconstruct the initial tsunami source. This source (Fig. 6c) looks much smoother (in comparison with the bottom displacement) and gives rise to a reduced maximum sea surface elevation of +1.9 m.
A similar approach was used for the 2007 event. The Ji (2007) analysis was based on 21 teleseismic P and 17 SH body waveforms plus 20 long-period Rayleigh waves and 19 long-period Love waves. The fault plane parameters
were based on the CMT magnitude (Mw=8.1) and
hypocen-ter location of the (ϕ=46.29◦N; λ=154.45◦E; h=10.0 km)
2006 Bottom displacement 2007 Displacement / elevation (m) 151° 152° 153° 154° 155° 45° 45° 46° 46° 47° 47° 48° 48° 49° 49°N 151° 152° 153° 154° 155° 156°E Sea surface elevation
Simushir I. Extreme: +2.7 m Extreme: -2.6 m Extreme: -6.8 m Extreme: +1.9 m 1.5 1 10 8 6 4 2 0 -2 -4 -6 -8 -10 9000 8000 7000 6000 5000 4000 3000 2000 1000 0 Depth (m) Ku r il I sl a nd s (a) (c) (b) (d)
Fig. 6. Bottom displacements for (a) the 15 November 2006 and (b) the 13 January 2007 earthquakes constructed according to the
source models of Ji (2006, 2007); (c, d) the corresponding sea sur-face elevations. Numbers in the bottom righthand corner of the boxes indicate maximum displacements of the sea floor or sea sur-face.
better agreement with body waves the USGS hypocenter depth was corrected to h=18.0 km. The nodal plane with
Dip=57.89◦and Strike=42◦was selected based on aftershock
distribution. The plane with 200 km length (along strike) and 35 km width was divided into 175 subfaults (8 km by 5 km). The seismic moment estimated for this model was
1.9×10²¹N m, which is larger than the Global CMT solution
(1.65×10²¹N m) and USGS solution (0.78×10²¹N m).
The vertical seafloor displacement during the 2007 event was based on the Okada (1985) model and calculated as for the 2006 earthquake. The resulting displacement (Fig. 6b) also has a dipole structure but of the opposite sign, with the subsidence zone on the ocean-side zone and the uplift zone on the island-side. This displacement generated a pro-nounced, small-scale trough of −6.8 m elevation; the length of the source area was about 170 km and the width about 50 km. The reconstructed sea surface displacement based on the three-dimensional Laplace equation (Fig. 6d) was smoother and had a considerably smaller maximum trough (−2.6 m elevation).
4.2 Tsunami simulation
Figures 6c and d show the tsunami source areas used for nu-merical simulation of the 2006 and 2007 tsunamis. Simu-lations are based on a shallow-water finite difference model similar to that described by Imamura (1996). For the full
Pa-cific Ocean model, the spatial grid step is 2′and the time step
6 s; for the higher resolution Northwestern Pacific model, the
grid step is 1′ and the time step 3 s. Although a detailed
description of the results for the Pacific model are out of the scope of the present paper (for which focus is on near-source observations), two aspects of the full model domain are worth noting:
1. Modeled energy fluxes for both tsunamis were directed southeastward from the source areas, in the direction of the Hawaiian Islands and Peru-Chile. These find-ings are in good agreement with the numerical results of other authors (cf. Tanioka et al., 2008; Kowalik et al., 2008) and with observations, which show signifi-cant wave heights (more than 1 m for the 2006 event) on the coasts of the Hawaiian Islands and substantial recorded tsunami wave heights on the Pacific coast of South America.
2. The simulated 2006 and 2007 tsunami waves for the open-ocean DART buoy locations, in particular, buoy numbers 21 414, 46 413, 46 408, 46 402, 46 403, and 21 413 (the last one only for the 2007 tsunami) closely matched the observed records at these sites. In particu-lar, the simulated waveforms fitted the observed tsunami waveforms for the first three to four waves and correctly reproduced the arrival times, the sign of the first wave (positive for the 2006 tsunami and negative for the 2007 tsunami), and the recorded wave amplitudes.
Close agreement between the simulated and observed tsunamis, both in a qualitative sense (general character of the tsunami waves as the propagated across the Pacific Ocean) and in a quantitative sense (close agreement with the DART records), support the validity of our constructed source re-gions and confirm the adequate performance of the numeri-cal models. The same models but with factor of two smaller spatial and time steps were used for more detailed numerical simulation for the near-field zone.
The directions of energy propagation from the 2006 and 2007 tsunami sources and the possible effects of topographic features on this propagation have been determined from the energy fluxes (Fig. 7):
E =ρghζ u, (1)
where E=E(ϕ, λ) is the energy flux vector, ρ is the wa-ter density, g is gravitational acceleration, h=h(ϕ, λ) is the water depth, ζ =ζ (ϕ, λ) is the sea surface elevation, and u=u(ϕ, λ) is the water velocity (cf. Kowalik et al., 2008).
In general, the energy fluxes for the two events are simi-lar (Fig. 7a, b): both fluxes are directed to the southeast (i.e., seaward) from the source area. Only a relatively small amount of energy entered the Sea of Okhotsk due to effective sheltering from the tsunami waves by Simushir Island. The two deepest straits within the Kuril Islands, Bussol Strait and Kruzensterna Strait (Fig. 1), provided the main “gateways” for the tsunami energy flux. Had the seismic sources for the tsunamis been located opposite either of these straits, the im-pacts on commercial oil and gas facilities on the northeast-ern shelf of Sakhalin Island could have been much worse. For both events, the tsunami energy “tongue” protrudes into the Sea of Okhotsk (which was a little stronger for the 2006 event) propagated northwestward toward the northern shore of Sakhalin Island. Predictions were for amplification of tsunami waves hitting the northeastern shelf of Sakhalin Is-land with maximum calculated 2006 tsunami wave heights of 0.5–1.0 m on the coast. Regrettably, there are no working tide gauges in this region to compare simulated and recorded waves, but it is known that no destruction was observed on this coast.
Due to wave trapping (LeBlond and Mysak, 1978), part of the tsunami energy propagated southwestward and north-eastward along the Pacific shelf of the Kuril Islands. This effect plays a crucial role in tsunami energy conservation, wave transmission distance, and long-term tsunami ringing (cf., Miller et al., 1962; Kajiura, 1972).
4.3 Maximum wave amplitudes
Results of our numerical modeling were used to estimate maximum tsunami amplitudes (from mean sea level to peak) along the Pacific coasts of the Kuril Islands, northern Hokkaido and southern Kamchatka. All calculations were made for the 5-m isobath (the minimum permissible depth in the model). The results for the 2006 and 2007 events are presented in Figs. 8 and 9, respectively. Because of relatively large spatial grid step (about one nautical mile), the models cannot resolve small-scale resonant effects arising from local topographic effects of individual islands, although the model do enable us to define general properties and to compare lo-cal responses for the two events.
For obvious reasons, maximum amplitudes occur in the vicinity of the Central Kuril Islands source areas. Accord-ing to our computations, highest waves should have been ob-served on Simushir, Ketoy, Srednego, Matua and Rasshua is-lands. Outside this region, wave amplitudes along the Kuril Islands should gradually decay. We note that the distribution of tsunami amplitudes is not symmetric relative to the earth-quake epicenters in that wave amplitudes diminish much more slowly in the northeast direction than in the south-west direction. This asymmetry is apparently associated with topographic differences between the northern and southern shelves of the Kuril Islands; historically, most catastrophic tsunamis for this region (in particular the 1952 event) occur
2006 2007
Pacific Ocean Pacific Ocean
Sea of Okhotsk Sea of Okhotsk
Kamchatka Kamchatka Sakhalin Sakhalin Hokkaido Hokkaido 140° 145° 150° 155° 160° 165°E 40° 60°N 45° 50° 55° 140° 145° 150° 155° 160° 165°E (a) (b) 0 10 20 30 40 50 MJ/m
Fig. 7. Energy fluxes for tsunami waves generated by (a) the November 2006 and (b) the January 2007 earthquakes.
in the region of the Northern Kuril Islands (Soloviev and Go, 1974).
Surprisingly, the highest calculated tsunami amplitudes
(∼6 m) were associated with the smaller (Mw=8.1) 2007
event rather than with the larger (Mw=8.3) 2006 event.
How-ever, the spatial area impacted by the higher 2007 waves was quite limited, in agreement with the narrower and more in-tensive tongue-like distribution of the energy flux associated with the 2007 event (Fig. 7b). Local areas affected by the 2007 tsunami include Srednego Island and Rasshua Island. Outside of these areas, the maximum waves decayed rapidly (Fig. 9), much faster than for the 2006 event (Fig. 8). This effect is probably attributable to the abrupt, escarpment-like bottom displacement of the 2007 source area (Ji, 2007) in the vicinity of Srednego Island and Rasshua Island.
We have likely underestimated maximum tsunami ampli-tudes. Top begin with, the relatively large spatial step (about one nautical mile) of our model does not allow us to re-solve small-scale features of the coast and bottom topogra-phy, which can be responsible for substantial local
amplifi-cation of arriving tsunami waves1. Secondly, the length of
the spatial grid step determines the minimum wavelength and, therefore, the maximum wave frequency that can be simulated numerically. More precisely, the model grid step plays the role of a low-frequency filter which effectively sup-presses high-frequency waves. Such waves were significant during the 2006 and 2007 Kuril events due to the highly con-fined spatial extents of the source regions. Third, direct in situ comparison of actual depths on the Kuril Islands shelf with the GEBCO bathymetry data reveals marked depth dif-ferences, which has the effect of attenuating the simulated
1A classical example of such an effect is the 32-m runup
ob-served in a small valley on Okushiri Island during the 1993 tsunami in the Sea of Japan. Numerical resolution of this runup required a very detailed fine grid model (Titov and Synolakis, 1997).
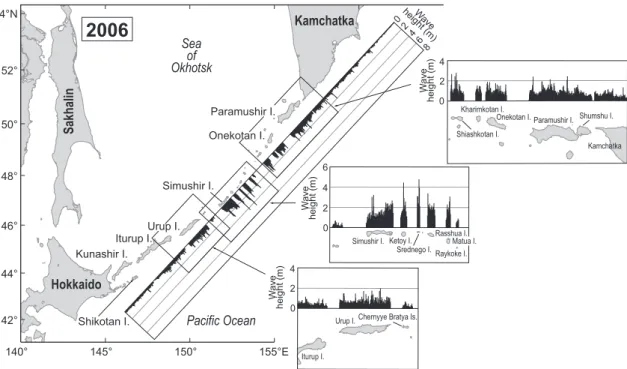
0 2 4 6 8 W ave height (m) 140° 145° 150° 155°E 42° 44° 46° 48° 50° 52° 54°N Kunashir I. Iturup I. Shikotan I. Simushir I. Onekotan I. Paramushir I. Urup I. 0 2 4 Wa v e height (m) Pacific Ocean Sea of Okhotsk Kamchatka Sakhalin Hokkaido
2006
Simushir I. Ketoy I. Rasshua I.Matua I. Raykoke I. Srednego I. 0 2 4 6 W ave height (m) Iturup I.
Urup I.Chernyye Bratya Is.
Onekotan I. Kharimkotan I. Shiashkotan I. Paramushir I. Shumshu I. Kamchatka 0 W ave height (m) 2 4
Fig. 8. Maximum simulated tsunami wave amplitudes along the coast of the Kuril Islands for the tsunami of November 2006.
2007
140° 145° 150° 155°E 42° 44° 46° 48° 50° 52° 54°N Kunashir I. Iturup I. Shikotan I. 0 2 4 6 8 W ave height (m) Onekotan I. Paramushir I. Urup I. 0 2 4 W ave height (m) 0 2 4 6 Wa v e height (m) 0 2 4 W ave height (m) Pacific Ocean Sea of Okhotsk Kamchatka Sakhalin Hokkaido Iturup I.Urup I.Chernyye Bratya Is.
Onekotan I. Kharimkotan I. Shiashkotan I. Paramushir I. Shumshu I. Kamchatka Simushir I.
Simushir I. Ketoy I. Rasshua I.Matua I. Raykoke I. Srednego I.
Fig. 9. Same as Fig. 8 but for the tsunami of January 2007.
wave amplitudes (Michail Nosov, personal communication, 2007). Much more accurate bathymetry and significantly smaller grid steps are necessary for precise simulation of the 2006 and 2007 tsunami events.
5 Discussion and conclusions
Two major tsunamigenic earthquakes with magnitudes of
Mw=8.3 and Mw=8.1 occurred within two months of one
Islands. Despite the close proximity of the two source areas (separation of about 100 km) and the fact that the earthquakes appear to have been closely related, the earthquakes had sub-stantially different deformation characteristics; the earlier 15 November 2006 event was a thrust fault earthquake while the later 13 January 2006 event was a normal fault earth-quake. As a consequence, the tsunamis generated by the two events had both similarities and differences. We can summa-rize these specific features as follows.
I. Similarities
(a) The tsunami sources for the 2006 and 2007 events were nearly co-located, the source region for the 2007 event only slightly eastward of that for the 2006 event. (b) Both tsunamis were trans-oceanic, crossing the Pacific
Ocean to be clearly recorded on the coasts of Peru, Chile and New Zealand.
(c) Tsunami energy fluxes originating from both the 2006 and 2007 source areas were mainly directed southeast-ward tosoutheast-ward the Hawaiian Islands and South America. (d) Little energy propagated northwestward into the Sea of
Okhotsk where recorded tsunami waves were small. (e) Both tsunamis had distinctive high-frequency content,
with typical wave periods ranging from 2-3 to 15-20 min.
(f) For both tsunamis at most sites (except those located in close vicinity to the source areas), maximum waves oc-curred a considerable time (∼5 h) after the first wave arrivals, a finding that supports the notion that the late-arrival maximum waves were “secondary” tsunami waves reflected from large-scale bottom features such as the Emperor Ridge.
II. Differences
(a) Due the difference in polarity of the two seismic sources, the signs of the first waves were opposite: pos-itive for the 2006 tsunami and negative for the 2007 tsunami.
(b) The hazardous impact of the 2007 tsunami at remote sites, such as Crescent City, was highly tempered com-pared to the 2006 tsunami due the reduced wave energy (the ratio of 2006/2007 far-field wave heights is typi-cally around 3:1).
(c) The extension and width of the 2007 source area were significantly smaller than those of the 2006 event; con-sequently the 2007 tsunami had higher dominant fre-quencies and likely experienced stronger dispersion during propagation.
(d) Due to the specific parameters of the 2007 source area (narrow, with sharp local displacement) numerical mod-eling indicates that, due to differences in their seismic source properties, the 2007 tsunami was more focused and the 2006 tsunami was more wide-spread; the sim-ulated energy flux for the 2007 event has the focused form of searchlight (Fig. 7b), while the more diffuse flux of the 2006 event has the appearance a floodlight (Fig. 7a).
(e) The 2006 source area was closer to shore than the 2007 source area, resulting in more of the energy from the 2006 event to become “trapped” over the Kuril shelf where it propagated as edge waves along the Kuril Is-lands. For the 2007 tsunami, a higher percentage of the energy radiated into the open ocean as non-trapped (leaky) waves.
The results of our analysis and numerical modeling high-light the fact that earthquakes of comparable magnitude from adjacent source regions do not necessarily generate identical tsunami wave fields. Differences in the spatial extent, depth, and fault structure of closely related earthquakes can lead to distinct tsunami responses, including differences in max-imum wave amplitude, dominant frequency content, leading wave polarity, and directions of energy propagation. These differences can subsequently lead to markedly different res-onant responses at near and far-field locations. Such fac-tors must be taken into account when modeling the ocean response to earthquakes and when attempting to use tsunami observations to delineate possible source parameters.
We further emphasize that our numerical results are based on a tsunami source model that is more comprehensive and has fewer free parameters than most source models typically used for tsunami wave simulation. Our modeling results are distinct in two major ways:
(a) In use of the Finite failure source models constructed by Ji (2006, 2007). Because these models are “self-sufficient”, in that they do not require additional inde-terminate parameters such as source area extent, and have more degrees of freedom than conventional seis-mic models, they provide better definition of seafloor displacement in the source area. Specific small-scale seafloor displacement features are likely responsible for some of the observed structure in tsunami waveforms. Such structure cannot be resolved using conventional source models.
(b) In the Avoidance of the shallow-water approximation for the sea surface elevations. For deep-ocean source re-gions with relatively confined spatial extent such as the Kuril Islands earthquakes (especially, the 2007 source area), use of the more generalized equations of motion is important.
Features (a) and (b) constitute critical advancements in the modeling of the 2006 and 2007 events. It is also clear that much more detailed and precise bathymetry is needed for the Kuril shelf and straits if we are to provide more accu-rate simulation of tsunami propagation and wave heights for the near-source zone.
Acknowledgements. We thank V. Kaistrenko and G. Bogdanov (IMGG, Yuzhno-Sakhalinsk, Russia) for permitting us to use the bottom pressure data for stations in Malokurilsk and Krabovaya bays, Y. Tanioka (Hokkaido University, Sapporo, Japan) for providing the coastal tide gauge data for Hokkaido and Honshu islands and Y. Hasegawa (JMA, Tokyo, Japan) for sending us
additional information on these tide gauges. We also thank
P. Kimber (Sidney, BC) and M. Krassovski (University of Victoria, BC) for drafting the figures and C. Wright for coordinating the electronic submissions. A. Rabinovich and E. Kulikov were partly supported by the Russian Foundation on Basic Research (RFBR) grants 05-05-64585 and 06-05-08108.
Edited by: P. Fabian
Reviewed by: J. McCloskey and another anonymous referee
References
British Oceanographic Data Centre: GEBCO Digital Atlas, 2003. Djumagaliev, V. A. and Rabinovich, A. B.: Long wave
investiga-tions at the shelf and in the bays of the South Kuril Islands, J. Korean Soc. Coastal Ocean Engineers, 5(4), 318–328, 1993. Djumagaliev, V. A, Rabinovich, A. B., and Fine, I. V.:
Theoreti-cal and experimental estimation of transfer peculiarities of the Malokurilsk Bay coast, the Island of Shikotan, Atmos. Oceanic Phys., 30(5), 680–686, 1994.
Fujii, Y. and Satake, K.: Tsunami sources of November 2006 and January 2007 great Kuril earthquakes, Bull. Seism. Soc. Amer., accepted, 2007.
Global CMT Web Page: http://www.globalcmt.org/, 2006, 2007. Imamura, F.: Review of tsunami simulation with a finite difference
method, in: Long-Wave Run-up Models, edited by: Yeah, H., Liu, P., and Synolakis, C., World Scientific, 25–42, 1996. Ji, C.: Rupture process of the 2006 November 15 Magnitude 8.3
Kuril Island Earthquake, http://earthquake.usgs.gov/eqcenter/ eqinthenews/2006/usvcam/finite fault.php, 2006.
Ji, C.: Rupture process of the 2007 January 13 Magnitude 8.1 Kuril Island Earthquake, http://earthquake.usgs.gov/eqcenter/ eqinthenews/2007/us2007xmae/finite fault.php, 2007.
Kajiura, K.: The leading wave of a tsunami, Bull. Earthq. Res. Inst., 41, 535–571, 1963.
Kajiura, K.: The directivity of energy radiation of the tsunami gen-erated in the vicinity of a continental shelf, J. Oceanogr. Soc. Japan, 28, 260–277, 1972.
Kowalik, Z., Horillo, J., Knight, W., and Logan, T.: The Kuril Is-lands tsunami of November 2006: Part I: Impact at Crescent City by distant scattering, J. Geophys. Res., 213, in press, 2008. Laverov, N. P., Lappo, S. S., Lobkovsky, L. I., Baranov, B. V.,
Kulinich, R. G., and Karp, B. Ya.: The Central Kuril “Gap”: Structure and seismic potential, Doklady Earth Sciences, 409(6), 787–790, 2006a.
Laverov, N. P., Lappo, S. S., Lobkovsky, L. I., and Kulikov, E. A.: Extreme earthquakes and catastrophic tsunamis: Analysis, modeling, and forecasting, (in Russian), in: Fundamental inves-tigations of oceans and seas, Vol. 1, Nauka, Moscow, 191–209, 2006b.
LeBlond, P. H. and Mysak, L. A.: Waves in the Ocean, Elsevier, Amsterdam, 602 pp., 1978.
Lobkovsky, L. I.: A fully destructive wave (in Russian), in: World of Science, 5, 74–81, 2005.
Lobkovsky, L. and Kulikov, E.: Analysis of hypothetical strong earthquake and tsunami in the Central Kuril Arc, Geophys. Res. Abstr., 8, 04138, 2006.
Lobkovsky, L. I., Mazova, R. Kh., Kataeva, L. Yu., and Baranov, B. V.: Generation and propagation of catastrophic tsunamis in the Sea of Okhotsk basin: Possible scenarios, Doklady Earth Sci-ences, 410(7), 1156–1159, 2006.
McCann, W. R., Nishenko, S. P., Sykes L. R., and Krause, J.: Seis-mic gaps and plate tectonics: SeisSeis-mic potential for major bound-aries, Pure Appl. Geophys., 117, 1082–1147, 1979.
Miller, G. R., Munk, W. H., and Snodgrass F. E.: Long-period waves over California’s continental borderland, II, Tsunamis, J. Mar. Res., 20(1), 31–41, 1962.
Okada, Y.: Surface deformation due to shear and tenisle faults in a half-space, Bull. Seism. Soc. Amer., 75, 1135–1154, 1985. Rabinovich, A. B.: Spectral analysis of tsunami waves:
Separa-tion of source and topography effects, J. Geophys. Res., 102(C6), 12 663–12 676, 1997.
Rabinovich, A. B. and Leviant, A. S.: Influence of seiche oscilla-tions on the formation of the long-wave spectrum near the coast of the Southern Kuriles, Oceanology, 32(1), 17–23, 1992. Rabinovich, A. B. and Monserrat, S.: Generation of meteorological
tsunamis (large amplitude seiches) near the Balearic and Kuril Islands, Nat. Hazards, 18(1), 27–55, 1998.
Rabinovich, A. B., Thomson, R. E., and Stephenson, F. E.: The Sumatra Tsunami of 26 December 2004 as observed in the North Pacific and North Atlantic oceans, Surv. Geophys., 27, 647–677, 2006.
Rabinovich, A. B. and Thomson, R. E.: The 26 December 2004 Sumatra tsunami: Analysis of tide gauge data from the World Ocean Part 1. Indian Ocean and South Africa, Pure Appl. Geo-phys., 164(2/3), 261–308, 2007.
Smith, W. H. F. and Sandwell, D. T.: Global sea floor topogra-phy from satellite altimetry and ship depth soundings, Science, 277(5334), 1956–1962, 1997.
Soloviev, S. L. and Go, Ch. N.: Catalogue of tsunamis on the west-ern shore of the Pacific Ocean, Nauka, Moscow, 310 pp., 1974 (in Russian; English translation: Canadian Transl. Fish. Acuatic Sci., No. 5078, Ottawa, 439 pp., 1984).
Tanioka, Y., Hasegawa, Y., and Kuwayama, T.: Tsunami wave-form analyses of the 2006 underthrust and 2007 outer-rise Kurile earthquakes, Adv. Geosci., 14 (this special volume), 2008. Titov, V. V. and Synolakis C. E.: Extreme inundation flows during
the Hokkaido-Nansei-Oki tsunami, Geophys. Res. Lett., 24(11), 1315–1318, 1997.
Titov, V. V., Rabinovich, A. B., Mofjeld, H., Thomson, R. E., and Gonz´alez, F. I.: The global reach of the 26 December 2004 Sumatra tsunami, Science, 309, 2045–2048, 2005.