ENGINEERING SCHOOL
JET PUMP COOLING FOR DEEP MINES
A THESIS SUBMITTED IN PARTIAL FULFILLMENT OF THE REQUIREMENTS FOR
THE DEGREE OF MASTER OF ENGINEERING
BY
JAVIERRICOPAEZ
Mise en garde
La bibliothèque du Cégep de l’Témiscamingue et de l’Université du Québec en Abitibi-Témiscamingue a obtenu l’autorisation de l’auteur de ce document afin de diffuser, dans un but non lucratif, une copie de son œuvre dans Depositum, site d’archives numériques, gratuit et accessible à tous.
L’auteur conserve néanmoins ses droits de propriété intellectuelle, dont son droit d’auteur, sur cette œuvre. Il est donc interdit de reproduire ou de publier en totalité ou en partie ce document sans l’autorisation de l’auteur.
Warning
The library of the Cégep de l’Témiscamingue and the Université du Québec en Abitibi-Témiscamingue obtained the permission of the author to use a copy of this document for non-profit purposes in order to put it in the open archives Depositum, which is free and accessible to all.
The author retains ownership of the copyright on this document. Neither the whole document, nor substantial extracts from it, may be printed or otherwise reproduced without the author's permission.
ACKNOWLEDGEMENTS
1 would like to express my gratitude towards my supervisor Professor Dean Millar who provided me this incredible opportunity for personal and professional development. 1 believe that the experience 1 acquired throughout my Master's studies have been the key to the next step in my career path.
1 am also grateful towards Marin Ene, François Godard and Guyh Dituba Ngoma, who gave me the opportunity to be part of this program at UQAT and help me to achieve my goals. Besicles Maxime Mailloux, Joseph Maurency Zan ga and Fe dy Boukhris, who helped me out during my time at UQAT.
Special acknowledgment to the Ultra Deep Mining Network for funding this research, without which 1 would not have been able to pursue.
1 would also like to acknowledge my colleagues at MIRARCO, specially Alex Hutchison, Stephen Young, Valeria Pavese and Harvard Farrant who gave me always a new idea to keep going. 1 would also like to thank Ethan Armit and Saruna Kunwar for the ir help during the laboratory test and Greg Lakanen for his invaluable help to fabricate the model. Moreover my friends Marta Rios and Alberto Romero who supported me when 1 was discouraged and pushed me to my goal.
Finally 1 would like to thank my family and my girlfriend for continued encouragement and support.
Thank you very much
TABLE OF CONTENTS
Université du québec en abitibi-témiscamingue ... i
Acknowledgements ... ii
Table of contents ... iii
List of figures ... viii
List of tables ... xiii
Résumé ... 1 Abstract ... 2 Nomenclature ... 3 Chapter 1 ... 10 General introduction ... 10 1.1 Introduction ... 10
1.2 Sources ofheat in the sub-surface ... 12
1.2.1 Effect of auto-compression and geothermal gradient on ventilation airtemperatures ... 12
1.2.2 Latent heating/cooling and sensible heating/cooling ... 17
1.2.3 Broken rock underground ... 20
1.2.4 Other sources ofheat in mine workings ... 20
1.2. 5 Thresholds on underground air t emperatures ... 21
1.2.6 Need for cooling ... 22
1.3 Aim ofthis work ... 23
1.4 Re se arch methodology ... 25
Review of the theory and context of reverse Brayton refrigeration cycle ... 27
2.1 Vapor compression refrigeration systems ... 27
2.2 Brayton Power and Refrigeration Cycles ... 30
2.3 Applying RBRC to cooling for deep mines ... 39
2.4 Hydraulic Air Compressor ... 45
2. 5 Applying HAC to cooling for deep mines ... 51
2.6 Why does gas get cold when it is expanded? ... 52
2.6.1 Compressibility factor and ideality of gas ... ... .. 53
2.6.2 Joule-Thompson Effect ... 56
2.7 Turbo-expander ... ... ... ... 57
2.8 Summary ... 60
Chapter 3 ... 62
Review of ejector design and performance ... 62
3.1 Introduction ... 62
3.2 General goveming equations ... 65
3.2.1 Conservation of mass ... 67
3.2.2 Conservation ofLinear momentum ... 68
3.2.3 Conservation of energy ... 69
3.3 Review ofthe design and performance of ejectors ... 71
3.3.1 Thermodynamic modeZ ofejector's design ... 72
3.3.2 CPM ModeZ ... 72
3.4 Expected performance ... 73
3. 5 Design geometry comparison ... 77
3.6 Comparison of thermodynarnic conditions for a turbo-expander and
ejector ... ... ... ... ... 81
3. 7 Discussion ... ... ... ... ... 86
Chapter 4 ... 88
Design of a motive nozzle ... 88
4.1 Introduction ... 88
4.2 Pressure, velocity and temperature profiles in a CD nozzle ... 90
4.3 CD nozzle design formulation ... 93
4.4 Performance of small sc ale rocket motor CD nozzle ... 96
4.4.1 Performance prediction ... 97
4.4.2 Experimental performance ... 101
4.5 Performance of a modified laboratory scale CD nozzle ... 103
4.5.1 Performance prediction ... 103
4.5.2 Experimental performance ... 105
4.6 Performance of a CD nozzle for 750 Scfm mass flow ... 107
4. 6.1 Performance prediction ... 108
4. 6. 2 Experimental performance ... 109
4.7 Performance of a CD motive nozzle for a mine scale ejector ... 112
4. 8 Discussion ... 114
Chapter 5 ... 115
Design and performance of a lab sc ale cooling ejector ... 115
5 .1 Introduction ... 115
5.2 Experimental pro gram using a lab scale cooling ej ector ... 115
5.2.2 Description ofthe ejector test rig ... 121
5.2.3 Testing procedure ... 125
5.2.4 Presentation ofresults ... 140
5.2.5 Discussion and conclusion ... 142
5.3 CFD simulation of a lab scale cooling ejector ... 143
5.3.1 Geometryofejector ... 143
5.3.2 Boundary and initial conditions applied ... 145
5.3.3 Method of monitoring the CFD modeZ ... 145
5.3.4 Presentation ofresults ... 146
5.3.5 Comparison ofCFD results with experimental values ... 150
5. 3. 6 Motive nozzle performance verification ... 151
5.4 Discussion ... 156
Chapter 6 .... ... ... ... ... ... 157
CFD simulation of a mine scale cooling ej ector. ... 157
6.1 Introduction ... 157
6.2 Review of CFD simulations of ejectors ... 157
6.3 Outline description of Fluent ... 159
6.3.1 Mesh settings ... 160
6.3.2 Ejector Si mulation approach ... 16 1 6.4 Min e-scale ejector set up and orientating simulations ... 162
6.5 CFD simulations varying motive nozzle and mixing section diameters ... 165
6.6 CFD simulations varying the motive nozzle mass fl ow r at e and the pressure across the ejector ... 169
6.8 Discussion and conclusion ... 176
Chapter 7 ... ... ... ... ... 177
Results and Discussion ... 177
7.1 For the lab scale ejector, experimental results and CFD results qualitatively agree ... 177
7.2 For nozzle sizes and scales analysed, predictions from the CD nozzle simulation tool were consistent with observations ... ... 178
7.3 As motive nozzle cooling, and ejector performance have been verified at small scale, the CFD results for mine scale performance are supported ... 179
Chapter 8 ... 183
Conclusions ... 183
8.1 Outline ofthe main findings of this work ... 183
References ... 186
Appendices ... 195
Appendix A- Nozzle -Mixing diameter simulations graphie contours ... 195
Appendix B - Fan curves, Mine scale mo del ... 205
Appendix C - Nozzle position, Mine scale mode ... 223
LIST OF FIGURES
Figure 1: Downcast shaft ... 13
Figure 2: Cornwall winter daytime where surface air temperature is lower than the surface VR T ... 15
Figure 3: Canada winter nighttime where both effects occur ... 16
Figure 4: Canada summer daytime where surface air temperature is higher than the surface VR T ... 16
Figure 5: Cornwall summer nighttime where both effect occur. ... 17
Figure 6: Impact ofwetness fraction in latent heating power, for varying working level depths (VR Ts ) ... ... ... ... 18
Figure 7: Impact of wetness fraction in sensible heating power for varying working level depths (VRTs) ... 19
Figure 8: Schematic diagram of ejector performance (Huang et al., 1999) ... 23
Figure 9: Vapor compressor refrigeration cycle ... 30
Figure 10: Equipment for an open Brayton cycle power plant.. ... 31
Figure 11: Equipment for a closed Brayton cycle power plant.. ... 32
Figure 12: Equipment for a closed Brayton cycle refrigeration plant.. ... 34
Figure 13: Ideal and non-ideal Brayton power cycle ... 35
Figure 14: Brayton Refrigeration and Power cycle ... 38
Figure 15: Schematic diagram RBRC from Del Castillo (1988) ... 40
Figure 16: Schematic T-S diagram for the cooling air, in Del Castillo (1988) air cycle system ... 42
Figure 17: RBRC with conventional compressor + aftercooler (blue) and HAC (red) ... 43
Figure 18: HAC Schematic (Mill ar, 2014) ... 46
Figure 19: HAC in Ragged Chutes (Taylor, 1913) ... 47
Figure 21: Modified Sc hematie diagram from Del Castillo ( 1988) including the HAC
... 52
Figure 22: Generalized compressibility chart low pressure range (Obert, 1960) ... 54
Figure 23: Joule-Thompson coefficient ... 57
Figure 24: GE expander efficiency performance ... 58
Figure 25: Cutaway rendering of a turbo-expander (GE, 2014) ... 59
Figure 26: CD nozzle inside CD nozzle (Millar et al., 2016) ... 63
Figure 27: Schematic diagram of ejector, illustrating terminology adopted for different parts of the system ... ... ... ... 65
Figure 28: Control volume (Wassgren, 201 0) ... 66
Figure 29: Small element of control surface of the control volume (Wassgren, 2010) ... 66
Figure 30: V ector Forees, Momentum and Weight ... 68
Figure 31: Schematic diagram of ejector performance (Huang et al., 1999) ... 71
Figure 32: Turbo-expander (left) and Ejector (right) schematic ... 81
Figure 33: T -S diagram for ideal and irreversible turbo-expander processes ... 84
Figure 34: Divergent, Convergent-Divergent and Convergent nozzle ... 89
Figure 35: Nozzle flow patterns from Devenport, 2001 ... 90
Figure 36: Pressure distribution along the nozzle from Devenport, 2001 ... 92
Figure 37: Schematic for subsonic-supersonic isentropic nozzle flow ... 93
Figure 38: Schematic of a premanufactured rocket nozzle ... 96
Figure 39: Shape of the nozzle, temperature, Mach number and pressure profiles on-design ... 99
Figure 40: Shape of the nozzle, temperature, Mach number and pressure profiles off-design ... 101
Figure 41: Thermal image of nozzle and thermometer ... 102
Figure 42: Shape ofthe nozzle, temperature, Mach number and pressure profiles of modified nozzle ... 105
Figure 44: Shape of the nozzle, temperature, Mach number and pressure profiles of
modified nozzle ... ... ... ... ... 109
Figure 45: Thermal image ofmodified nozzle and thermometer ... 110
Figure 46: Shape of the nozzle, temperature, mach number and pressure profiles of modified nozzle ... 113
Figure 47: Rocket nozzle, lateral view ... 117
Figure 48: Rocket nozzle, top view ... 118
Figure 49: Coup ling section, lateral view ... 118
Figure 50: Coup ling section, top view ... 119
Figure 51: Suction-Mixing chamber, lateral view ... 120
Figure 52: Suction-Mixing chamber, lateral view ... 120
Figure 53: Diffuser, lateral view ... 121
Figure 54: Schematic ofthe laboratory experiment ... 122
Figure 55: Laboratory setup, ejector. ... 123
Figure 56: Setup of the ventilation rig ... 124
Figure 57: Setup nozzle experiment ... 126
Figure 58: Zoom exit nozzle and thermometer. ... 127
Figure 59: Thermal image of nozzle and thermometer ... 127
Figure 60: High speed air jet impinging on steel 'drogue' bar during test. Drogue surface was not polished and was oxidized ... 134
Figure 61: Thermal image of the drogue held within impinging air jet issuing from nozzle. Taken from a position so that drogue is positioned between nozzle and thermal imaging camera, such that the spot temperature (of7.7°C) measures the temperature ofthe rear (lee side) ofthe steel bar ... 136
Figure 62: Thermal image ofthe steel drogue held within the impinging air jet in order to sense the latter temperature. Image taken from a direction looking onto the face of the drogue. Spot temperature (of 7.0°C) location is approximately normal to viewing direction ... 137
Figure 63: Thermal image ofthe nozzle mounted on the compressor while air jet issuing
from nozzle. Highest temperature sensed is 78.3°C (off the inner surface of the
nozzle viewed through the orifice), corresponding approximately to spot value
beneath cross hairs (76.6°C). Note that nozzle exterior surface was non-oxidized and reflective. The 2 inch adapter upon which the nozzle was mounted was made
of steel that was highly oxidised ... 13 8
Figure 64: Thermal image of the steel drogue used to sense the temperature of the
impinging air jet. Lowest temperature sensed on the upper surface of the cylindrical drogue (-16.7°C). Spot temperature on the ground below drogue
(5.4°C) ... 139
Figure 65: Geometry final ofthe eductor. ... ... ... 144
Figure 66: XY plane for static pressure at NXP 72, 60 and 48 ... 147
Figure 67: XY plane for velo city magnitude at NXP 72, 60 and 48 ... 148
Figure 68: XY plane for static temperature at NXP 72, 60 and 48 ... 149
Figure 69: XY plane for rocket motive nozzle ... 152
Figure 70: Thermal image for 11 bar gauge ... 153
Figure 71: XY plane for alternative motive nozzle ... 155
Figure 72: Ejector geometry in 3D ... 164
Figure 73: Cross sectional plane XY for static pressure, velocity magnitude and static temperature (Nozzle diameter 152.4 mm, 1.25 rn mixing chamber) for intake secondary air temperature of 312.15K and pressure rise across ejector of+ 1 OOOPa ... 167
Figure 74: Parametric investigation: temperature-mixing chamber diameter.. ... 168
Figure 75: Parametric investigation: entrainment mass flow-mixing chamber diameter ... 168
Figure 76: Parametric investigation: Fan curves ... 171
Figure 77: Cross sectional plane XY for static pressure, velocity magnitude and static temperature (mass flow 22.36 kg/s, Pressure 1000 Pa) ... 173
Figure 79: Parametric investigation: Mass flow-Nozzle length ... 175
Figure 80: NXP for the ejector. ... ... ... ... ... ... ... 176
Figure 81: Cooling effect ofnozzle size ... 180
LIST OF TABLES
Table 1: ACGIH threshold limit values for WBGT ... 22
Table 2: HAC installations (Langbome, 1979) ... 48
Table 3: Ragged Chutes Installation ... 49
Table 4: Compressibility factor Z, verification for air. ... 55
Table 5: Review of previous studies about ejector efficiencies ... ... 75
Table 6: Design geometry comparison ... 80
Table 7: On-design conditions ... 98
Table 8: Off-design conditions ... 100
Table 9: Temperatures off design comparison ... 103
Table 10: Modified conditions lab sc ale ... 104
Table 11: Temperatures lab scale comparison ... 107
Table 12: Field Modified conditions ... 108
Table 13: Temperatures field comparison ... 111
Table 14: Mine scale conditions ... 112
Table 15: Instrumentation used for the test ... 125
Table 16: Initial values ... 129
Table 17: Isentropic values ... 130
Table 18: Actual values ... 130
Table 19: Results from secondary mass flow blocked according to NXP ... 131
Table 20: Mass flow calculations ... 131
Table 21: Throat mass flow ... 132
Table 22: Nozzle exit mass flow ... 132
Table 24: Prediction for the field nozzle test ... 13 5
Table 25: Final test measurements ... 141
Table 26: Results from experiments ... 142
Table 27: Values expected for the CFD simulation ... 145
Table 28: Numerical results comparison ... 150
Table 29: Numerical values ... 151
Table 30: Numerical values for new nozzle design ... 154
Table 31: Boundary conditions for inlets and outlet in the CDF simulation ... 163
Table 32: Geometry parameters for the first stable simulation ... 164
Table 33: Entrained mass flow and eductor outlet (mixed) air temperature for an inlet secondary air temperature of 312.15K and a pressure rise of 1 OOOPa across the eductor ... 166
Table 34: 'Fan curves' according to the primary mass flow and pressure increase . 172 Table 35: Mass flow and temperature according to the nozzle position ... 174
Une des options possibles pour répondre au besoin de réfrigération dans les mines souterraines profondes est l'utilisation d'une turbine de détente ou d'un turbodétendeur, telle qu'elle est actuellement utilisée dans les systèmes classiques de réfrigération et de liquéfaction des gaz. Dans ces domaines, cette technologie est bien connue et exploite leur haute efficacité isentropique qui se traduit par une meilleure performance de refroidissement. L'électricité peut être générée comme un sous-produit de l'expansion de l'air comprimé dans ces systèmes. Cependant, ces machines nécessitent un entretien mécanique régulier, peuvent geler si elles ne sont pas correctement conçues, sont coûteuses et dans la sous-surface nécessitera de grandes fouilles. Au lieu de cela, ce travail considère le turbocompresseur remplacé par un simple, plus petit, pas de pièces mobiles et donc plus économique solution: l'éjecteur. Au lieu d'extraire le travail m écanique de l'arbre pendant le processus d'expansion et de refroidissement de l'air, un éjecteur peut entraîner un écoulement secondaire avec son jet d'air primaire à grande vitesse. Un projet d'éjecteur est proposé, comprenant une galerie souten·aine de 4 mètres de diamètre et 32 mètres de long, avec une section initiale convergente, contenant un tuyau de 152,4 mm délivrant un jet d'air comprimé, envoyé à une gorge étroite et ensuite à un divergent, Section de récupération de pression. La conception est soutenue par des calculs thermodynamiques. À l'entrée, le débit d'air secondaire est supposé être à 39 o C reflétant la température de l'air qui doit être refroidi. Le jet d'air comprend un débit massique de 22,36 kg 1 s à -71,32 o C. Une élévation de pression statique de 1 kPa est maintenue de l'entrée à la sortie (à la sortie du diffuseur) où le débit massique de l'air est de 243,82 kg 1 s (y compris le débit d'air secondaire) à 29,02 o C. Comme l'air comprenant le jet est plus sec que le flux d'air secondaire, à travers le processus de mélange, l'humidité de l'air est également réduite. En bref, le système se comporte comme un ventilateur auxiliaire qui refroidit et déshumidificateur.
Abstract
One option to address the need for refrigeration in deep underground mines is the use of an expansion turbine, or turbo-expander, as currently used in conventional
refrigeration and gas liquefaction systems. In these other fields, this technology is well
known and exploits their high isentropic efficiency which results in better cooling
performance. Electricity can be generated as a by-product of expansion of compressed
air in those systems. However, such machines require regular mechanical maintenance,
can freeze up if not correctly designed, are expensive, and in the sub-surface would
require large excavations. Instead, this work considers the turbo-expander replaced
with a simple, smaller, no moving parts and hence more economical solution: the ejector. Instead of extracting mechanical shaft work during the air expansion and
cooling process, an ejector can drive a secondary flow with its high speed primary air
jet. A design for an ejector is put forward, comprising an underground gallery of 4
meters diameter and 32 meters long, with a convergent initial section, containing a
152,4 mm pipe delivering a compressed air jet, sent to a narrow throat and subsequently
to a divergent, pressure recovering section. The design is supported by thermodynamic
calculations. Inlet, secondary air flow is assumed to be at 39
oc
reflecting the temperature of air that must be cooled. The air jet comprises a mass flow of 22.36 kg/s at -71.32 °C. A 1 kPa static pressure rise is maintained from the inlet to the outlet (atthe diffuser exit) where the mass flow ofthe air is 243.82 kg/s (includingthe secondary
air flow) at 29.02 °C. As the air comprising the jet is drier than the secondary air flow,
through the mixing process, the humidity of the air is reduced too. In short, the system behaves like a booster fan that cools and dehumidifies.
NOMENCLATURE CHAPTERl SFEE
vt
Vz g Zt Zz Wtz fVdP Ftzhz
hl
qtzcP
T !J.Z !J.T VTR WBGT TLV HAC CFDSteady flow energy equation- (J/kg) V elocity inlet, point 1 - (mis)
V elocity outlet, point 2 - (m/s) Gravitational constant- (m/s2 ) Elevation, point 1 -(rn) Elevation, point 2- (rn) Mechanical work- (J/kg) Flow work- (J/kg) Frictionallosses between 1 to 2- (J/kg) Enthalpy point 2- (J/kg) Enthalpy point 1 - ( J/kg)
Heat transfer from 1 to 2- (J/kg) Heat capacity- (kJ/kg K)
Temperature - (K)
Increment of elevation- (rn) Increment of Temperature - (K) Virgin Rock Temperature- (aC) Wet Bulb Globe Temperature - (aC) Threshold Limit Values - (aC) Hydraulic Air Compressor Computational Fluid Dynamics
CHAPTER2 COP RBRC SFEE
v1
Vz g Zt Zz Wtz fVdP Ftzhz
Coefficient of performance - (%) Reverse Brayton refrigeration cycle Ste ad y flow energy equation - ( J/kg) V elocity inlet, point 1 - (mis)V elocity outlet, point 2 - (m/s) Gravitational constant- (m/s2) Elevation, point 1 - (rn) Elevation, point 2- (rn) Mechanical work - (J) Flow work - (J/kg) Frictionallosses between 1 to 2 - (J/kg) Enthalpy point 2 - ( J/kg)
h1 Enthalpy point 1- ( J/kg)
q12 Heat transfer from 1 to 2- (J/kg)
T/isen compressor Isentropic efficiency of the compressor
W125 Isentropic compression work - ( J)
h25 Isentropic enthalpy point 2- (J/kg) T/isen turbine lsentropic efficiency of the turbine
h3 Enthalpy point 3- (J/kg) h4 Enthalpy point 4 - ( J/kg)
h45 Isentropic enthalpy point 4 - ( J/kg)
P Pressure ofthe gas- (Pa)
v Volume ofthe gas- (m3/kg) y Isentropic coefficient
C Constant
R Gas constant - (J/mol K)
T Absolute temperature of the gas- (K) T2 Temperature point 2- (K)
T1 Temperature point 1- (K) P2 Pressure point 2- (Pa) P1 Pressure point 1 -(Pa)
rp
T4
T3 p4 p3 Tl cyclew34
W12 qz3 Qin Wcycle HAC MTIU NHEAz
PR
PcrTR
Ter fl]T(::)h
Compressor compression ratio Temperature point 4- (K) Temperature point 3 - (K) Pressure point 4 - (Pa) Pressure point 3- (Pa)
Isentropic efficiency ofthe cycle - (%) Expansion or turbine work - ( J)
Compression or compressor work- (J) Gross he at input - ( J/kg)
Rate ofheat transfer- (J/s) Net work input - (J/s) Hydraulic Air Compressor Modular thermal transfer unit N atural he at exchange area
Compressibility factor- ( dimensionless) Reduced pressure - ( dimensionless) Critical pressure -(Pa)
Reduced temperature - ( dimensionless) Critical temperature- (K)
Joule-Thomson coefficient- (K/Pa)
CHAPTER3 RTT D Dt B B p
v
Ure! dAcs
cv
n.;
Reynolds Transport Theorem Time rate of change
Extensive property (proportional to mass) Amount of B per unit mass
Density- (kg/m3 ) Volume - (m3)
Volumetrie flowrate through the surface - (m3 /s)
Control surface Control volume Normal vector inlet
1ïî
Normal vector outletPt Density inlet- (kg/m3)
V1 Flow velocity inlet - (m/s) A1 Cross sectional area inlet - (m2)
ni1 Mass flow rate inlet- (kg/s)
Pz Density outlet - (kg/m3)
V2 Flow velocity outlet- (m/s)
A2 Cross sectional area outlet - (m2)
ni2 Mass flow rate outlet - (kg/s)
Uxyz V elocity of a little portion of the fluid in the system relative to an inertial
reference framework XYZ
L
Fon sys tem Total forces acting on the system - (N) F body on cv Body force - (N)F surface on cv Surface force - (N)
M1 Linear momentum inlet- (kgm/s)
M2 Linear momentum outlet - (kgm/s) Fp1 Pressure force s inlet- (N/m2)
Fp2 Pressure forces outlet- (N/m2 )
W Weight - (N)
FPw Pressure force s on the wall- (N/m2 )
FFwl Friction forces on the exterior wall - (N) Eof system Total energy ofthe system - (J) Qînto system Heat added to the system- (1) Won system W ork done on the system - ( J) e Total energy (specifie) - (1/kg)
u Internai energy (specifie) - (1/kg)
gz Potential energy (specifie)- (J/kg) Won cv Total work- (J)
Wpressure ,on cv W ork pressure - ( J) Wshaft,on cv Shaft work- (J)
Wother,on cv Other work- (J)
TJp Isentropic efficiency of the primary flow
TJs Isentropic efficiency of the secondary flow
c/Jp
Losses of the primary flowc/Jm
Losses of the secondary flow CPM Constant-pressure mixing CAM Constant-area mixingTJ Isentropic efficiency - (%) hînlet Inlet enthalpy- (J/kg) houtlet Outlet enthalpy- (J/kg)
houtlet,îsentropîc Outlet enthalpy of the isentropic process- (J/kg) YJm Efficiency of the motive nozzle
YJs Efficiency of the suction chamber YJmix Efficiency of the mixing area YJd Efficiency of the diffuser
TJe Efficiency of the eductor
TJc Efficiency of the compressor
TJr Efficiency of the turbine
rh5 Mass flow rate of the secondary fluid or evaporator- (kg/s) rhm Mass flow rate ofthe motive fluid or generator - (kg/s) h' s,îsentropîc lsentropic suction nozzle enthalpy- (J/kg) h5 Suction nozzle enthalpy - (J/kg)
hm Motive nozzle enthalpy- (J/kg)
h' m,îsentropîc Isentropic motive nozzle enthalpy - (J/kg)
YJTER Efficiency of the Turbine-Compressor entrainment ratio ER Entrainment ratio in a real ejector
TER Turbine-Compressor entrainment ratio NXP Motive nozzle exit position
Dm Diameter ofthe mixing section- (rn) Dt Diameter of the nozzle throat - (rn) Lm Length of the mixing section - (rn) VBA Visual basic for applications
Up-în Internai energy primary inlet - (J/kg) rhp-în Mass flow rate primary inlet- (kg/s)
~
Vp-în 2 Kinetic energy primary inlet - (J/kg)Pp-in Flow work primary inlet- (J/kg) Pp-in
Up-out Internai energy primary outlet- (J/kg) rhp-out Mass flow rate primary outlet- (kg/s)
1 2
2
Vp-out Kinetic energy primary outlet- (J/kg) Pp-out Flow work primary outlet- (J/kg)Pp-out Us-in rh s-in 1 2 -Vs-in 2 9Zs Ps-in Ps-in
Internai energy secondary inlet- (J/kg) Mass flow rate secondary inlet- (kg/s)
Kinetic energy secondary inlet- (J/kg) Potential energy secondary- (J/kg)
Flow work secondary inlet- (J/kg) Us-out Internai energy secondary outlet- (J/kg) rhs-out Mass flow rate secondary outlet- (kg/s)
1 2
2
Vs-out Kinetic energy secondary outlet- (J/kg) Ps-out Flow work secondary outlet- (J/kg)Ps-out
Pp-in Density primary inlet- (kg/m3)
Vp-în Velocity flow primary inlet - (m/s) A p-în Cross sectional area primary inlet- (m2)
Ps-în Density secondary inlet- (kg/m3)
Vs-in Velocity flow secondary inlet- (m/s) As-in Cross sectional area secondary inlet - (m2)
Pp-out Density primary outlet- (kg/m3)
V p-out Velocity flow primary outlet - (m/s) Ap-out Cross sectional area primary outlet- (m2)
Ps-out Density secondary outlet - (kg/m3)
Vs-out Velocity flow secondary outlet- (m/s) As-out Cross sectional area secondary outlet - (m2)
g Gravitational constant- (m/s2)
Pp-in Pressure primary inlet- (Pa)
A pr îmary Cross sectional area primary - (m2)
Pp-out Pressure primary outlet - (Pa) Frînl etwall Friction force inlet-wall Frp Friction force primary- (N) Ps-în Pressure secondary inlet- (Pa) Ps-out Pressure secondary outlet - (Pa) Frs Friction force secondary - (N)
q Rate of he at transfer - (J/s)
A Area available for heat transfer - (m2 )
!J. Tm V aria ti on in mean temperatures - (K)
CHAPTER4
v1
v
elocity inlet, point 1 - (mis) Vz V elocity outlet, point 2 - (m/s)g Gravitational constant- (m/s2) Z1 Elevation, point 1 -(rn) Zz Elevation, point 2- (rn) W1z Mechanical work- (J)
J
V dP Flow work- (J/kg) F12 Frictionallosses between 1 to 2- (J/kg) hz Enthalpy point 2 - ( J/kg) h1 Enthalpy point 1 - ( J/kg)q1z Heat transfer from 1 to 2- (J/kg) Pc Critical pressure- (Pa)
P1 Nozzle inlet pressure- (Pa)
y Isentropic coefficient - ( dimensionless) Tc Critical temperature - (K)
T1 Nozzle inlet temperature- (K)
rt Temperature ratio exit
Tz Nozzle outlet temperature - (K)
Pz Nozzle outlet pressure- (Pa)
Cn Coefficient of dis charge - ( dimensionless) IÎlactual Actual mass flow rate - (kg/s)
IÎlisentropic Isentropic mass flow rate - (kg/s)
Vy Velocity in position Y- (m/s)
h1 Enthalpy position 1 - (J/kg)
hy Enthalpy position Y - (J/kg)
v1
v
elocity position 1 -(mi s)Vc Critical velocity at the throat - (m/s) he Critical enthalpy at the throat- (J/kg) A c Critical velocity at the throat - (m/s) rhîsentropîc lsentropic mass flow rate - (kg/s)
Vc Critical specifie volume - (m3/ kg)
De Critical diameter - (rn) TJnozzle Efficiency of the nozzle
Cp Heat capacity- (kJ/kgK) Tz Temperature point 2 - (K) T1 Temperature point 1- (K)
Pz Pressure point 2- (Pa) P1 Pressure point 1 -(Pa)
p Density- (kg/m3)
Ae Exit area ofthe nozzle- (m2)
At Throat area of the nozzle- (m2)
Pb Back pressure- (Pa) Pc Chamber pressure -(Pa)
CHAPTER6 Pc Pt y Tt Tz Pz 'lnozzle
hl
hz hz s Pdrop Q ScfmCritical pressure- (Pa) Nozzle inlet pressure- (Pa)
Isentropic coefficient - ( dimensionless) Nozzle inlet temperature- (K)
N ozzle outlet temperature - (K) Nozzle outlet pressure- (Pa) Efficiency of the nozzle Enthalpy inlet - ( J/kg) Enthalpy outlet - ( J/kg)
Isentropic enthalpy outlet - ( J/kg) Fan drop pressure - (Pa)
Volumetrie flow rate - (m3 /s)
GENERAL INTRODUCTION
1.1 Introduction
Mine ventilation is a critical element in underground mining. The air temperature
changes from summer to winter or even in the same day. The perfect case scenario
would be the mine planning responsible thinks first about this situation before defining
production but in a mine there are another priorities. In order to supply fresh air to the place needed it is essential to plan ventilation taking into account design, safety, control
and system optimization.
Sorne ventilation systems have been poorly design for 10 years reserves, despite
the fact that a good design system keep workforce safety as well as contribute to the
efficiency of the mine operation, due to the fact of quick payback. A ventilation
deficient system is more expensive in the longterm. For instance, raise bores and shafts
are often designed constrained by production parameters instead of ventilation
constraints. As the mine goes deeper and ages, the work load capacity and air velocity
are reduced; the shock losses, heat load increase energy consumption and cost rise.
HV AC costs for Kidd Mine are estimated to be 70 % of operating cost (Howes and Hortin, 2005).
Sorne ventilation systems initially supply enough air to the underground mine.
During mine expansion production increases but the ventilation system may not be
improved and the ventilation system becomes deficient requiring expensive retrofit options to be achieved. Once in production, capital to invest in mine ventilation tends
to be sc arce since the mine' s main goal is production. The increasing of fan pressure
and quantity of air during the mine expansion affects ventilation costs. Fan electricity
costs rise with the increase of total pressure of the fan. As the lengths of airways extend
there is more resistance in the system therefore more fan pressure is needed. Fan electricity costs increase in proportion to the system resistance. In addition, leakage
from ducting and through broken ground, as well as shock losses increases the total
quantity of pressure required.
Due to the fact that the surface deposits are running out, the only solution is going
deeper. Going deeper means getting hotter, because of the geothermal gradient, eventually they need to have active cooling, for instance, an ejector. The ejector was
well known at the beginning of the twenty century as part of the steam jet-pump refrigeration system. Unfortunately due to the ejector low coefficient of performance
was replaced mostly by vapour compression refrigeration systems using mechanical
compressors, (Ablwaifa, 2006). However, these refrigeration systems representa major
addition to mine infrastructure which substantially elevate mining costs. As part of an
industry wide drive to lower mining costs, there is always need for new thinking and
the exploration of new concepts for mine cooling. In this work, a modem ejector system
will be reconsidered as part of an unconventional refrigeration system, based on the
reverse Brayton cycle that utilizes a Hydraulic Air Compressor (HAC). HACs are another example of a historically well-established technology which subsequently fell
out, ofuse, but which also features as part ofthe mine refrigeration concept explored
in this thesis because it has great potential to de li ver compressed air much more cheaply
to mines. Consequently, this too will be explained in detail in the thesis. Further advantages of the ejector refrigeration system concept of this work are that i) air is the
refrigerant gas as well as the coolant gas, ii) heat exchange is direct, iii) an ejector is a
small, no moving parts, no maintenance technology and iv) for the same rated cooling
the ejector concept will be compact, requiring less underground space to be developed in comparison to the current incumbent vapor compression refrigeration systems.
1.2 Sources ofheat in the sub-surface
In order to design a cooling system for underground mines, it is first necessary to develop sorne understanding of why the air becomes heated and its temperature bec ornes elevated. Important sources of heat are outlined in the following subsections.
1.2.1 Effect of auto-compression and geothermal gradient on ventilation air temperatures
In an underground mine the air descends through a so-called downcast shaft, increasing the temperature of dry air, as the potential energy is converted into pressure energy and adiabatic conditions are generally assumed to hold. Depending on the age of the shaft, and diurnal and seasonal t emperature variations, adiabatic conditions may not apply so that heat transfer from the rock to the air can occur driven by the air temperature, the rock temperature, the air humidity and the wetness of the shaft. The rock temperature at a given depth depends upon the geothermal gradient.
The steady flow energy equation is frequently used to govem the downcast shaft process in (J/kg):
2
Zz
Figure 1: Downcast sbaft
With constant cross-section of the shaft, and no input fan work, the top subscript 1 and the bottom subscript 2, of a downcast shaft (Figure 1), (1) becomes:
(J/kg of mass flow)
The enthalpy can be written as a function of temperature substituting 8h= CP8T
Assuming the air is an ideal gas. Th en:
(2)
(3)
(5)
If the assumed adiabatic conditions prevail and air with CP = 1005 kj jkgK then
(6) leads to an approximately 1 K /100 rn increase in air temperature with a fall in elevation.
f!T
o
+
1z
f!zLc
=cp
(6)
If the rock temperature around the shaft is lower than the air temperature then q12 is negative (the air is cooled by the rock) and the air temperature lapse rate becomes < 1 K 1 100 m. Water evaporating into air in cre ases the enthalpy of the air, leading to the same trend. When the rock has a higher temperature than the air, heat enters the air from the rock and the air temperature lapse rate > 1 K 1 100 m. What happens to the air temperature in the shaft th us depends on the temperature of the rock.
The geothermal gradient can vary between 3 K 1 100 rn to 4 K 1 100 rn in mining regions with relatively 'hot rocks' such as Cornwall, UK; to 1 K 1 100 rn in sorne mining districts of Canada and South Africa. (Millar et al., 2014)
The actual 'virgin rock temperature ' (VTR) at any depth in a parti cul ar mining locale not only depends on the geothermal gradient, but also on the temperature of the rock at surface, which is climate determined. For South Africa, although its geothermal gradient is one of the lowest, the average surface temperature is relatively high and the gold mines now exploit ore at great depth, so the VR Ts at these horizons are high. The VRT depends on the thermal conductivity and heat capacity ofthe rock, and the state of geothermal he at flux.
For a mine with a geothe1mal gradient of 1 K 1 100 rn, if the surface air temperature is lower than the surface VR T, as the air descends, the air will be continuo us! y warrned by the surrounding rock (Figure 2).
0 5 0 500 1000 1500 _._ Air ... 52000 VRT0
>
T0 ROCK HEATS _.,_ VRT .cg.
2500 AIR 0 30006rl
6TI
6Z geo> 6Z AC 3500 4000 4500Figure 2: Cornwall winter daytime where surface air temperature is lower than the surface VRT
In Figure 3, the surface air temperature is lower than the surface VRT but the increase of air temperature due to the autocornpression is lùgher than the geotherrnal flux, due to decrease in surface temperature dming nighttirne.
0 500 1000 1500 :[2000 .c
g.
2500 0 3000 3500 4000 4500 Temperature (0 C) 0 5 10 15 20 25 30 35 40 45 50 VRT0 > To /':.T l /':.T l t:.z AC> t:.Z geo ROCKHEATS AIR AIR HEATS ROCKFigure 3: Canada winter nighttime where both effects occur.
If the surface air temperature is higher than the surface VRT, the ventilation air will be continuously cooled by the surrounding rock (Figure 4).
0 500 1000 1500 g2000 .s::
g.
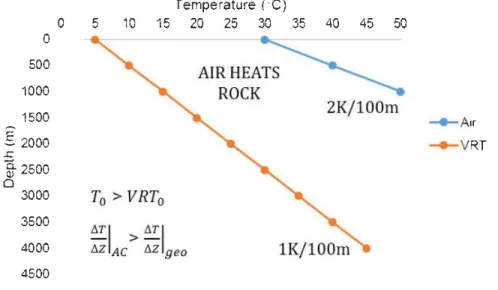
2500 0 3000 3500 4000 4500 Temperature (°C) 0 5 10 15 20 25 30 35 40 45 50 T0 > VRT0t:.rl llrl
llZ AC> llZ geo AIR HEATS ROCK 2K/ 100mFigure 4: Canada summer daytime where surface air tempe1·ature is higher than the surface VRT
0 500 1000 1500 :[2000 .c
g.
2500 0 3000 3500 Temperature (0 C) 0 5 10 15 20 25 30 35 40 45 50 ROCKHEATS AIR T0 > VRT0 lK/lOOm /':.T l /':.Tl 4000 - > -t:.z geo t:.Z AC 4500Figure 5: Cornwall summer nighttimewhere both effect occur.
In Figure 5, the surface air temperature is higher than the surface VRT but the increase of air temperature due to the autocompression is lower than the geothermal flux, due to decrease in surface temperature during nighttime. To understand the situation for particular shafts, computer simulations of ventilation air flows need to be carried out. The presence of water on tunnel surfaces can add heat to the air through latent heat mass transfers.
1.2.2 Latent heating/cooling and sensible heating/cooling
Whatever the condition of the air is at the air entry to mine workings, it is further modified by heat and mass transfers within the workings. The condition of air within and at the exit of the workings depends on those and also depends on conditions of dryness or wetness of the rock surfaces in the workings.
The wetness fraction over an entire surface of a tunnel can be back -calculated from measurements of the air flow properties at each end of the turmel and the temperature distribution along the turmel surface. The latter depends on the evaporation rate, which is driven by the psychometrie properties of the bulk air and the bulk air velocity.
On Figure 6, it is possible to see how the magnitude oflatent heat transfers depend on the wetness fi·action and with depth.
18000 . , -16000
-1---i
..:;e. 14000-1---~---
~
12000-1--1---~---
~
10000-1--1---~---
Q. oiJ ~ 8000 -1--1---.r:1:
6000 QI.5
4000 2000 0 29.3 38 46.8 55.5 64.3 Virgin Rock Temperature (CO)• 0.00 -Dry
• 0.25-Moderately dry
• 0.50-Wet
Figure 6: Impact of wetness fraction in latent heating power for varying working level depths (VRTs).
Figure 7, shows the magnitude of sensible heat trans fers which depends on the wetness fi·action and with depth. Total heating (positive+), cooling (negative -) is the sum of sensible and latent components.
i
..:.:: 5000 l 1--
..
Cl) ~ 0 ~----~--~~--~--~~--Q....
Ill Cl) .t: Cl) -5000:c
·;;; c: Cl) VI -10000Virgin Rock Temperature (C0 )
• 0.00 -Dry
• 0.25-Moderately dry
• 0.50- Wet
Figure 7: Impact of wetness fraction in sensible heating power for varying working level deptbs (VRTs).
For existing airways, the estimation of the wetness fraction is done by visual inspection or thermographie mapping. For planned, unconstmcted, airways the estimation is done from previous experience with similar depths and geological settings. Humidity of the air is a dominant factor in assessing whether active cooling systems are acquired because workers are principally cooled tlu·ough evaporative heat transfer of sweat (McPherson, 1993). Greater moisture content in the air reduces the effectiveness of the air to cool workers.
1.2.3 Broken rock underground
Another factor to consider for the mine ventilation is the broken rock underground.
Schafrick (2014) using computational fluid dynamics and experimentation, reported a
value of 0.238 kg/m3 for the Atkinson friction factor applicable to bulked broken rock.
From his determination, the heat loads from surfaces into the mine ventilation system
can be identified. In order to do this, it is necessary to know four parameters, the
average rate of broken rock produced (kg/s ), the specifie he at capacity of the broken
rock (k.J/ kg°C), the temperature at which the rock exits the underground workings and the virgin rock temperature (VRT) of the surrounding rock. If the broken rock is wetted to reduce the dust, the rate of heating of the air by the broken rock is appreciably
increased.
1.2.4 Other sources ofheat in mine workings
It is important to highlight four other sources of heat. First, it is the auxiliary electrical equipment ( e.g. ventilation syst em fans). A typical auxiliary fan may be rated
at 112 kW (O'Connor, 2008), and at the end of the transit of air through an auxiliary
ventilation system, all of this electrical power ends up as heat. Second, it is the static
and mobile equipment: pumps, 50 kW (Oosthuizen, 2012); bolters, 24 kW (O'Connor,
2008); drill jumbos, 7 kW (O'Connor, 2008); lighting, 369kW for 7000 bulbs (Millar
et al., 2014); and diesel, the amount ofwhich varies according to the mine production
(Grenier et al., 2000). Third, water sources, such as sprays, springs, drainage channels,
water pools and wet material. Finally, during stope filling the cement heat ofhydration
250 kJ/kg (Langan et al., 2002), and the oxidation of sulphide ore minerais, Pentlandite
(Ùzdeniz and Kelebek, 2013) may increase the total heat load, that frequently can be forgotten.
1.2.5 Thresholds on underground air temperatures
The air temperature underground affects the work performance . The wet bulb
globe temperature, WBGT, is use to define the limiting temperatures at which the worker can work continuously according to his/her task or rate of work. For indoors where the solar radiation is negligible,
WBGT = 0.7 Tw
+
0.3 Td (7)Where T w is the wet bulb temperature and Td is the dry bulb temperature. In underground mines the dry bulb temperature can be used as the globe thermometer temperature as there is negligible solar radiation
Ontario recommends mining companies to use the WBGT, recommended by the American Conference of Govemmental and Industrial Hygienists (ACGIH) and required by legislation in other jurisdiction (ACGIH, 2013). Mining companies used this guidance to express the acceptable threshold limit values (TLV) for WBGT. The action limit is applied for tho se workers that are not used to hot conditions.
Table 1: ACGIH threshold limit values for WBGT
ACGIH Screening Criteria for Heat Stress Exposure (WBGT values in °C)
~
Allocation of Work in a Work 1 Rest TLV (Action Limit)Cycle Light Mode rate He avy Very Heavy
75-100% 31 (28) 28 (25) na na
50-75% 31 (28.5) 29 (26) 27.5 (24) na
25-50% 32 (29.5) 30 (27) 29 (25.5) 28 (24.5)
0-25% 32.5 (30) 31.5(29) 30.5 (28) 30 (27)
1.2.6 Need for cooling
Sources of heating in underground mines have been presented in this section. The
total heating power for Canadian mines can be in between 10 to 24 MW. This range
represents the increases in heat load as depth increases. It has been shown that active cooling through refrigeration is required when the surface VRT is high and also when
the depth increases. Conventional refrigeration systems cannot be used in sorne
situations, even if they are desired, and this may be due to high cost, insufficient heat
reject capacity, insufficient water or insufficient power. In such cases alternative cooling methods must be used, and there are many successfully deployed examples
such as ice-stopes (Howes and Hortin, 2005), modular thermal transfer unit (MTTU)
(Allen et al., 2012), lake cooling (Newman and Herbert, 2009) or seasonal thermal
1.3 Aimojthis worl:
The sources ofheatadditions in the sub-swface are oflarge magnitude (MW-scale)
and involve both latent and sensible heat transfers. The threshold environmental
conditions thal are applicable are clear and embedded in mining regulations. Solutions
for MW-scale active cooling are thus required as mines exploit deel"'r ore bodies and
these need to be provided at low cos!, so thal mine viability
isnot compromised.
Candidete solutions will have
lowcapital costs, will be simple in construction,
will
have high reliabilityso that maint.nance and re
pm
labourcosls are
low,and will have
a long setvice li fe.
--.;;::;:-J~: Li__~"_' ~~~_?_
. .,_
...
_._·...,.··'-·-'·_,~-T'--- - ' - - - - . . 1 .. ____ -f.j:
l ;;;, ' ,·;,-;. ~\);>'l'/
.\-
- ·-·-,~· +~.--~... - -
']
l-·-·- ·~ t>rlmG!? s:: ~ · · 2 : 1 ) ' ' 1 " Il~ ---,-~_,~ .. - ' - ) ..:.-L..._.);,;J·~ 1 t.hr(IM . .. -::::: .,;-.--r ... > • .... • .. _,, 1 -.---"" "! m1 "'
11
::c::c•:ll ~•.;. nu ·• (r.~!rnlned fi:. ,.,) ( Q:;, , t !ln(_- 1;'1 '!, \ lt ,. :nUJOUj;•
FÎg\Œe 8: Scherrta:Œ diag;r-aJ"l\of ~torperforn'W"'Ce(Huang et 31, 1999)
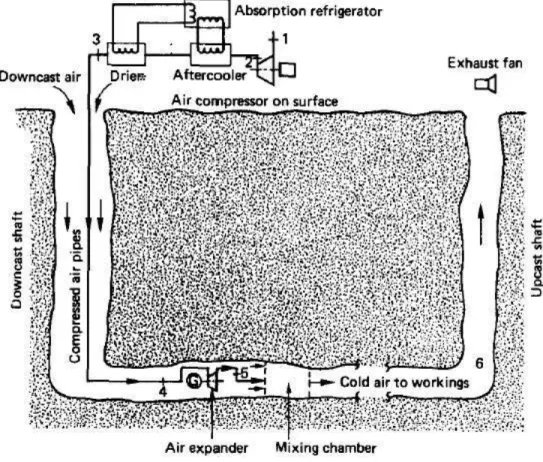
Figure 8 shows a schematic of an ejector, comprising an internai convergent
divergent no:zzle inside alarger convergent divergent nozzle. This will be reviewed in
detail
subsequent!:,~however at this stage it
isimp>rtant to note that i) the expanded
gas leaving the int.rnal convergent divergent nozzle can be engineered to be much
cooler than the supplied primaryflow and ü) the system in the diagram has no moving
parts,
and üi) the secondatyflow
isdrawn into the ejector by the high speed primaty
flow.
The cold primatyflowmixes with the inductedsecondaryflow,., that the former
cools the latter and a refrigerating effect
isthus applied to the latter.
The compact general arrangement and no-moving-parts character of this cooling
system certainly makes it interesting to consider for mine-scale refrigeration. In this
context, the primary flow may be considered to be a stream of cheaply produced
compressed air and the secondary flow may be considered to be the bulk mine ventilation air requiring cooling.
The primary flow will thus cool the mine ventilation air and add to the latter's mass
flow for further benefit, but the key questions are:
1) Although ejectors are well established technologies at relatively small sc ale, can the working princip le be scaled up to mine sc ales (of say, 4 to 5 meter diameter for
the secondary air flow)?
2) Can this be clone at a lower cost than the incumbent vapour compression
refrigeration technology?
The answers to these questions principally lie in understanding the theory of air
ejector performance and confirming this experimentally to enhance confidence in the
proposai as a credible concept. Next a reliable, large scale and cheap source of
compressed air is required to drive the ejector. In this thesis, the focus is on the optimal design of the ejector; designs for HACs to deliver on this objective are the concems of
others (Millar et al., 2016) and for the purposes ofthis work, this air is simply assumed
to be available. Thereafter, conceptual designs for mine scale ejector refrigeration
systems can be articulated so that the capital and operating costs associated with the concept can be reliably estimated. Economie performance metrics can then be
established and compared with the incumbent to assess whether or not it is worthwhile
At the outset of investigations, the working hypothesis of the thesis was that it
was possible to establish a MW-scaled rated ejector mine refrigeration concept. The
thesis effort was directed towards design effort, modelling and experimental work
that tried to prove this hypothesis.
1.4 Research methodology
The following methodology is used to respond the research questions. In order
to appropriately respond the research questions, in each subheadings is identified with
the work clone in that chapter.
• Chapter 2 will report the literature review undertaken, focusing on
refrigeration systems, to explain the functions ofthe hydraulic air
compressor and the ejector in the proposed refrigeration cycle.
• Chapter 3 firstly reviews the literature on ejectors specifically with the objective of identifying how they be optimally designed for specifie,
defined, duties.
• Chapter 4 discusses the method that may be used to design the motive
nozzle of an ejector for its primary flow.
• Chapter 5 will report an outline description of the Computational Fluid
Dynamics (CFD) model and explains its connection with chapter 3. Then a literature review on previous CFD ejector studies is presented. Next, the
two simulations designed: one for mine scale and other for laboratory test
will be presented. Finally, the analysis of results to understand the
• Chapter 6 highlights the laboratory test in order to verify the CFD model. In this chapter, the fabrication ofthe model is explained with the test
conditions and instrumentation used for this purpose. Then the results of
the physically experiments are presented.
• Chapter 7 explains the different results and findings. This chapter presents
discussions relating to the ejector design, CFD results, experiment
findings and implications for cooling sub-surface.
• Chapter 8 summarizes the achievements of this work and off er different
approaches for further studies. In this chapter conclusions are presented relating to the research questions posed in chapter 1 and the additional findings. These conclusions are referenced to the current development
status of the ejector and a summary of recommended further work is
REVIEW OF THE THEORY AND CONTEXT OF REVERSE BRA YTON REFRIGERATION CYCLE
This chapter presents an overview of previous works related to the technology
under study and discusses the techniques used to accomplish the proposed analysis.
The conditions in an underground mine depend mainly upon the air properties, rock properties, airway properties, virgin rock temperature and humidity of the rock.
According to De Souza, (2015), the mine ventilation system accounts for 25-40% of
the operation costs and for 40-50% of energy consumption. Thus choosing the right
system for removing he at from deep mines is vital, especially for mines where the value
of the mineral product is low or declining.
2.1 Vapor compression refrigeration systems
As mines get deeper, and the various heat loads on the ventilation air increase,
so there is a need to consider heat removal systems. One of the first methods of
refrigerating underground mines was by sending blocks of ice to the sub-surface. This was the method of choice until the industrial revolution where the mechanical vapour
compresswn refrigeration cycle was adopted at the beginning of 20th century
(McPherson, 1993 ). The first plant for mine underground refrigeration went into operation in 1920, producing 80000 cfm, 37.75 m3/s of dry air, at the Morro Velho
mine, Nova Lima, Minas Gerais, Brazil (Davies, 1922). Unfortunately this kind of system had a low coefficient of performance (COP) around 60%.
Refrigeration effect
COP = =
-Net work input (8)
The vapor compression system is the most conventional refrigeration system in at the present time. The vapor compression system consists of four elements: evaporator, compressor, condenser and expansion valve. Refrigeration effect is delivered at the evaporator because it behaves as a heat exchanger causing a wet vapour to become saturated vapour by vaporizing the liquid component in drawing heat from the evaporator surroundings. The refrigerant is then pressurized at the compressor which also increases the refrigerant temperature. The elevated vapour temperature (in comparison to the condensor's surroundings) causes heat to leave the refrigerant and it condenses to a liquid state. Finally, the pressure is reduced in an expansion valve through throttling and the refrigerant flashes to a wet vapour at the evaporator pressure, allowing the cycle to restart. The best approach to calculate the COP is to assume an ideal process and allow for pro cess irreversibilities with an isentropic efficiency for the compressor and frictional pressure drops for the pipework losses. These irreversibilities decrease the COP and refrigeration capacity
During the 1970s, surface refrigeration plants were extensively installed in deep South African mines. These modem units have relatively high COPs of around 4, due to relatively low atmospheric air reject temperatures. However, according to Sheer et al. , (1986) when careful analysis of the coefficient of performance (COP) of the refrigerator systems was undertaken, effective COPs were found to reduce by 25% to 3, as the mining depth increased from 3000m to 4000m depth. Refrigeration costs were increased unacceptably.
For these surface plants, the issue became that while the refrigeration effect available at the plant remained high, the effective refrigeration effect available where
it was required at depth was much lower. However the refrigeration effect was
delivered at depth, the inevitable fact was that on its way to the subsurface, whatever
medium was involved, heated up. Consequently, a concept of 'positional efficiency'
was developed, and vapor compression systems began to be installed underground.
Underground vapor compression refrigeration systems still need to reject
condenser heat. On surface cooling towers can be readily constructed to achieve this.
W arm condenser cooling water is sprinkled downward against an updraft of atmospheric air, then cooled water is retumed to the condenser. Underground, cooling
towers need to be constructed in voids excavated in rock, appreciably increasing their cost. Also, the temperatures ofupdrafting air underground are appreciably higher than
the temperatures of updrafting air on surface, mainly due to autocompression and geothermal heat transfer. To provide the same cooling effect to the condensers, more
updrafting air needs to be supplied to the cooling tower than an identically rated system
on surface. Underground the condenser temperature has to be maintained higher to
maintain the same temperature difference between refrigerant in the condenser and the
condenser coolant. Operating a condenser a higher temperature means that the
compressor in the cycle needs to work harder because the condenser pressure is
correspondingly higher, dictated by the refrigerant properties .
Supplying more updrafting air quickly becomes sub-economic because the mr
power varies with cube of the volume flow rate, so the normal course of action is to
run the condenser at a higher pressure. As a direct consequence the COP falls. In
general, a vapor compressor refrigeration plant that will operate with a COP of 4 on surface, will operate with a COP of 3 underground. So a trade-off exists of energies
between a surface compression refrigeration plants with a high COP but low positional
efficiency, and an underground vapor compression plant that has high positional
efficiency but lower COP . Consequently, an ongoing drive for innovation in mine refrigeration still exists, because vapor compression refrigeration options begin to
become very expensive as depth increases. Without such innovation, mine refrigeration systems can only be afforded by mines producing the most valuable commodities (such as gold and gems)
Compressor
0
Net work in--t
Heat leaving the system (to atmosphere)1~ 1
Condenser Evaporator1~ 1
t
Heat ent e ring i n the syst em (refrigeration effect)Figure 9: Vapor compressor refrigeration cycle
2.2 Brayton Power and Refrigeration Cycles
[><] Expansion valve
Power and refrigeration systems are governed by the thermodynamic cycles. The former are systems that produce power output, the latter are used for refrigeration and require power. These thermodynamic cycles are also divided into vapor or gas cycles depending on whether or not there is a change in phase of the working fluid. They can also be classified as open or closed cycles, where open means the working
fluid is continuously renewed instead of the same fluid being recirculated. V apor compression systems are limited by the evaporator temperatures. Sometimes there is such a great need for 'coldness' that much lower temperatures than the se are needed. In such cases, the refrigerant adopted may have to change to one that does not change phase. When this occurs, the refrigeration cycle changes too, from a vapor compression system to a reverse Brayton cycle.
l
Heat entering in the system (fuel) Com bustio n cham berl
Heat leaving t he systeml
Heatentering in the system (fuel) H e at exchanger He at exchangerl
Heat leaving thesystem
(to atmosphere)
Figure 11: Equipment for a closed Brayton cycle power plant
A Brayton cycle for refrigeration is best explained by first considering a
Brayton cycle for power production.
In the Brayton power cycle, work input to the compressor increases the pressure
of the circulating gas which is considered the 'system ' . Then, at a relatively high
temperature, heat is added to the gas in the form of combustion heat, raising system
enthalpy. The high enthalpy gas is passed to the turbine in which the gas expands,
depressurizes and cools. The high enthalpy of the inlet gas is converted to turbine shaft
work and low enthalpy outlet gas. Low pressure, lower temperature gas leaves the
turbine and then undergoes an isobaric cooling process either i) indirectly, in a heat
exchanger, so that heat leaves the system and passes to the surroundings in the closed
cycle (Figure 11) or ii) directly, by mixing and intermingling with the surrounding
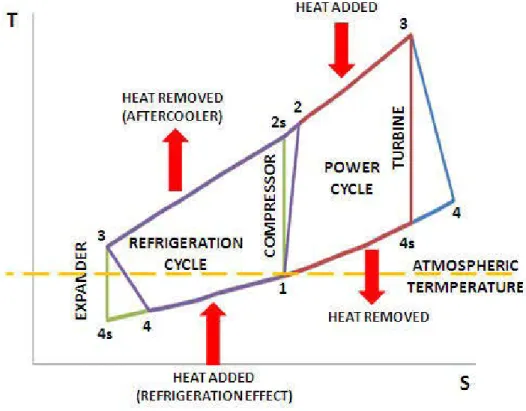
In the reverse Brayton refrigeration cycle (RBRC), after compression, heat
leaves the system, passing to the surrounding atmosphere in a heat exchanger that
behaves as an aftercooler. The aftercooler process is approximately isobaric at highest
temperature in the cycle. The gas then passes to a turbine, depressurizes, delivers work and cools to the lowest temperature in the cycle, and thereafter enters a second heat
exchanger where it undergoes an isobaric heating process, drawing in heat and
providing the refrigeration effect.
The physical configuration of RBRC and Brayton power cycle plant
components is identical, and the sense of the flow through these identical components
is identical too. The essential difference between the power and refrigeration cycles is
the sense of the heat transfers at the heat exchangers, and the temperatures at which these two transfers occur. For the power cycle, the net work leaving the system is
positive (Figure 11 ), for the refri geration cycle the net work entering the system is
Figw·e 12: Equipment for a closed Brayton cycle refrigeration plant
An initial anal ysis of the cycle can be done by assuming th at al! the processes are ideal and reversible. In reality, this is not the case, and irreversibility needs to be accounted for. Irreversibilities in the Brayton cycle can be depicted on a thetmodynamic cycle as blue process !ines superimposed on the red process !ines representing the ideal gas cycle, as in Figure 13.
T
2s 1 POWER CYCL'E 3s
Figure 13: Ideal and non-ideal Brayton power cycle
The reversible or ideal cycle comprises four processes:
• 1-2s Isentropic compression in the compressor
• 2s-3 Constant-pressure (isobaric) heat added (fuel heat added in a combustion)
• 3-4s Isentropic expansion in the turbine • 4s-1 Isobaric heat removal
The irreversible or real cycle:
• 1-2 Actual compression in the compressor, deviating from the ideal compression by an amount controlled by the compressor isentropic efficiency.
• 3-4 Actual expansion in the turbine • 4-1 Constant-pressure heat removal
Due to frictionallosses and other irreversibilities inside the compressor and the turbine, there is a system entropy increase 1-2 and 3-4. There are also frictionallosses inside the heat exchangers that will reduce pressure for processes 2-3 and 4-1 normally assumed isobaric. In comparison to pressure changes in ofthe compressor and turbine they are negligible, and support an assumption of constant-pressure in these processes. The main difference between ideal and actual cycles is that there is greater actual work input to the compressor and less actual work output in the turbine, substantially reducing cycle efficiency. In order to account for the deviation from the ideal process isentropic efficiencies are introduced, defined by the application of the steady flow energy equation (SFEE) for the real and ideal process, compressor and turbine processes.
For the compression process:
w12s 1Jisen comp = - W =
12
(9)
(10)
With approximately similar velocities, V little variation in elevation Z and no heat
transfer q12=0:
lJisen comp =
where hi= specifie enthalpy (kJ/kg) of cycle state point i.
Similarly, for the expansion process:
lJisenturbine
=
(12)For the reversible adiabatic isentropic processes of compression in the compressor and expansion in the turbine:
PvY = C (13)
where y is the isentropic coefficient of an ideal gas defined with a constant ratio of specifie heat. The ideal gas equation of state
Pv = RT (14)
is also assumed to hold. For the ideal gas, the pressures and temperatures for the
two processes with the same isentropic coefficient are, thus:
For the compressor:
y-1
Tz (Pz)Y
y-l- = - =r Y
T1 P1 P
(15)
where rp is the compressor compression ratio, and
For the turbine:
(16)