HAL Id: hal-00295866
https://hal.archives-ouvertes.fr/hal-00295866
Submitted on 20 Mar 2006
HAL is a multi-disciplinary open access
archive for the deposit and dissemination of
sci-entific research documents, whether they are
pub-lished or not. The documents may come from
teaching and research institutions in France or
abroad, or from public or private research centers.
L’archive ouverte pluridisciplinaire HAL, est
destinée au dépôt et à la diffusion de documents
scientifiques de niveau recherche, publiés ou non,
émanant des établissements d’enseignement et de
recherche français ou étrangers, des laboratoires
publics ou privés.
Modelling molecular iodine emissions in a coastal marine
environment: the link to new particle formation
A. Saiz-Lopez, J. M. C. Plane, G. Mcfiggans, P. I. Williams, S. M. Ball, M.
Bitter, R. L. Jones, C. Hongwei, T. Hoffmann
To cite this version:
A. Saiz-Lopez, J. M. C. Plane, G. Mcfiggans, P. I. Williams, S. M. Ball, et al.. Modelling molecular
iodine emissions in a coastal marine environment: the link to new particle formation. Atmospheric
Chemistry and Physics, European Geosciences Union, 2006, 6 (4), pp.883-895. �hal-00295866�
www.atmos-chem-phys.net/6/883/2006/ © Author(s) 2006. This work is licensed under a Creative Commons License.
Chemistry
and Physics
Modelling molecular iodine emissions in a coastal marine
environment: the link to new particle formation
A. Saiz-Lopez1, J. M. C. Plane1, G. McFiggans2, P. I. Williams2, S. M. Ball3, M. Bitter3, R. L. Jones3, C. Hongwei4, and T. Hoffmann4
1School of Environmental Sciences, University of East Anglia, Norwich, UK
2School of Earth, Atmospheric & Environmental Sciences, University of Manchester, Manchester, UK 3University Chemical Laboratory, Cambridge University, Cambridge, UK
4Institute of Inorganic Chemistry and Analytical Chemistry, Johannes Gutenberg-University, Mainz, Germany
Received: 27 May 2005 – Published in Atmos. Chem. Phys. Discuss.: 28 July 2005 Revised: 12 January 2006 – Accepted: 26 January 2006 – Published: 20 March 2006
Abstract. A model of iodine chemistry in the marine boundary layer (MBL) has been used to investigate the impact of daytime coastal emissions of molecular iodine (I2). The model contains a full treatment of gas-phase io-dine chemistry, combined with a description of the nucle-ation and growth, by condensnucle-ation and coagulnucle-ation, of io-dine oxide nano-particles. In-situ measurements of coastal emissions of I2 made by the broadband cavity ring-down spectroscopy (BBCRDS) and inductively coupled plasma-mass spectrometry (ICP/MS) techniques are presented and compared to long path differential optical absorption spec-troscopy (DOAS) observations of I2at Mace Head, Ireland. Simultaneous measurements of enhanced I2 emissions and particle bursts show that I2is almost certainly the main pre-cursor of new particles at this coastal location. The ratio of IO to I2predicted by the model indicates that the iodine species observed by the DOAS are concentrated over a short distance (about 8% of the 4.2 km light path) consistent with the intertidal zone, bringing them into good agreement with the I2measurements made by the two in-situ techniques. The model is then used to investigate the effect of iodine emis-sion on ozone depletion, and the production of new particles and their evolution to form stable cloud condensation nuclei (CCN).
1 Introduction
The relevance of iodine in the chemistry of the lower tro-posphere has been the subject of numerous studies over the past two decades (Chameides and Davis, 1980; Jenkin et al.,
Correspondence to: J. M. C. Plane
1985; Davis et al., 1996; Vogt et al., 1999; McFiggans et al., 2000; Carpenter, 2003). These investigations have concen-trated on the potential of iodine to affect the oxidising ca-pacity of the MBL in a number of ways: catalytic destruc-tion of O3 by cycles involving the iodine species IO, HOI and OIO; altering the partitioning of NOx (NO2/NO) and HOx(HO2/OH) (Bloss et al., 2005); activating chlorine (Mc-Figgans et al., 2002) and particularly bromine from sea-salt aerosol; and the reaction between IO and dimethyl sulphide (DMS) (Gravestock et al., 2005). The role of iodine in O3 and Hg depletion episodes in the Arctic polar spring is also a current research topic (Calvert and Lindberg, 2004a,b). In-terest in iodine chemistry has been greatly stimulated in the last few years by the measurement of IO and OIO, at signif-icant concentrations, in a number of geographical locations (Alicke et al., 1999; Allan et al., 2000, 2001; Saiz-Lopez and Plane, 2004).
Iodine is often enriched in marine aerosols by 2 to 3 or-ders of magnitude, compared with its relative abundance in sea salt (Duce et al., 1963). A recent study of the iodine spe-ciation in aerosol samples from the south and north tropical Atlantic Ocean have shown that iodine, mostly in the form of iodate (IO−3), was enriched whereas bromine and chlorine were depleted. The enrichment factor of iodine in the fine aerosol mode was found to be an order of magnitude greater than that in the coarse mode (Baker, 2004).
The role of the higher iodine oxides (IxOy) in the for-mation of new particles in coastal marine environments has also been widely discussed (Hoffmann et al., 2001; O’Dowd et al., 2002a; Jimenez et al., 2003; McFiggans et al., 2004). Although it is thought that most of newly-formed nanoparti-cles will be accommodated onto pre-existing marine aerosol, a fraction may be able to grow to detectable sizes (diameter
884 A. Saiz-Lopez et al.: Modelling molecular iodine emissions in a coastal marine environment
D>3 nm) by the further uptake of condensable gaseous
species and coagulation (Makela et al., 2002). The duration of such events can range from tens of minutes up to 8 h. Parti-cle bursts have been found at different coastal locations such as Western Europe (O’Dowd et al., 2002b, and references therein), Tasmania (Bigg and Turvey, 1978) and Antarctica (O’Dowd et al., 1997).
More recently, the detection of I2 at parts per trillion (ppt) levels by DOAS (Saiz-Lopez and Plane, 2004), and the experimental determination of its short photolytic lifetime (about 10 s) have demonstrated that the molecule is a ma-jor source of reactive iodine in the atmosphere (Saiz-Lopez et al., 2004). Note that the sensitivity of the instrument and, therefore, the time resolution of the instrument does not al-low measurements at the timescales at which photochemistry of the molecule occurs. Hence it might be reasonable to think of peak values larger than those reported here, because they are not captured at the time resolution of the DOAS. Emis-sions of I2occur from coastal areas rich in macroalgae (and possibly also from open ocean sources Garland and Curtis, 1981). A mechanism for the release of I2from Laminaria macroalgal species has recently been suggested (McFiggans et al., 2004). Iodide (I−) from sea-water is oxidised within the cell walls of the plant by hydrogen peroxide to form hypoiodous acid (HOI) (Kupper et al., 1998). HOI and I− then equilibrate with I2in aqueous solution (Truesdale et al., 1994). For I2to be liberated into the gas phase, the plant must be exposed to the atmosphere (at low tide) or covered by only a thin layer of water. I2is then likely to be the main contrib-utor to the formation of condensable iodine oxide vapours, leading to the nucleation and growth to detectable sizes of the ultrafine particles observed at low tide. For example, a recent study concluded that the observed I2 emissions at low tide provided a source of atomic iodine about 103times stronger than that of CH2I2, which was previously thought to be the main precursor of reactive iodine in the coastal MBL (McFiggans et al., 2004).
During daytime, I2 released into the marine boundary layer will be photolysed to I atoms, which react rapidly with O3to form IO. The self reaction of IO forms OIO and I2O2 (Cox et al., 1999); the former may photodissociate to I+O2 (Ashworth et al., 2002), although this point is discussed fur-ther below. Both IO and OIO are presumably removed from the gas phase by uptake onto pre-existing aerosol surfaces, or initiate new particle formation by forming the higher oxides I2Oy, where y=2–5 (McFiggans et al., 2000; Hoff-mann et al., 2001; O’Dowd et al., 2002a,b,c; Jimenez et al., 2003; Burkholder et al., 2004). In fact, although labora-tory (Jimenez et al., 2003; Burkholder et al., 2004; McFig-gans et al., 2004) and theoretical (Begovic et al., 2004) work on new particle formation has been carried out, the detailed mechanism leading to the formation of iodine oxide nano-particles in coastal environments remains an unsolved ques-tion. This is an important problem to solve because, if I2 emissions occur on a larger scale than just along
Laminaria-rich coasts, then I2could play a significant role in producing CCN, and therefore impact on global radiative forcing and climate.
In this paper we use a coupled photochemical-aerosol growth model to investigate the role of I2emissions in new particle formation. The model will first be used to show that the ratio of I2 to IO observed by DOAS (Saiz-Lopez and Plane, 2004), during the NAMBLEX campaign at Mace Head, Ireland during July and August 2002, can only be explained if the iodine species are not distributed homoge-neously along the 4.2 km path length of the instrument. The conclusion that the I2 emission is almost exclusively in the intertidal zone will then be validated against in-situ obser-vations of I2carried out by two quite different techniques – Broad Band Cavity Ringdown Spectroscopy (BBCRDS), and Inductively-Coupled Plasma/Mass Spectrometry (ICP/MS).
2 Model description
The model used here contains the gas-phase iodine chem-istry in our previous iodine model (McFiggans et al., 2000; Plane and Nien, 1991), with pertinent updates in kinetic and photochemical data, coupled to an aerosol coagulation-condensation algorithm (Jacobson, 1999) which is used to determine the growth of newly-formed iodine oxide parti-cles. The particles are distributed between 50 size bins (D=0.6–460 nm), where the volume of each successive bin increases by a factor of 1.5. We assume that the iodine condensing gases are non-volatile and every I2Ox (x=2, 3 and 4) formed is treated as a thermodynamically stable unit of the smallest size. Then, the semi-implicit subroutine calculates the coagulation kernel for each possible colli-sion pair, starting with the Brownian coagulation rate for the transition regime taken from Jacobson (1999, page 446, Eq. 16.28), after (Fuchs, 1964). This follows assuming that the convective Brownian diffusion enhancement (page 446, Eq. 16.30), turbulent inertia (page 447, Eq. 16.35), turbu-lent shear (page 447, Eq. 16.36) and gravitational collection (page 447, Eq. 16.32) do not contribute significantly at the size range in question (roughly 1 nm to 2–3 microns). The model also allows condensation of IO and OIO onto newly formed iodine particles. Condensation of H2O, H2SO4and organic vapours is not considered in this modelling study.
We assume that the smallest particles in the first size bin can be either I2O2, I2O3 or I2O4, produced from the combination reactions IO+IO, IO+OIO and OIO+OIO, re-spectively. The particle nucleation treatment in this model is based on the assumption that once the gas-phase iodine oxides species (I2O2, I2O3and I2O4) are formed they com-pletely undergo the formation of small particles. Evapora-tion is not expected to occur, and so is not treated in the model. This assumption is based on laboratory studies of iodine oxide particle growth kinetics (Saunders and Plane, 2005), which show that the growth of these particles through
coagulation and condensation proceeds at the collision fre-quency, in accord with the model scheme employed for this study. The material density of the small particles used here is 4 g cm−3taken from (Daehlie and Kjekshus, 1964). The rate coefficient for IO+IO is now well established to be 1×10⁻¹⁰cm3molecule−1s−1 (Sander et al., 2003). At at-mospheric pressure, this reaction appears to have two chan-nels: I2O2(62±8%), and OIO+I (38±8%) (Cox et al., 1999; Bloss et al., 2001), in good accord with recent work in our laboratory where a branching ratio for OIO production of 32±10% was measured (D. M. Joseph, personal communi-cation, 2004). Here we assume I2O2is formed with a 65% probability. A combination of quantum calculations on I2O3 and I2O4 and RRKM theory shows that the rate constants for IO + OIO and OIO + OIO should be about 2×10⁻¹⁰ and 5×10⁻¹¹cm3molecule−1s−1, respectively, at 1 atmo-sphere pressure and 290 K. This rate of formation of I2O3 is in very good agreement with a recent experimental deter-mination (J. Gomez-Martin, University of Bremen, personal communication, 2005).
One significant uncertainty in the gas-phase chemistry of iodine is the rate of OIO photolysis. The radical has a substantial absorption cross section between about 480 and 650 nm (Himmelmann et al., 1996), with bands that are ro-tationally unresolved and do not fluoresce (Ashworth et al., 2002; Bloss et al., 2001). However, it is not yet clear whether absorption leads to photodissociation to I+O2, or intercon-version to the ground state followed by quenching. The IO+O(3P) channel is not relevant here because the OIO
ab-sorption cross-section is comparatively small at wavelengths shorter than the ∼410 nm threshold (Misra and Marshall, 1998). Recent work in our laboratory indicates that the pho-tolysis quantum yield for absorption at 562 nm is probably much lower than 10%, although this may change at shorter wavelengths.
For the purpose of the present study, we have therefore de-termined an upper limit to the photolysis rate of OIO, and also assess the case where OIO does not photolyse in the lower troposphere JOIO=0. The upper limit is computed as-suming that the photolysis quantum yield is 100% across all the absorption bands between 480 and 650 nm. The pho-todissociation rate constant, JOIO, is then computed to be 0.48 s−1for clear sky conditions during local noon at 53◦N in July, assuming an atmospheric attenuation of 20% of the extraterrestrial flux (Houghton, 2002). In the model runs de-scribed below, this upper limit of JOI Owas reduced by 50%
to a daytime average value of 0.24s−1, which also takes ac-count of the frequently cloudy conditions at Mace Head. We note that Burkholder and coworkers concluded that an upper limit of JOIO<0.005 s−1was necessary to allow significant particle production to occur in the MBL (Burkholder et al., 2004). However, that study assumed that particles were only produced by the dimerisation of OIO. Note that, as has been pointed out in Sect. 4.2, the particle formation is sensitive to the rate of photodissociation of OIO, especially at shorter
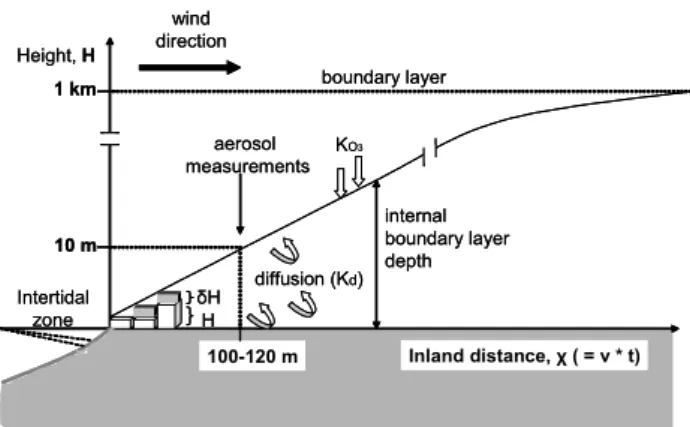
Height, H Inland distance, χ ( = v * t) 10 m 100-120 m wind direction H δH aerosol measurements Intertidal zone internal boundary layer depth diffusion (Kd) KO3 boundary layer 1 km Height, H Inland distance, χ ( = v * t) 10 m 100-120 m wind direction H δH aerosol measurements Intertidal zone internal boundary layer depth diffusion (Kd) KO3 boundary layer 1 km
Fig. 1. Schematic of an evolving plume containing the gas molecules and particles offshore from the emissions point at the intertidal zone.
timescales. However, in this study this assumption is less sensitive since I2O2 is also considered a condensable unit and therefore the particle nucleation does not rely entirely on the participation of OIO.
The model is integrated using a variable stepsize fourth-order Runge-Kutta routine (Press et al., 1986). After each second the aerosol coagulation-condensation algorithm is used to update the growth of particles in response to the gas-phase iodine chemistry. The uptake rate of IO, OIO, I2O2, I2O3, I2O4and larger iodine oxide particles onto background marine aerosol (whose size distribution was measured dur-ing the NAMBLEX campaign), is calculated usdur-ing uptake coefficients γ of 1 for all species. For γ =1, this yields an uptake rate of around 3×10⁻³s−1for IO and OIO. During the simulations described here, all iodine-containing species, except alkyl iodides, and O3are allowed to vary. The mix-ing ratios of other species affectmix-ing the iodine chemistry are held constant at typical daytime values typical for Mace Head under maritime air mass conditions: NO2=150 ppt, NO=30 ppt, OH=0.05 ppt and HO2=3 ppt and DMS=100 ppt, CH2I2=0.1 ppt, CH3I=3 ppt, CH2BrI=0.15 ppt.
In order to assess the potential for I2, released in the inter-tidal zone, to form iodine-containing aerosols which evolve into CCN over a period of about an hour, we use a box model with dilution parameterised as rate of entrainment from the background air. This is shown schematically in Fig. 1, for the case of an on-shore wind. I2is mixed into an air parcel with an internal boundary layer depth of a few metres, as it crosses the intertidal zone. The I2 source is then switched off once the air leaves the intertidal zone, and both iodine-containing gases and particles are allowed to dilute into an evolving internal boundary layer of height H. A first-order dilution coefficient, Kd(s−1), is therefore introduced into the
continuity equation for the iodine species, [X]:
d[X]
886 A. Saiz-Lopez et al.: Modelling molecular iodine emissions in a coastal marine environment MRI Carna
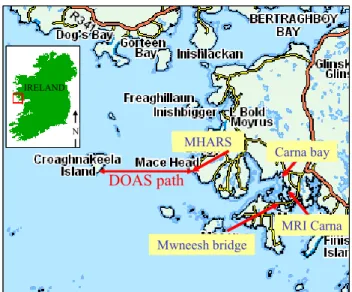
DOAS path
MHARS Carna bay Mwneesh bridge N IRELAND MRI CarnaDOAS path
MHARS Carna bay Mwneesh bridge N N IRELANDFig. 2. Location of the DOAS light path at Mace Head and the
different denuder sampling sites on the west coast of Ireland.
where Pi and Li correspond to the chemical production and
loss terms of X, respectively. The horizontal distance x cov-ered by the air parcel is given by the product of the horizontal wind speed ν and the time t since leaving the intertidal zone. We assume that H increases linearly with x, with a constant slope α of about 0.1. This is based on micro-meteorological data during NAMBLEX (Norton et al., 2005), which showed that the mean internal boundary layer depth was approxi-mately 10 m about 100 m from the intertidal zone. The di-lution coefficient, Kd, is then given by αν/H .
Since the iodine chemistry causes significant depletion of O3in the air parcel, replenishment of O3from aloft is ac-counted for by adding an entrainment term to the continuity equation for O3:
d[O3]
dt =PO3 −LO3+KO3([O3]o−[O3]t) (2) where [O3]ois the background mixing ratio aloft, and KO3is an entrainment coefficient which is also equal to αν/H .
3 Field observations
3.1 Differential Optical Absorption Spectroscopy (DOAS)
The DOAS instrument employed to make long-path mea-surements of I2and IO has been described in detail previ-ously (Saiz-Lopez and Plane, 2004). The transmitter was lo-cated at the Mace Head Atmospheric Research Station. The light beam was directed to Croaghnakeela Island, 4.2 km to the west, and folded back to Mace Head by a retro-reflector, therefore providing a total light path of 8.4 km. As shown in Fig. 2, the light path ran mostly over the ocean, at a height of 4 to 10 m. I2and IO were detected from their optical differen-tial absorption spectra in the 535–575 nm and 430–460 nm,
respectively, with a time resolution of 30 min. The details of the de-convolution procedure have been given previously (Plane and Saiz-Lopez, 2006).
3.2 Broadband Cavity Ring-Down Spectroscopy (BBCRDS)
BBCRDS was used to make point measurements of OIO and I2mixing ratios on the shoreline, approximately 10 me-tres inland from the observatory housing the DOAS. The BBCRDS spectrometer has previously been used in labo-ratory studies of H2O, NO3 and O2(Ball et al., 2001; Ball and Jones, 2003), and its adaptation for in-situ field measure-ments is discussed in a companion publication (Bitter et al., 2005a). Briefly, a Nd:YAG pumped dye laser was operated with rhodamine 6G dye to provide broadband radiation over a spectral range of 4 nm FWHM centred at 568 nm. This light was coupled into a ringdown cavity composed of two high reflectivity mirrors (R=99.992% at 570 nm; Los Gatos Research) which were purged with dry filtered nitrogen to prevent contamination of their optical surfaces. The total length of the cavity was 220 cm of which a central 180 cm section was open to the atmosphere. Light leaking from the cavity was detected in a time- and wavelength-resolved fash-ion by a 2-dimensfash-ional charge coupled device. Thus, a set of wavelength-resolved ringdown times was obtained from each BBCRDS observation, and atmospheric absorption spectra were calculated from observations performed with the cavity open to the atmosphere and whilst flushed with dry nitrogen. The mixing ratios of the molecular absorbers were re-trieved by fitting the absorption cross sections of OIO (Ash-worth et al., 2002), I2 (Saiz-Lopez et al., 2004) and the 5 vibrational overtones of water vapour (Coheur et al., 2002) to the differential structure in the atmospheric sample’s ab-sorption spectrum. Aerosol extinction was assumed to be a linear function of wavelength over the range of the present measurements. The instrument’s sensitivity depends on the size of the molecular absorbers’ differential cross sections and on the bandwidth and intensity of the laser output. Typ-ical detection limits were 4 pptv and 20 pptv for OIO and I2, respectively, for a total observation time of 20 min including acquisition of the nitrogen flush spectra.
3.3 Denuder sampling and Inductively Coupled Plasma-Mass Spectrometry (ICP/MS)
Based on the specific reaction between starch and I2 (Holle-man and Wiberg, 2001), a denuder sampling technique was developed to collect gaseous I2 from ambient air. Starch (2 mg mL−1 in ethanolic solution) was coated to the inner surfaces of brown glass tubes (inside diameter φi=6 mm,
out-side diameter φo=9 mm, length=50 cm). To produce a
uni-form starch coating of the inner denuder walls, four 0.5 mL samples of the coating solution were slowly instilled onto the rotating denuder. During the coating procedure the denuder
tubes were dried by flushing N2at a flow rate of 0.5 L min−1. Finally, the denuders were sealed with polypropylene (PP) end-caps.
At the measuring site, a volumetric ambient air flow of 500 mL min−1was sucked through the denuder tubes. The sampling time varied between 30 and 60 min. Once the sam-pling was complete, the open endings of the tubes were again sealed with PP-caps. In the laboratory, the iodine-amylose complex was extracted from the denuder walls with 4 mL of a TMAH-solution (TetraMethylAmmonium Hydroxide, 5% by weight) at 90◦C for 3 h. Finally, the solution was diluted to 1% TMAH, 200 ppb Tellurium were added as an internal standard and the iodine mixing ratio was finally determined by ICP-MS (PQ2 Turbo Plus, VG elemental, UK).
3.4 Aerosol instrumentation
The instrumentation for sub-micron aerosol measurement was located in a shipping container at the foot of the tower next to the research station. Air was drawn down a 150 mm bore, 22 m high, dual inlet sampling stack at a flow rate of 150 L min−1. Sampling alternated every hour between the top of the stack and an inlet at 7 m height. The flow rate was such that diffusional losses for sub-micron particles were minimised. Air was sub-sampled isokinetically from the main stack through a 40 mm bore stainless steel line, bent through a 1 m radius of curvature before running the full length of the container. A differential mobility particle sizer (DMPS) system comprising two Vienna type differential mo-bility analysers (DMAs) (Winklmayr et al., 1991), one TSI model 3025 condensation particle counter (CPC) and one TSI model 3010 CPC, using mass flow control with sheath to aerosol flow ratio of 10:1 was used to measure aerosol num-ber distributions from 3 to 700 nm diameter. Particle distribu-tions from 0.3 micron to 47 micron diameter were measured at the top of the 10 m tower using two commercial optical in-struments. A Grimm (model 1.109) optical particle counter retrieved distributions from 0.3 to 6.5 micron diameter using backscatter, and a modified Particle Measurement Systems Forward Scattering Spectrometer Probe (FSSP-100) with a rotating base to maintain alignment with the prevailing wind was used to retrieve distributions from 0.5 to 47 microns in 16 channels.
3.5 Sampling sites
The DOAS, BBCRDS and aerosol instruments were posi-tioned at Mace Head (53◦200N, 9◦540W), whereas two other
sampling sites were used to fill the starch denuders for later ICP/MS analysis: the Martin Ryan Marine Science Insti-tute in Carna, Galway, (MRI-Carna), and Mweenish Bridge. These are located about 8 km southeast of the Mace Head research station (Fig. 2), and contain populations of kelp species that are very similar to those at Mace Head (Fu-cus vesiculosus and Laminaria digitata) (Yoon et al., 2004).
There is a higher density of the marine biota at Mweenish Bridge. All the denuder samples were taken during low tide in the intertidal zone, when the seaweeds were exposed to ambient air. A plant enclosure chamber filled with live kelps was also used for some of the measurements.
4 Results and Discussion
4.1 Spatial distribution of I2emission
One objective of this study is to combine the long-path and in-situ measurements of I2, together with the photochemical model, to determine the spatial distribution of I2emission. The photochemical box model was therefore run to investi-gate two scenarios. First, I2is emitted uniformly along the optical path of the DOAS instrument. Second, I2emissions are limited to the intertidal zones at each end of the light path (i.e., the island and Mace Head foreshore – Fig. 2). The model results are then compared to the long-path averaged and in-situ observations of I2. Note that we begin here with the simple closed box model described in Sect. 2. The effects of dilution by mixing through the boundary layer vertically will be considered later.
Figures 3a and b show model runs for 120 min around low tide (δt=0). The broken and solid lines denote model runs for JOIO=0.24 and 0 s−1, respectively. The rate of I2 emis-sion in the model follows a Gaussian distribution, peaking at low tide, with a standard width of 22 min. In the box model runs we prescribe I2mixing ratios so that the Gaussian dis-tribution peak corresponds to measured mixing ratios either by DOAS or by in-situ techniques depending upon whether we test spatially distributed or hot-spot case scenarios. In the entraining box approach the model is initialized with a mix-ing ratio based on in situ observations made durmix-ing the same campaign by BBCRDS. In the model run in Fig. 3a, the I2 emission rate is scaled to generate the daytime peak I2 mix-ing ratio observed by the DOAS, which averaged 6.5 ppt as-suming that all the iodine species were uniformly distributed along the 4.2 km of the DOAS optical path. The correspond-ing values for IO and OIO are also plotted (I has been re-moved from Fig. 3a for clarity). Note that the IO mixing ratio reaches 13.5 and 11.7 ppt for JOIO=0.24 and 0 s−1, respec-tively (this is because the photolysis of OIO to yield I, fol-lowed by oxidation by atmospheric O3, increases the IO mix-ing ratio). Hence, at low tide, the model predicts a [IO]/[I2] ratio of ∼2, whereas the DOAS observes an average IO mix-ing ratio of 3 ppt, and hence an [IO]/[I2] ratio of ∼0.5. The model predicts a rate of O3depletion resulting from iodine-mediated photochemistry of about 1 ppb h−1, which is not very sensitive to JOIO. The initial conditions in the model are the same in Fig. 3b as in Fig. 6. Both show a similar trend of IO with respect to I2: the IO mixing ratio decays less rapidly than I2because the rate of the IO self reaction (being its main sink) varies as [IO]2.
888 A. Saiz-Lopez et al.: Modelling molecular iodine emissions in a coastal marine environment -60 -40 -20 0 20 40 60 0 20 40 60 80 100 M ix ing rati o / ppt 0 5 10 15 20 25 30 DOAS pathlength \ km 0.6 1.2 1.8 2.4 3.0 3.6 4.2 0 20 40 60 80 100 O3 (ppb) IO I2 OIO I (a) (b) (c) δt
Fig. 3. Modelled iodine species and ozone depletion potential
aver-aged over the 4.2 km of the DOAS path (a) and (b) in a box 320 m long. Each species mixing ratio is plotted during the 2 h simulation around low tide (Note that I is removed from panel (a) for clar-ity and δt =0 is equivalent to noon and minimum tidal height). Panel
(c) shows the distribution of the different modelled compounds over
the length of the DOAS optical path. The model was initialised with an O3mixing ratio of 25 ppb and the graph illustrates its depletion
along the path. In the three figures the broken and solid lines indi-cate the model run for JOIO=0.24 and 0 s−1respectively.
The OIO mixing ratio peaks at ∼0.46 and 1.5 ppt for
JOIO=0.24 and 0 s−1, respectively. Note that even in the absence of photolysis the OIO mixing ratio does not reach a significant level, because of the fast recombination reac-tion with IO (k=1.5×10⁻¹⁰cm3molecule−1s−1, J. Gomez-Martin, University of Bremen, personal communication, 2005). This is in accord with field measurements of OIO by DOAS, which during daytime are consistently below the
DOAS detection limit of 4 ppt (Allan et al., 2001; Saiz-Lopez and Plane, 2004). Note that this detection limit has been increased by a factor of 4, following a change in the OIO absorption cross-section at 548.6 nm from 6.8×10⁻¹⁷cm−2 (see (Allan et al., 2001) for details), to 1.6±0.2×10⁻¹⁷cm−2 (personal communication, P. Spietz, University of Bremen and D. M. Joseph, University of East Anglia). Hence, even if JOIO=0 s−1, OIO would be below the daytime minimum detectable amount of the DOAS instrument.
In order to produce an [IO]/[I2] ratio closer to that ob-served, the model was then initialised assuming that the I2 is only emitted along 8% of the DOAS light path, in a box of 320 m length (equivalent to two sections of 160 m at each end of the DOAS path, corresponding approximately to the intertidal zones). We estimated that a horizontal distance of 160 m for the intertidal zone is covered with seaweeds un-der low tidal periods, particularly during spring tides. The I2 emission rate is now increased in the smaller box, in order to generate the column density of I2observed by the DOAS. Figure 3b shows that now the maximum mixing ratio of I2 in each end section peaks at 92 ppt, and the [IO] at 47 ppt, so that the [IO]/[I2] ratio is ∼0.5, in agreement with the ra-tio observed by DOAS. Note that although [OIO] can now reach up to 5 ppt in the intertidal sections, this corresponds to 0.4 ppt averaged over the DOAS path, and hence would still be below the detection limit. The rate of O3 depletion resulting from iodine-mediated photochemistry is now pre-dicted to be very substantial (∼10 ppb h−1). However, this is very much an upper limit, because the closed box model does not allow for dilution (cf. below).
Figure 3c shows the predicted peak mixing ratios of the different iodine species as the path length over which the I2 emission occurs varies from 320 m to 4.2 km (the I2emission rate is scaled so that the peak integrated column of I2 cor-responds to that observed by the DOAS). The remaining O3 mixing ratio at the end of each model run is also shown. Note that although all the iodine species have higher mixing ratios if they are concentrated in a box of shorter length, the ratios of I, IO and OIO to I2 decrease with increasing I2. There are two reasons for this. First, the recombination reactions IO + IO, IO+OIO and OIO+OIO are second-order in iodine oxide mixing ratio, so that their rates vary as [IOx]2. Second, because the resulting rate of iodine oxide particle formation is also a non-linear function of I2, uptake of IO and OIO on these new particles is faster at higher I2.
During NAMBLEX, daytime in-situ measurements of I2 were carried out by the BBCRDS instrument for a period of four days (Bitter et al., 2005b1). During these non-consecutive measurement days the I2mixing ratio was found
1Bitter, M., Ball, S. M., Povey, I. M., Jones, R. L., Saiz-Lopez,
A., and Plane, J. M. C.: Measurements of NO3, N2O5, OIO, I2,
wa-ter vapour and aerosol optical depth by broadband cavity ringdown spectroscopy during the NAMBLEX campaign, Atmos. Chem. Phys. Discuss., in preparation, 2005b.
32 31 110 115 475 677 774 0 100 200 300 400 500 600 700 800 900 I2 (g ) co n c e n tr a ti o n / p p tV
Samples at MRI Carna (low tide) 30/09, 2003 14:30~15:00 01/10, 2003 15:00~15:30 30/09, 2003 16:30~17:30 Chamber Laminarie Chamber Fucus Samples at Bridge (low tide)
Samples from seaweed chambers
Fig. 4. I2mixing ratios observed by a denuder system, for several
different locations around the Mace Head area and during seaweed-chamber experiments in September 2003.
to increase as sea level fell (see lower panels in Fig. 9), in agreement with the DOAS observations (Saiz-Lopez and Plane, 2004). A mixing ratio peak of 94 ppt was reached on 16 August (DOY 228) in the late afternoon/early evening when the solar radiation intensity has already decreased and photodissociation of I2is reduced. In addition to low tide periods, it has also been proposed that solar irradiance to-gether with warmer temperatures enhances biological activ-ity and therefore biogenic emissions at marine coastal loca-tions (Carpenter et al., 1999). Hence, I2 emissions are ex-pected to be more accentuated when low water periods coin-cide with maximum solar radiation exposure.
Figure 4 shows the denuder tube measurement results at several locations (Fig. 2). At Mweenish Bridge, I2 mixing ratios up to 115 ppt were measured in the mid-afternoon dur-ing low tide periods, about 3 times higher than those at the MRI-Carna site where the density of seaweeds is lower. In addition, the experimental set up at Mweenish Bridge was such that there was a shorter vertical distance between the seaweed and the denuder sampler inlets. This is consistent with a vertical I2 mixing ratio gradient caused by its rapid photolysis during daytime. Also shown in Fig. 4 are the results of the chamber experiments, performed in Septem-ber 2003, whereas the NAMBLEX campaign took place in 2002. The I2mixing ratio was about one order of magnitude higher than ambient, when the chamber was filled with fresh macroalgae.
In summary, the DOAS measurements when interpreted by the box model indicate that the daytime peak mixing ra-tio of I2averaged about 92 ppt at low tide, and that this was concentrated in a box about 320 m long (or two sections of 160 m at each intertidal zone along the light path). This I2 mixing ratio is consistent with the in-situ daytime measure-ments by both the BBCRDS and denuder techniques, which range from 30 to 115 ppt, depending on sampling site.
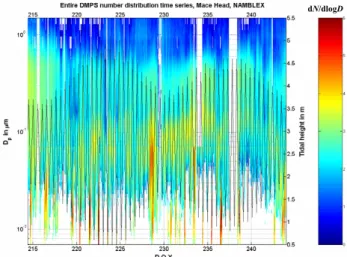
dN/dlogD
Fig. 5. DMPS particle size distribution series together with tidal
height. Note that the unit of the colour-coded bar is an exponential.
4.2 Ultrafine particle formation
New particle formation events were observed on almost ev-ery day during the NAMBLEX campaign. These events only occurred during daytime, and tended to coincide with low tide. The peak particle number density reached more than 6×105cm−3on occasion (the most intense formation was on DOY 222, 10 Aug), though normally the bursts were more modest, reaching around 2 to 3×104cm−3. Figure 5 shows the DMPS size distribution time series during the NAM-BLEX campaign. The duration of the particle formation event was variable, lasting from several tens of minutes to more than 6 hours (the longest continuous formation was ob-served on DOY 216, 4 Aug), as was the size to which the par-ticles had grown by the time they reached the sampling point. For instance, on DOY 222, no new particles had grown to larger than 8 nm before reaching the measurement location. However, on DOY 216, freshly formed particles had grown to a maximum of around 15 nm prior to reaching the mea-surement location, indicating a more distant source region. The trend was generally followed where the more persistent formation was associated with a greater maximum size but lower maximum mixing ratio, compared with the most in-tense formation events. Both features are strongly dependent on the prevailing local wind direction and the source loca-tion.
Regarding the vertical distribution, independently sured (TSI 3025 CPC) particle number mixing ratios mea-sured at 7 m and 22 m exhibited little difference between the two heights. Further investigation of this difference showed that it is dependent on wind direction, thus indicating that the vertical distribution of the particles is dependent on the location of the source region.
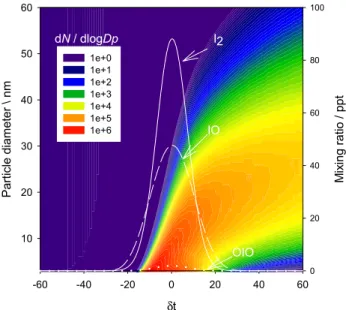
Figure 6 shows a two hour simulation in the box model of the iodine oxide particles that would have been produced
890 A. Saiz-Lopez et al.: Modelling molecular iodine emissions in a coastal marine environment δt -60 -40 -20 0 20 40 60 P ar ticle diam et er \ nm 10 20 30 40 50 60 1e+0 1e+1 1e+2 1e+3 1e+4 1e+5 1e+6 dN / dlogDp M ix ing ratio / ppt 0 20 40 60 80 100 I2 IO OIO
Fig. 6. Modelled contour plot of the new particle production and its
size distribution during a 2 h simulation. 2 h simulation. Note that
δt=0 is equivalent to noon and minimum tidal height). The model runs assuming typical clean air coastal mixing ratios of alkyl iodides and the locally observed I2, and predicted IO and OIO mixing ratio
levels.
from the model run in Fig. 3b – i.e., where the I2emission is concentrated in a box 320 m long. The predicted parti-cle size distribution (D=3–60 nm) is plotted as a function of time around low tide (δt =0 is equivalent to noon and mini-mum tidal height), together with I2, IO and OIO. Note that these model runs include heterogeneous loss of the iodine oxides not only to the newly-formed ultrafine particles, but also to background aerosol. Figure 6 shows the maximum mixing ratio of ultrafine particles is correlated to the peak I2emission, as expected because of the rapid photolysis of I2. Initially, there is not a significant contribution from the bigger sizes (i.e. D>10 nm) to the total number of particles. However, as condensation and coagulation cause the growth and removal of the smallest particles, about 20 min after the first particles appear the most abundant particle size is greater than 10 nm. Of course, this zero-dimensional box model as-sumes no mixing and dilution as the air parcel is transported away from the intertidal zone.
We now consider the effect of dilution by using the box model with entrainment described in Section 2 and shown schematically in Fig. 1. Figure 7 shows the time-resolved mixing ratio of the iodine species and O3 when simulating the transport of the air parcel away from the emission source, for a period of 5 min. Note that given the 100–120 m distance from the emissions source and typical horizontal wind speed, the air parcel would take less than 1 minute to reach the re-search station where the aerosol measurements were made. In this case, the model is initialised with an I2mixing ratio of 90 ppt, consistent with the in situ observations. The broken
Time / seconds 0 50 100 150 200 250 300 Io di ne s pec ie s / ppt 0 20 40 60 80 100 O3 m ix ing r ati o / ppb 24.7 24.8 24.9 25.0 I2 I OIO O3 IO
Fig. 7. Fig.7 Model simulation of iodine species and O3for a box
model with entrainment where the plume is allowed to evolve off-shore from the emissions source. The broken and solid lines indi-cate the model run for JOIO=0.24 and 0 s−1respectively.
Time / seconds
0 10 20 30 40 50 60
ultrafine particle num
ber / c m -3 0 2e+5 4e+5 6e+5 8e+5 1e+6 JOIO = 0.24 s-1 JOIO = 0 s-1
Fig. 8. Ultrafine particle number for a 1 min simulation. The broken
and solid lines denote JOIO=0.24 and 0 s−1respectively.
and solid lines in Fig. 7 correspond to JOIO=0.24 and 0 s−1, respectively. As expected, the IO and I mixing ratios are slightly higher for the upper limit to JOIO, since OIO photol-yses to I+O2, and there is also a greater O3depletion. How-ever, a marked difference with the zero-dimensional model (Fig. 3b) is that O3 depletion is much smaller because of mixing of O3 from aloft. In Fig. 7, at the beginning of the run, the O3loss due to iodine chemistry (I+O3) is 0.12% s−1, but this decreases as the gas-phase iodine disappears; a par-tial recovery is then observed during the 5 min simulation as a result of entrainment. Within an hour the O3mixing ratio would recover to background levels as the iodine species di-lute in an expanding air mass and/or are removed from the gas phase.
JOIOalso affects the rate of formation of new ultrafine par-ticles. In one of the sensitivity studies we consider OIO to photodissociate to I+O2(Ashworth et al., 2002). Therefore,
dN/dlogDp dN/dlogDp
(a)
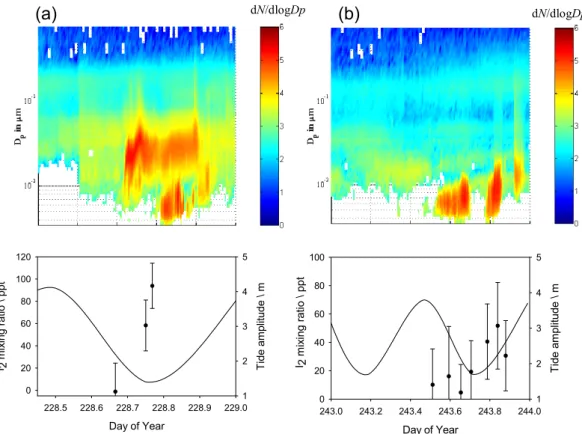
(b)
Day of Year 228.5 228.6 228.7 228.8 228.9 229.0 I 2 m ix ing r atio \ ppt 0 20 40 60 80 100 120 T ide am plitude \ m 1 2 3 4 5 Day of Year 243.0 243.2 243.4 243.6 243.8 244.0 0 20 40 60 80 100 T ide am pl itu de \ m 1 2 3 4 5 I 2 m ix ing ra tio \ pp t Day of Year 228.5 228.6 228.7 228.8 228.9 229.0 I 2 m ix ing r atio \ ppt 0 20 40 60 80 100 120 T ide am plitude \ m 1 2 3 4 5 Day of Year 243.0 243.2 243.4 243.6 243.8 244.0 0 20 40 60 80 100 T ide am pl itu de \ m 1 2 3 4 5 I 2 m ix ing ra tio \ pp tFig. 9. Time series of two days of simultaneous observations of I2by BBCRDS together with tidal height, and dry particle size distributions
at Mace Head at low tide conditions. Note that sunset times are 228.80 and 228.83 for data in panel (a) and (b) respectively.
at high JOIOthe formation of the IO dimer will be the dom-inant particle production channel and as we assume I2O2as a condensable unit the rate of particle production at short timescales is larger for high JOIO. Figure 8 shows a 1 minute simulation of the generation of ultrafine particles. For in-stance, after 40 s of simulation the number of ultrafine par-ticles generated with JOIO=0.24 s−1 is about 30% higher than for a case of JOIO=0 s−1. However, after a few min-utes of simulation the total number of new particles is only 4.5% smaller for JOIO=0 s−1. This model run demonstrates that the new particle formation rate is strongly non-linear. The number density of new particles formed at short times (<1 min) is also sensitive to the branching ratio of the IO self-reaction, but again this sensitivity diminishes at longer times, as all the iodine oxides formed from the emitted I2 end up as particulate iodine.
It has been proposed recently that I2 should be the main precursor of reactive iodine and ultrafine particles in the MBL at a location such as Mace Head (Saiz-Lopez and Plane, 2004; McFiggans et al., 2004; McFiggans, 2005). During NAMBLEX, in-situ simultaneous observations of I2 by the BBCRDS technique together with a particle burst were carried out (for the first time). Figures 9a and b show the time correlation between the daytime release of I2 at low water and the local production of new particles at Mace
Head. Both episodes take place during late afternoon/early evening when I2 would be photolysed, initiating the chain of reactions leading to the formation of condensable higher iodine oxides and the production of detectable particles. It should be noted that in Fig. 9b, for instance, the gaps with no particles at low tide were correlated to periods of vari-able wind direction at the measurement site, when different air masses were being sampled. In Fig. 9b the particle burst begins during high tide. This can be explained either if the particles reaching the sampling point proceed from a differ-ent location around Mace Head, other than the nearest shore-line in front of Mace Head. It must also be considered that the tide can be higher and still allow nucleation if the wind is from sectors where the kelp beds extend further up the shore. Note that high tide was still fairly low (see Fig. 9b) and that it was a day of highly variable local meteorology, in particular in terms of wind direction. A burst of smaller particles then occurred later during low water, together with some growth of the larger particles. This suggests that there was a combi-nation of particles emitted from the near shoreline and from more distant sources. Also in Fig. 9a it should be noted that the number of particles of D<10 nm drops during low tide, when photolysis ceases after sunset (around 20:00 LT).
In an attempt to replicate the particle bursts measured at Mace Head over a low tide cycle, the model was initialised
892 A. Saiz-Lopez et al.: Modelling molecular iodine emissions in a coastal marine environment dN/dlogDp Day of Year (a) (b) -12 -10 -8 -6 -4 -2 P art ic le d ia m et er \ nm 3 4 5 6 7 8 9 10 1e+0 1e+1 1e+2 1e+3 1e+4 1e+5 1e+6 δt 2 4 6 8 10 12 dN / dlogDp dN/dlogDp Day of Year dN/dlogDp Day of Year -12 -10 -8 -6 -4 -2 P art ic le d ia m et er \ nm 3 4 5 6 7 8 9 10 1e+0 1e+1 1e+2 1e+3 1e+4 1e+5 1e+6 δt 2 4 6 8 10 12 dN / dlogDp
Fig. 10. (a) model simulation of the particle size distribution during
a noon low tide particle burst.Note that δt is in hours. (b) size dis-tribution measurements on DOY 222, 10 August, as measured by the DMPS instrument. Note that the unit of the colour-coded bar is an exponential.
with I2and allowed to run for 40 s to obtain the particle size distribution. This was subsequently repeated for different I2 mixing ratios to simulate the variation of I2during low tide around midday. In Fig. 10a the model output for the parti-cle distribution is plotted against time (δt=0 is equivalent to noon and minimum tidal height). For the results in Fig. 10a, the I2emission will follow a Gaussian distribution resulting in different peak mixing ratios depending on the strength of the emission. In the x-axis the dt is in hours as opposed to Figs. 3b and 6 where it is in minutes. This is compared in Fig. 10b with the dry particle size distribution for DOY 222, 10 August. As can be seen, the number of ultrafine particles at δt=0, when the iodine emissions are highest, is of the or-der of 104–105cm−3which is around the level at which the bursts normally occur. Note that the timescale (40 s) does not appear to be sufficient for the particles to grow in signif-icant numbers to diameters larger than 4–5 nm. This is gen-erally the case with nanoparticle observations at Mace Head, as the time required (over 1 min) for the newly formed par-ticles to evolve to bigger sizes is normally longer than the transit time from the emission source to the sampling point. Both modelled and measured particle size distributions agree reasonably well assuming that the emission point is about
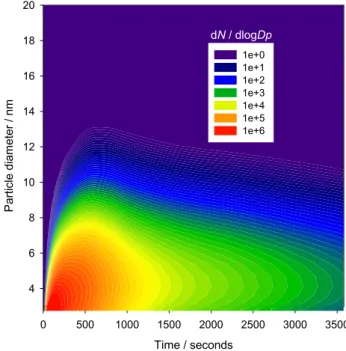
Time / seconds 0 500 1000 1500 2000 2500 3000 3500 P article diam eter / nm 4 6 8 10 12 14 16 18 20 1e+0 1e+1 1e+2 1e+3 1e+4 1e+5 1e+6 dN / dlogDp
Fig. 11. 1 h model run of the particle size distribution for an
evolv-ing plume from the point of emission. The model is initialised with in-situ measured mixing ratios of the iodine species, which are then allowed to dilute into the evolving plume.
100–120 m distant. If the particle bursts occurred at a differ-ent location (e.g. a coastal area upwind of Mace Head and/or Croaghnakeela Island – Fig. 2), the timescale to reach the sampling point would increase by over an order of magni-tude, allowing the ultrafine particles to evolve to larger sizes by the time they are observed at the at Mace Head. Note that the assumption made in this model that I2O2participates as a condensable unit in the iodine particle nucleation is key for the reproduction of the particle formation at short timescales (e.g. about 1 min). The sensitivity study carried out without including I2O2in the particle nucleation shows a significant reduction in the particle formation at this timescale. There-fore, the results are sensitive to this assumption, showing that more work is needed to clarify the roles of I2O2, I2O3 and I2O4in new particle formation.
Finally, the box model with entrainment is used to assess the potential of the iodine oxide particles to grow into CCN as the air parcel travels onshore. In this case the model was initialised as before, and then run for 1 h allowing the par-cel to dilute up to a boundary layer height of 1 km over a horizontal distance of about 14 km for a given wind speed of 4 m s−1. Note that the internal boundary layer depth (Stull, 1988) is derived from vertical mixing measurements at the site and the subsequent evolution of the boundary layer is assumed to be linear based on these meteorological obser-vations. However, we do not have measurements of how the vertical mixing developed 14 km inland. Figure 11 illustrates the evolution of the particle size distribution, showing the
particle number decreasing as they evolve to bigger diame-ters. Only a few hundred particles would grow up to sizes over 10 nm, whereas most remain below that particle diame-ter. If the minimum size to consider particles as CCN is typ-ically 60 nm, in this case the iodine oxide particle burst ap-pears to make a minor contribution to potential CCN. How-ever, the model does not include the growth of the particles by the uptake of other condensable vapours such as H2O and H2SO4, since very little is known about the properties of the iodine oxide particles in this regard. Thus the present model prediction of the total number of particles is probably valid, and the predicted growth is most likely a lower limit. In the model an upper limit to the first-order loss rate of new par-ticles due to intermodal coagulation is approximated as the first order loss rate of monomer units. Intermodal coagu-lation represents the integral of the coagucoagu-lation kernel con-volved with the number distribution for larger (measured) aerosol. The value we have chosen represents an upper limit to the loss rate since, as the freshly nucleated particles grow, their coagulation loss rate to the larger particles will only decrease below that for the monomer units. The reason for this treatment is that we use measured large mode aerosol for constraint, and the nucleation and growth description for the small aerosol does not interact with the measured aerosol. The coagulation to pre-existing aerosol does not greatly af-fect the result.
Figure 11 shows that over 110 cm−3of iodine-containing particles remain after the 1 h run, assuming these are fully mixed vertically up to 1 km. It must be noted that the model runs do not assume recycling of iodine from particles. How-ever, sensitivity studies have been carried out including io-dine recycling on aerosols via uptake of HOI and IONO2(the rate-limiting step in the recycle process), followed by subse-quent release of IBr and ICl. Incorporating recycling has an insignificant effect on model runs of a few minutes. This is assuming a scenario of freshly generated sea-salt aerosols, where no halogen processing is occurring at time zero. How-ever, when running the model for 1 h with iodine recycling, the size-integrated particle number density is now 3 times greater, reaching up to 300 cm−3. Of course, in this scenario the role of the I2O2 dimer as a condensable unit is crucial, since any IO formed as a consequence of IBr and ICl photoly-sis, when there is no I2around, will react with itself and con-tribute to the particle formation in the model. For instance, when the model is run without I2O2, the particle formation is less sensitive to iodine recycling in aerosols. If we take a typical background aerosol loading for a clean marine en-vironment of ∼100–500 cm−3(O’Dowd et al., 2002b), then there has been a significant contribution from iodine oxide particles to the background aerosol, and these may grow into CCN in the presence of additional condensable vapours. In-deed, a recent airborne experiment has produced clear evi-dence for the relatively large scale of new particle formation events in this coastal zone (O’Dowd, 2002).
5 Conclusions
An iodine chemistry model has been used to analyse mea-surements of I2 in the coastal MBL, which were made during the NAMBLEX campaign by three different tech-niques: long-path DOAS, BBCRDS and ICP/MS. This ex-ercise demonstrates that the I2 (and IO and OIO) were al-most certainly located above the intertidal zones at each end of the DOAS optical path. The formation of ultrafine parti-cles, following the emission of I2when macroalgae are ex-posed to the atmosphere at low tide, has been modelled and compared with observed particle bursts. The simulated parti-cle bursts produce a maximum number of ultrafine partiparti-cles (D=3–10 nm) exceeding 105cm−3, in good accord with the observations. Since we also report the first combined mea-surements of in-situ I2and ultra-fine aerosol, this study ap-pears to confirm that I2is the major precursor of these par-ticle bursts. The model also shows that the iodine oxide nanoparticles can grow to make an important contribution, at least on a regional scale, to to viable condensation nuclei. Fi-nally, the uncertainty surrounding the photolysis of the OIO radical was explored by assigning an upper limit to JOIO (as-suming absorption in the visible bands the molecule leads to 100% dissociation), and also considering the case that the photolysis yield is zero. This shows that the rate of new par-ticle formation is only slightly sensitive to JOIO, because the recombination of OIO with IO and itself is competitive with photolysis when the concentration of iodine oxides is rela-tively large above the intertidal zone. The rate of O3 deple-tion increases with JOIO, but even at the upper limit the effect is very localized and quickly disappears through entrainment of O3-rich air from higher in the boundary layer.
Acknowledgements. This work was supported by the UK National Environment Research Council. The authors wish to thank D. Heard (U. Leeds) for leading the NAMBLEX field campaign, R. Saunders (UEA) and Roberto Sommariva (NOAA) for helpful discussions.
Edited by: D. Heard
References
Alicke, B., Hebestreit, K., Stutz, J., and Platt, U.: Iodine oxide in the marine boundary layer, Nature, 397, 572–573, 1999. Allan, B. J., McFiggans, G., Plane, J. M. C., and Coe, H.:
Observa-tions of iodine monoxide in the remote marine boundary layer, J. Geophys. Res.-Atmos, 105, 14 363–14 369, 2000.
Allan, B. J., Plane, J. M. C., and McFiggans, G.: Observations of OIO in the remote marine boundary layer, Geophys. Res. Lett., 28, 1945–1948, 2001.
Ashworth, S. H., Allan, B. J., and Plane, J. M. C.: High resolu-tion spectroscopy of the OIO radical: Implicaresolu-tions for the ozone-depleting potential of iodine, Geophys. Res. Lett., 29, 1456, doi:10.1029/2001GL013 851, 2002.
894 A. Saiz-Lopez et al.: Modelling molecular iodine emissions in a coastal marine environment
Baker, A. R.: Inorganic iodine speciation in tropical Atlantic aerosol, Geophys. Res. Lett., 31, L23S02, doi:10.1029/2004GL020 144, 2004.
Ball, S. M. and Jones, R. L.: Broad-band cavity ring-down spec-troscopy, Chem. Rev., 103, 5239–5262, 2003.
Ball, S. M., Povey, I. M., Norton, E. G., and Jones, R. L.: Broad-band cavity ringdown spectroscopy of the NO3radical, Chem.
Phys. Lett., 342, 113–120, 2001.
Begovic, N., Markovic, Z., Anic, S., and Kolar-Anic, L.: Mod-elling the formation of biogenic iodine in marine aerosols, Envi-ron. Chem. Lett., 2, 65–69, 2004.
Bigg, E. K. and Turvey, D. E.: Sources of atmospheric particles over Australia, Atmos. Environ., 12, 1643–1655, 1978. Bitter, M., Ball, S. M., Povey, I. M., and Jones, R. L.: A broadband
cavity ringdown spectrometer for in-situ measurements of trace gases, Atmos. Chem. Phys., 5, 2547–2560, 2005a.
Bloss, W. J., Rowley, D. M., Cox, R. A., and Jones, R. L.: Kinet-ics and products of the IO self-reaction, J. Phys. Chem. A, 105, 7840–7854, 2001.
Bloss, W. J., Lee, J. D., Johnson, G. P., Sommariva, R., Heard, D. E., Saiz-Lopez, A., Plane, J. M. C., McFiggans, G., Coe, H., Flynn, M., Williams, P., Rickard, A. R., and Fleming, Z.: Impact of halogen monoxide chemistry upon boundary layer OH and HO2
concentrations at a coastal site, Geophys. Res. Lett., 32, 2005. Burkholder, J. B., Curtius, J., Ravishankara, A. R., and Lovejoy,
E. R.: Laboratory studies of the homogeneous nucleation of io-dine oxides, Atmos. Chem. Phys., 4, 19–34, 2004.
Calvert, J. G. and Lindberg, S. E.: The potential influence of iodine-containing compounds on the chemistry of the troposphere in the polar spring. I. Ozone depletion, Atmos. Environ., 38, 5087– 5104, 2004a.
Calvert, J. G. and Lindberg, S. E.: The potential influence of iodine-containing compounds on the chemistry of the troposphere in the polar spring. II. Mercury depletion, Atmos. Environ., 38, 5105– 5116, 2004b.
Carpenter, L. J.: Iodine in the marine boundary layer, Chem. Rev., 103, 4953–4962, 2003.
Carpenter, L. J., Sturges, W. T., Penkett, S. A., Liss, P. S., Alicke, B., Hebestreit, K., and Platt, U.: Short-lived alkyl iodides and bromides at Mace Head, Ireland: Links to biogenic sources and halogen oxide production, J. Geophys. Res.-Atmos, 104, 1679– 1689, 1999.
Chameides, W. L. and Davis, D. D.: Iodine – Its possible role in tro-pospheric photochemistry, J. Geophys. Res.-Atmos, 85, 7383– 7398, 1980.
Coheur, P. F., Fally, S., Carleer, M., Clerbaux, C., Colin, R., Jenou-vrier, A., Merienne, M. F., Hermans, C., and Vandaele, A. C.: New water vapor line parameters in the 26000-13000 cm(-1) re-gion, J. Quant. Spectrosc. Radiat. Transf., 74, 493–510, 2002. Cox, R. A., Bloss, W. J., Jones, R. L., and Rowley, D. M.: OIO and
the atmospheric cycle of iodine, Geophys. Res. Lett., 26, 1857– 1860, 1999.
Daehlie, G. and Kjekshus, A.: Iodine oxides, Part I, Acta Chem. Scand., 18, 144–156, 1964.
Davis, D. J., Crawford, J., Liu, S., McKeen, S., Bandy, A., Thor-ton, D., Rowland, F., and Blake, D.: Potential impact of iodine on tropospheric levels of Ozone and other critical oxidants, J. Geophys. Res.-Atmos, 101, 2135–2147, 1996.
Duce, R. A., Wasson, J. T., Winchester, J. W., and Burns, F.:
Atmo-spheric iodine, bromine, and chlorine, J. Geophys. Res.-Atmos, 68, 3943–3947, 1963.
Fuchs, N. A.: The mechanisms of aerosols, Pergamon Press, New York, 1964.
Garland, J. A. and Curtis, H.: Emission of iodine from the sea surface in the presence of Ozone, J. Geophys. Res.-Atmos, 86, 3183–3186, 1981.
Gravestock, T., Blitz, M. A., and Heard, D. E.: Kinetics study of the reaction of iodine monoxide radicals with dimethyl sulfide, Phys. Chem. Chem. Phys., 7, 2173–2181, 2005.
Himmelmann, S., Orphal, J., Bovensmann, H., Richter, A., Ladst¨atter-Weißenmayer, A., and Burrows, J. P.: First observa-tion of the OIO molecule by time-resolved flash photolysis ab-sorption spectroscopy, Chem. Phys. Lett., 251, 330–334, 1996. Hoffmann, T., O’Dowd, C. D., and Seinfeld, J. H.: Iodine oxide
ho-mogeneous nucleation: An explanation for coastal new particle production, Geophys. Res. Lett., 28, 1949–1952, 2001. Holleman, A. F. and Wiberg, E.: Inorganic chemistry, in: Academic
Press, edited by: Wiberg, N., Berlin, 2001.
Houghton, J.: The physics of atmospheres, Cambridge University Press, Cambridge, 2002.
Jacobson, M. Z.: Fundamentals of atmospheric modelling, Cam-bridge University Press, CamCam-bridge, 1999.
Jenkin, M. E., Cox, R. A., and Candeland, D. E.: Photochemical as-pects of tropospheric iodine behavior, J. Atmos. Chem., 2, 359– 375, 1985.
Jimenez, J. L., Bahreini, R., Cocker, D. R., Zhuang, H., Varut-bangkul, V., Seinfeld, R. C., O’Dowd, C. D., and Hoff-mann, T.: New particle formation from photooxidation of di-iodomethane (CH2I2), J. Geophys. Res.-Atmos, 108, 4318,
doi:4310.1029/2002JD002 452, 2003.
Kupper, F. C., Schweigert, N., Gall, E. A., Legendre, J. M., Vilter, H., and Kloareg, B.: Iodine uptake in Laminariales involves ex-tracellular, haloperoxidase-mediated oxidation of iodide, Planta, 207, 163–171, 1998.
Makela, J. M., Hoffmann, T., Holzke, C., Vakeva, M., Suni, T., Mat-tila, T., Aalto, P. P., Tapper, U., Kauppinen, E. I., and O’Dowd, C. D.: Biogenic iodine emissions and identification of end-products in coastal ultrafine particles during nucleation bursts, J. Geophys. Res.-Atmos, 107, 8110, doi:10.1029/2001JD000580, 2002.
McFiggans, G.: Marine aerosols and iodine emissions, Nature, 433, p. 7026, 2005.
McFiggans, G., Plane, J. M. C., Allan, B. J., Carpenter, L. J., Coe, H., and O’Dowd, C.: A modeling study of iodine chemistry in the marine boundary layer, J. Geophys. Res.-Atmos, 105, 14 371– 14 385, 2000.
McFiggans, G., Cox, R. A., M¨ossinger, J. C., Allan, B. J., and Plane, J. M. C.: Active chlorine release from marine aerosols: Roles for reactive iodine and nitrogen species, J. Geophys. Res.-Atmos, 107, 4271, doi:10.1029/2001JD000383, 2002.
McFiggans, G., Coe, H., Burgess, R., Allan, J., Cubison, M., Al-farra, M. R., Saunders, R., Saiz-Lopez, A., Plane, J. M. C., Wevill, D. J., Carpenter, L. J., Rickard, A. R., and Monks, P. S.: Direct evidence for coastal iodine particles from Laminaria macroalgae – linkage to emissions of molecular iodine, Atmos. Chem. Phys., 4, 701–713, 2004.
Misra, A. and Marshall, P.: Computational investigations of iodine oxides, J. Phys. Chem. A, 102, 9056–9060, 1998.
Norton, E. G., Vaugham, G., Methven, J., Coe, H., Brooks, B., Gal-lagher, M., and Longley, I.: Boundary layer structure and de-coupling from synoptic scale flow during NAMBLEX, Atmos. Chem. Phys., 5, 3191–3223, 2005.
O’Dowd, C. D.: On the spatial extent and evolution of coastal aerosol plumes, J. Geophys. Res.-Atmos, 107, 8105, doi:8110.1029/2001JD000 422, 2002.
O’Dowd, C. D., Lowe, J. A., Smith, M. H., Davison, B., Hewitt, N., and Harrison, R. M.: Biogenic sulphur emissions and inferred non-sea-salt-sulphate cloud condensation nuclei in and around Antarctica, J. Geophys. Res.-Atmos, 102, 12 839–12 854, 1997. O’Dowd, C. D., Jimenez, J. L., Bahreini, R., Flagan, R. C., Seinfeld,
J. H., Hameri, K., Pirjola, L., Kulmala, M., Jennings, S. G., and Hoffmann, T.: Marine aerosol formation from biogenic iodine emissions, Nature, 417, 632–636, 2002a.
O’Dowd, C. D., Hameri, K., Makela, J. M., Pirjola, L., Kulmala, M., Jennings, S. G., Berresheim, H., Hansson, H. C., de Leeuw, G., Kunz, G. J., Allen, A. G., Hewitt, C. N., Jackson, A., Viisa-nen, Y., and Hoffmann, T.: A dedicated study of New Particle Formation and Fate in the Coastal Environment PARFORCE: Overview of objectives and achievements, J. Geophys. Res.-Atmos, 107, 8108, doi:8110.1029/2001JD000 555, 2002b. O’Dowd, C. D., Hameri, K., Makela, J. M., Vakeva, M., Aalto,
P. P., de Leeuw, G., Kunz, G. J., Becker, E., Hansson, H. C., Allen, A. G., Harrison, R. M., Berresheim, H., Geever, M., Jen-nings, S. G., and Kulmala, M.: Coastal new particle formation: Environmental conditions and aerosol physicochemical charac-teristics during nucleation bursts, J. Geophys. Res.-Atmos, 107, 8107, doi:8110.1029/2001JD000 206, 2002c.
Plane, J. M. C. and Nien, C.-F.: A study of night-time NO3
chem-istry by differential optical absorption spectroscopy in measure-ment of atmospheric gases, in Proc. SPIE, Int. Soc. Opt. Eng., pp. 8–20, 1991.
Plane, J. M. C. and Saiz-Lopez, A.: UV-visible Differential Optical Absorption Spectroscopy (DOAS), in: Analytical Techniques for Atmospheric Measurement, edited by: Heard, D. E., Blackwell Publishing, Oxford, in press, 2006.
Press, W. H., Flannery, B. P., A.Teukolsky, S., and Vetterling, W. T.: Numerical recipes: The art of scientific computing, Cambridge University Press, Cambridge, 1986.
Saiz-Lopez, A. and Plane, J. M. C.: Novel iodine chemistry in the marine boundary layer, Geophys. Res. Lett., 31, L04112, doi:04110.01029/02003GL019215, 2004.
Saiz-Lopez, A., Saunders, R. W., Joseph, M., and Plane, J. M. C.: Absolute absorption cross-section and photolysis rate of I2,
At-mos. Chem. Phys., 4, 1443–1450, 2004.
Sander, S. P., Friedl, R. R., Golden, D. M., Kurylo, M. J., Huie, R. E., Orkin, V. L., Moortgat, G. K., Ravishankara, A. R., Kolb, C. E., Molina, M., and Finlayson-Pitts, B. J.: Chemical kinetics and photochemical data for use in stratospheric modeling: Eval-uation 14, Tech. rep., Jet Propulsion Laboratory, Pasadena, Cali-fornia, USA, http://jpldataeval.jpl.nasa.gov/, 2003.
Saunders, R. W. and Plane, J. M. C.: Formation pathways and com-position of iodine ultra-fine particles, Environ. Chem., 2, 299– 303, 2005.
Stull, R. B.: An introduction to boundary layer meteorology, Kluwer Academic Publishers, London, 1988.
Truesdale, V. W., Luther, G. W., and Canosa-Mas, C.: Molecular iodine reduction in seawater – an improved rate equation consid-ering organic compounds, Mar. Chem., 48, 1994.
Vogt, R., Sander, R., von Glasow, R., and Crutzen, P. J.: Iodine chemistry and its role in halogen activation and ozone loss in the marine boundary layer: A model study, J. Atmos. Chem., 32, 375–395, 1999.
Winklmayr, W., Reischl, G. P., Lindner, A. O., and Berner, A.: A new electromobility spectrometer for the measurement of aerosol size distributions in the size range from 1 to 1000 nm, J. Aero. Sci., 22, 289–296, 1991.
Yoon, Y. J., O’Dowd, C. D., Sellegri, K., Pirjola, L., Chen, H., and Hoffmann, T.: Biogenic aerosol and gas flux study in and around Mace Head, in: Nucleation and Atmospheric Aerosols, edited by: Kasahara, M. and Kulmala, M., Kyoto, Japan, 2004.