HAL Id: hal-00330860
https://hal.archives-ouvertes.fr/hal-00330860
Submitted on 1 Jan 2004HAL is a multi-disciplinary open access archive for the deposit and dissemination of sci-entific research documents, whether they are pub-lished or not. The documents may come from teaching and research institutions in France or abroad, or from public or private research centers.
L’archive ouverte pluridisciplinaire HAL, est destinée au dépôt et à la diffusion de documents scientifiques de niveau recherche, publiés ou non, émanant des établissements d’enseignement et de recherche français ou étrangers, des laboratoires publics ou privés.
using INCA: calibration and scenario analyses for the
Kervidy catchment (W. France)
P. Durand
To cite this version:
P. Durand. Simulating nitrogen budgets in complex farming systems using INCA: calibration and scenario analyses for the Kervidy catchment (W. France). Hydrology and Earth System Sciences Discussions, European Geosciences Union, 2004, 8 (4), pp.793-802. �hal-00330860�
Simulating nitrogen budgets in complex farming systems using INCA: calibration and scenario analyses for the Kervidy catchment Hydrology and Earth System Sciences, 8(4), 793802 (2004) © EGU
Simulating nitrogen budgets in complex farming systems using
INCA: calibration and scenario analyses for the Kervidy
catchment (W. France)
Patrick Durand
UMR SAS INRA, 65, rue de St Brieuc, F-35390 Rennes, France Email: [email protected]
Abstract
The integrated nitrogen model INCA (Integrated Nitrogen in Catchments) was used to analyse the nitrogen dynamics in a small rural catchment in Western France. The agrosystem studied is very complex, with: extensive use of different organic fertilisers, a variety of crop rotations, a structural excess of nitrogen (i.e. more animal N produced by the intensive farming than the N requirements of the crops and pastures), and nitrate retention in both hydrological stores and riparian zones. The original model features were adapted here to describe this complexity. The calibration results are satisfactory, although the daily variations in stream nitrate are not simulated in detail. Different climate scenarios, based on observed climate records, were tested; all produced a worsening of the pollution in the short term. Scenarios of alternative agricultural practices (reduced fertilisation and catch crops) were also analysed, suggesting that a reduction by 40% of the fertilisation combined with the introduction of catch crops would be necessary to stop the degradation of water quality.
Keywords: diffuse pollution, nitrate, climate change, model
Introduction
In agricultural catchments, the nitrogen budget is dominated by the input of fertilisers and the export of crops, and the nitrate losses in the stream are thus related to the imbalance between these two fluxes, although the relationship is not always simple (Ruiz et al., 2002). In modern farming systems, the presence of animals adds further complexity: the fertilisers are, in part, produced in the system (manure), and the importation of fodder and N-rich feed supplements may represent a significant input, while part of the N export is in the form of milk or meat. Moreover, the N budgets of the pastures are difficult to assess and, usually, cultivation is based on crop rotations of variable types and duration (Simon and Le Corre, 1992; Vertes et al., 1997; Chauvin et al., 1997). Detailed surveying of all the N agricultural fluxes in such a system is difficult and time-consuming at the farm scale, and becomes practically impossible in catchments above several square kilometres. Even if this difficulty is overcome, the precise description of the agricultural practices within a modelling framework requires complex,
spatially distributed models interfaced with sophisticated data handling systems (Lasserre et al., 1999; Birkinshaw and Ewen 2000; Bouraoui and Dillaha 2000; Saleh et al., 2000). Consequently, nitrogen diffuse pollution modelling in such systems at medium (10 to 100 km² ) or large scales (over 1000 km²) relies frequently on very drastic simplifications of the agricultural practices. Although such studies can give an interesting picture of the present state of the system and help to highlight the main problems (Andersen et al., 1999; Eisele and Leibundgut, 2002), they do not allow to investigation of fully alternative scenarios such as the implementation of more sustainable farming practices or the impact of global changes on the nitrogen budgets.
Further complications arise when the farming catchment is located in shallow groundwater areas where the water table in the lower parts of the hillslopes may be within the root zone, at least in winter. Hence, the nitrate leached from the upslope field may flow through highly biologically reactive zones, where it can be denitrified or taken up by
the vegetation (Haycock et al., 1993). Consequently, the nitrate loss at the outlet of the catchment is not just the sum of the nitrate losses from all the fields, and the impact of the riparian zone activity must be taken into account. Again, a detailed simulation of such mechanisms requires relatively complicated, fully distributed models (Beaujouan et al., 2001; Arheimer and Wittgren, 2002).
There is still much uncertainty regarding climate variations in the near future, either natural or man-induced. In Western Europe, most future climate change scenarios predict an increase in mean temperature and amplification of climate extremes (wetter winters and drier summers). All the processes affecting the nitrogen budget are strongly controlled both by temperature and water regime, making it impossible to predict the resulting effect of climate changes on nitrogen losses at the catchment scale without a reasonably detailed model. For example, wetter and milder winters would increase the leaching from the soil due to the increased water flux through the soil, but it would probably also enhance denitrification by increasing the soil wetness and temperature.
In the present paper, an attempt is made to simulate, realistically, the nitrogen transfers and transformations in such a complex system using the simple, generic INCA (Integrated Nitrogen in Catchments) model. To achieve the description of the farming practices and riparian zone functioning of the study catchment, some of the model features were used in a non-classical way. The ability of the model to reproduce the present state of the system and to perform scenario analyses is also discussed.
Materials and Methods
STUDY AREA
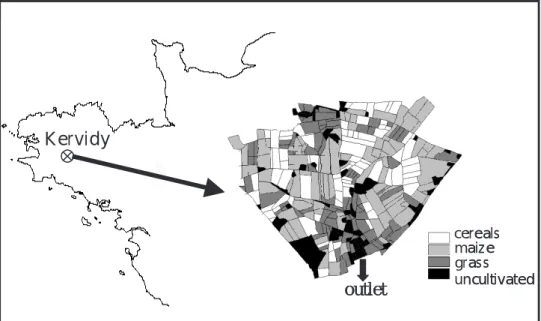
The Kervidy catchment is a 4.9 km² first-order sub-catchment of the experimental research sub-catchment of Coët-Dan in Brittany (Western France) (Fig. 1), which has been studied extensively for ten years (Cheverry, 1998). Elevations range from 98 to 140 m a.s.l and the Kervidy catchment is characterised by gentle slopes of less than 5%, with the northern part being particularly flat. The stream network is approximately 4.4 km long. The stream can dry out over one or two months in summer whereas in winter, the mean daily streamflow can exceed 1 m3 s1.
The climate is humid and temperate; the 30-year average annual precipitation was 909 mm and average monthly air temperatures ranged from 8.4 °C in January to 22.9 °C in July. The soils are silty loams varying in depth from 0.5 m to 1.5 m and the system comprises a well-drained upland domain and a poorly-drained bottom one of about 15% of the catchment area. Although the latter is partially drained (by subsurface pipes) the water table is at or close to the surface for 36 months of the year, between October and March (Molenat et al., 2004).
The climate is recorded by an automatic weather station. The discharge at the outlet is monitored using a rectangular weir and a water level data logger. Grab water samples have been collected fortnightly from 1992 to 1999, with some additional detailed sampling during stormflow events. Since 1999, the CNRS (Centre National de la Recherche Scientifique) Geosciences Research Unit has collected daily
K ervidy
cereals maize gras s uncultivatedoutlet
K ervidy
cereals maize gras s uncultivatedoutlet
Simulating nitrogen budgets in complex farming systems using INCA: calibration and scenario analyses for the Kervidy catchment samples for nitrate determination by ion chromatography
after 0.45µm filtering and conservation at 4 °C for a few days. Previous monitoring of other nitrogen species in the stream (Cann, 1990) has shown that more than 95% of the nitrogen fluxes occur as nitrate, so it is the only species considered here.
The agricultural practices in the catchment have been monitored by CEMAGREF in Rennes (Centre détude du machinisme agricole, des eaux et des forêts) at different dates since 1988 (Cann, 1990; Bordenave, 2001; Abrassart, 2001), by means of questionnaires to farmers (every 58 years, 80% of the farms being investigated) and field observations (the land use of each field being surveyed each spring). However, the complexity and diversity of the farming in the catchment is so high that this monitoring is far from exhaustive and large uncertainties remain, especially regarding the date, dose and nature of fertilisers applied.
MODELLING SET-UP
The simulations of the N dynamics in the catchment were performed using one of the latest versions of the INCA model (version 1.7.14). This model is a semi-distributed hydrological and nitrogen model, which has been fully described elsewhere (Wade et al., 2002; Wade, 2004). Initially designed to be a simple, all-purposed nitrogen model, INCA has progressively included features required for specific applications. In particular, INCA is now able to account for relatively detailed farming practices, by accepting time series of fertiliser applications for each land use, and possibily by defining different growth periods within a simulation run.
Nine years of observations (stream discharge and nitrate concentration, standard climate variables) from August 1993 to August 2002 were available. The model was calibrated manually on the first two years data and a validation run on the following seven years was realised (for a general discussion of model parameterisation on this catchment, see Durand et al., 2002).
The time series of hydrologically effective rainfall (HER) and soil moisture deficit (SMD), needed as input data by the model, were derived from a simple spreadsheet soil water balance model, inspired by classical approaches (e.g. Hillel, 1982). The soil moisture deficit is nil at field capacity and maximal at wilting point (SMDMAX), i.e. only the retention porosity is considered, assuming that the free drainage is faster than the evaporative processes. A threshold corresponding to the beginning of water stress for plants is also defined (SMDTHR).
Evapotranspiration is calculated as follows. When SMD is between 0 and SMDTHR, the actual evapotranspiration
(AET, in mm day1) is limited not by soil moisture, but by crop development, using the crop coefficient (KC, dimensionless) approach (Allen et al., 1998):
PET KC
AET u (1)
where PET is Penmans potential evapotranspiration in mm day1.
Values of KC for the different crops were derived from standard agronomic tables. When the soil moisture deficit is between SMDTHR and SMDMAX (both in mm), a further limitation to evapotranspiration comes from the soil water availability, according the following formula:
SMDMAX -SMDTHR SMDMAX -SMD PET KC AET u u (2)
Then, the effective rainfall is calculated as follows. When the soil is at field capacity, all incoming rainfall (R) is considered as effective rainfall:
HER=R (3)
When the soil is drier, the rainfall must first refill the soil to field capacity before being counted as effective, thus:
HER=R-SMD if SMD<R, else HER=0. (4)
For the Kervidy catchment soils, the SMDMAX and SMDTHR values were set as 170 and 120 mm, respectively, according to soil studies made in the catchment.
ADAPTATION OF INCA TO FARMING SYSTEMS
In standard applications of the model, the land-use types have constant characteristics and parameters during the simulation period. However, in an agricultural catchment, the fields are subjected to crop rotations, and it is obvious that winter wheat has not the same nitrogen dynamics as maize or grassland, for example. In Western France, grassland takes up nitrogen from February to November, accumulates organic nitrogen in the root system and requires between 250 to 350 kg N ha1 nitrogen per year, whereas the maize uptake occurs from May to September and requires about 150 kg N ha1 only. It is well known that some crop successions are more risky than others in terms of nitrate leaching: when a maize follows a winter wheat, the soil is left bare from the end of July (wheat harvest) to late April or early May the following year (maize sowing); when a grassland is ploughed after three to seven years, the mineralisation of the plant residues represents about 200 kg
N ha1 of nitrogen that is available to the next crop, which is often underestimated by farmers. It was, therefore, essential to try to represent crop successions in the model. However, given that the model does not allow a detailed description of the agricultural practices, a very simplified version was adopted. Three main types of rotations were identified: one alternates maize and winter cereals, the maize being strongly over-fertilised to dispose of the excess of animal manure, and is usually adopted by pig breeders; a second one, based on the same crop succession, receives less fertilisers because it occurs on dairy farms, for which the organic N is not so much in surplus; and a third one includes five years of grassland, one year of maize and one year of winter cereal (used by dairy producers). Of course, the reality is much more complex and rotations vary from farm to farm and from field to field, and sometimes include other crops such as vegetables or colza (about 15% of the cultivated area). Nevertheless, it is believed that these three types capture most of the nitrogen dynamics patterns in the catchment.
Since it is not possible to change the nitrogen transformation rates in the model, the only way to simulate these crop successions was to introduce multiple growth periods and fertiliser application time series. For example, the mineralisation occurring after grassland ploughing was simulated by increasing the ammonium fertilisation the following year.
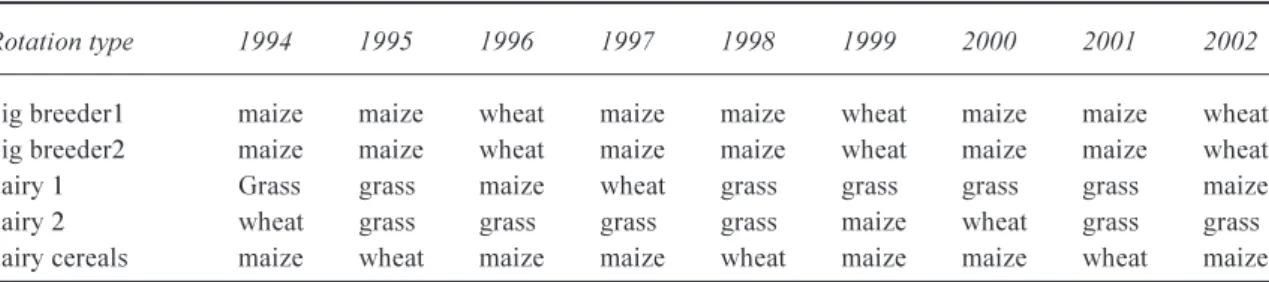
The difficulty in this process was in conserving the same surface for each crop type from year to year: in the Kervidy catchment, the proportions of grassland, maize and winter cereals remain approximately constant at 25%, 50% and 25% of the cultivated area, respectively. This was more or less achieved (not for each year individually but for two or three successive years), by doubling two of the rotation types and choosing a different starting crop (Table 1).
Another feature of farming systems difficult to describe with INCA is their use of organic fertilisers. They are of different kinds (pig slurry, bovine manure, cow dung in pastures, compost, etc.) each with very variable nitrogen content and mineralisation dynamics; but in INCA, mineral fertilisers only are considered, organic-N being considered
as an unlimited store. Indeed, very detailed nitrogen/carbon models are required to describe these dynamics properly, supposing that the composition of the product is known, which is rarely the case given the large variability. In this application, two types of organic fertilisers, pig slurry and slow mineralising manure were considered. Pig slurry application was supposed equivalent to ammonia fertilisation, given the rapidity of its mineralisation. An average content of 4 kg N m3 was used, derived from regional references. Manure spreading was supposed to occur regularly every year on all the fields and so, to have the same dynamics as the natural soil humus mineralisation, the mineralisation rate was increased to an average content of 6 kg N t1.
On the whole, the fertilisation was adjusted to reproduce the overall excess nitrogen, i.e. the amount of nitrogen available for leaching, of 170 kg N ha1 yr1 for the cultivated areas, or 150 kg N ha1 yr1 for the whole catchment, as assessed by different studies (Cann, 1990; Bordenave, 2001), while staying close to realistic practices.
Results and discussion
CALIBRATION AND VALIDATION
The overall nitrogen input output budget of the Kervidy catchment is unbalanced: the excess nitrogen is approximately 150 kg N ha1 yr1 whereas the output flux in the stream is only approximately 70 kg N ha1 yr1. Previous studies (Molenat et al., 2004; Durand et al., 1999) have shown that the main reasons for this is an increase in the nitrogen store of the catchment, especially as nitrate in the water stores (especially in the groundwater store), and the denitrification and uptake in the riparian area. The storage of nitrate can be simulated by INCA by setting large store volume parameters (retention porosity of the soil zone, drainage volume in the soil and groundwater zone), but the riparian zone was not accounted for in this version of the model. However, it is possible to change the size of the reach compartment using the a, b (velocity parameters, a in m2, b
Table 1. Simulated crop successions for the five rotation types
Rotation type 1994 1995 1996 1997 1998 1999 2000 2001 2002
pig breeder1 maize maize wheat maize maize wheat maize maize wheat
pig breeder2 maize maize wheat maize maize wheat maize maize wheat
dairy 1 Grass grass maize wheat grass grass grass grass maize
dairy 2 wheat grass grass grass grass maize wheat grass grass
Simulating nitrogen budgets in complex farming systems using INCA: calibration and scenario analyses for the Kervidy catchment Ø), and L (channel length, m) of the stream cell submodel,
given that : a Q L V b) -(1 (5)
where V is the volume of water in the reach (m3) and Q the daily discharge (m).
The solution to account for riparian zone denitrification was to include the riparian zone in the stream cell by fixing the reach parameters so that V corresponded to the volume of water stored in the riparian zone and the stream. This volume was estimated by taking into account the extension of the waterlogged soils in the catchment and their total porosity.
The calibration was performed manually and the parameters were kept within physically realistic values while the goodness of fit was estimated graphically: since the whole parameter space has not been fully explored, the calibrated parameter set (Table 2) may not be the best possible and other parameter combinations could have given equally or more acceptable results.
The goodness of fit was estimated using four criteria: the Nash and Sutcliffe efficiency (NS) (Nash and Sutcliffe, 1970), the coefficient of determination (R²), the root mean
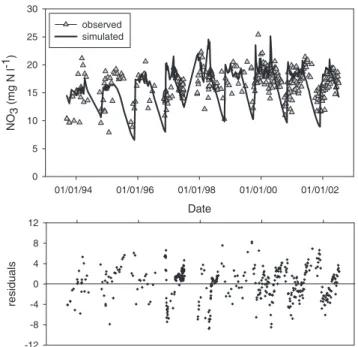
square error (RMSE), and the bias (mean error). For the discharge, the NS decreases from 0.84 to 0.81, and the R² from 0.86 to 0.80 between the calibration and the validation periods, respectively. This decrease, considered acceptable, is attributed to the extreme flows observed in the winter 20002001, which the model tends to underestimate (Fig. 2); this is not very significant, since during these high flows, the nitrate concentration is low and the corresponding flux insignificant at an annual scale. For similar reasons, the RMSE for the whole period is rather high (0.043 m3s1, when the mean daily flow is 0.066 m3s1), but the bias is very low (0.002 m3s1). For the nitrate concentrations, the NS is close to zero and the R² very low (0.3) for both the calibration and validation period. This shows that the model fails to reproduce the detailed variability of the nitrate concentrations, although the main seasonal and interannual trends are well simulated. This variability is often very high in small catchments, and is attributed to complex mixing processes or temporary point sources (such as manure tank flushing). There is not, to date, any model capable of reproducing, deterministically, both these variations as well as the broader trends. It is considered that, in terms of environmental impact, these erratic variations, however useful in understanding the full complexity of the system, are less significant than the broader trends The simulation of the broad trends, shown graphically in Fig. 3, is clearly adequate, as the RMSE is fairly low (15% of the mean
Date 01/01/94 01/01/96 01/01/98 01/01/00 01/01/02 Di sc har ge ( m 3 s -1) 0.0 0.2 0.4 1.0 1.2 date1 vs débitsim date1 vs debitobs re si dual s -0.4 -0.2 0.0 0.2 0.4 0.6
Table 2. Parameter values used in INCA application to the Kervidy catchment
Parameter value
Plant nitrate uptake rate (day1) 0.035 Maximum nitrate uptake (kg N ha1yr1) 300
Nitrification rate (day1) 0.4
Mineralisation (kg N ha1/day) 1.5
Immobilisation rate (day1) 0.01
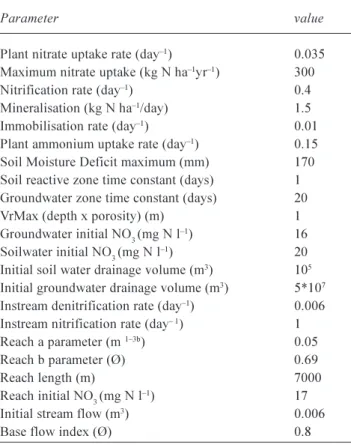
Plant ammonium uptake rate (day1) 0.15 Soil Moisture Deficit maximum (mm) 170 Soil reactive zone time constant (days) 1 Groundwater zone time constant (days) 20
VrMax (depth x porosity) (m) 1
Groundwater initial NO3 (mg N l1) 16 Soilwater initial NO3 (mg N l1) 20 Initial soil water drainage volume (m3) 105 Initial groundwater drainage volume (m3) 5*107 Instream denitrification rate (day1) 0.006 Instream nitrification rate (day 1) 1
Reach a parameter (m 13b) 0.05
Reach b parameter (Ø) 0.69
Reach length (m) 7000
Reach initial NO3 (mg N l1) 17
Initial stream flow (m3) 0.006
concentration), and the bias is almost zero.
The nitrogen process loads computed by the model, and expressed by crop type, are presented in Fig. 4. The values are well within the range of values observed in the area (Chauvin et al., 1997). Figure 4 shows that the nitrogen budget in such catchments is dominated by the fertiliser and crop uptake loads, and that environmentally significant processes (leaching, denitrification) are much less important;
this shows that it would be difficult to make a good estimate of them from input-output catchment-scale budgets alone. In that respect, although the model fails to simulate the detailed dynamics of the stream concentration, it is an interesting tool to assess the different components of the overall annual nitrogen budget.
CLIMATE SCENARIOS
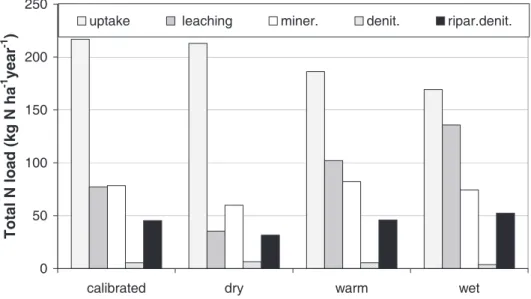
Since the prediction of climate time series by general circulation models cannot be used easily at the local scale (as an illustration, the Kervidy catchment is located in a sea grid cell in the landsea mask of the Hadley Centre GCM), the climate scenarios for this study were constructed by making full use of the climate variations observed during the nine years monitoring of the catchment. This time series is fairly contrasted with the annual rainfall varying from 548 to 1323 mm. Three years were selected, corresponding to the wettest, the driest and the warmest year of the period (with an annual temperature of 11.9°C, about 1°C above the interannual mean). Each of these years was repeated nine times to construct three nine-year climate scenarios to compare with the observed one. The results are shown in Figs. 5 and 6 and Table 3. In all cases, the difference with the calibrated run can be interpreted as a worsening of the environmental status of the catchment, although not for the same reason in each case. The dry scenario resulted in a strong decrease in the N fluxes at the outlet, but this was associated with a significant increase in the concentrations because of lower dilution and lower denitrification, both in the stream and in the soilwater. The wet and warm scenarios resulted in a strong increase of the N fluxes at
Date 01/01/94 01/01/96 01/01/98 01/01/00 01/01/02 NO 3 (mg N l -1) 0 5 10 15 20 25 30 observed simulated res idua ls -12 -8 -4 0 4 8 12 0 50 100 150 200 250 300 350 400
grassland wheat maize riparian/stream
Tot al N loa d ( kg N ha -1 year -1)
fertilisation uptake leaching mineralization denitrification
Fig. 3. Calibration results : observed and simulated stream nitrate
concentrations (above) and residuals (simulated minus observed concentrations).
Simulating nitrogen budgets in complex farming systems using INCA: calibration and scenario analyses for the Kervidy catchment 0 50 100 150 200 250
calibrated dry warm wet
Tot
al N load (
kg N ha
-1 year -1 )
uptake leaching miner. denit. ripar.denit.
Table 3. Results of the climate scenarios. Mean annual N flux at the outlet, mean nitrate concentration in the stream and final concentrations in the groundwater (gw) and in the soil water (sw) of the cultivated areas.
Kg N ha1 mg N l1
outlet NO3 NO3 NO3
flux stream gw end sw end
Calibrated 80 18.3 16.8 36.8
Dry 36 21.3 16.9 69.0
Warm 107 17.6 17.1 38.0
Wet 141 16.3 16.7 27.7
Fig. 5. Climate scenarios: simulated nitrate stream concentrations for the calibration run and the three scenarios.
Fig. 6. Climate scenarios: simulated annual nitrogen loads for the calibration run and the three scenarios, averaged for the whole catchment.
outlet, mainly because of a higher water flux, with a slight decrease in the concentrations due to higher dilution and denitrification, but no significant decrease in the groundwater concentration. This suggests that such heavily polluted catchments are very sensitive to climate disturbances, due to the overall N saturation of the system. In particular, the nitrogen store in such catchments can be sufficiently large to maintain the high concentrations even under high rainfall scenarios.
AGRICULTURE SCENARIOS
The most obvious way to reduce nitrate leaching from fields Date 01/01/94 01/01/96 01/01/98 01/01/00 01/01/02 NO 3 (mg N l -1 ) 5 10 15 20 25 30 calibrated dry warm wet
is to reduce nitrogen fertilisation. In general, for the farmers, this requires either the correction of the crop requirement overestimation, or the reduction of the safety margin usually applied. The overestimation of the plant requirements is often due to an overestimation of the target yield or to an underestimation of the nitrogen supply by the soil via mineralisation. Both can be reduced by better knowledge of the local conditions and a better supply of information to the farmers.
In very intensive farming areas, another cause of over-fertilisation arises from the necessity of disposing of excess animal manure, principally due to breeding units (especially of pigs and poultry) which depend on external, nitrogen-rich fodder. In these cases, the reduction in fertilisation is not so straightforward, and complementary measures need to be taken, such as the introduction of nitrogen catch crops in periods when the soil is usually bare, typically between a winter cereal and maize. The catch-crop species usually sown are phacelia (Phacelia tanacetifolia Bentham), white mustard (Sinapis alba L.) and Italian rye grass (Lolium italicum A. Br.).
These options for nitrate leaching reduction form the
Table 4. Results of the agriculture scenarios. See Table 3 for definitions of the terms and changes in fertilisation, leaching and uptake loads, expressed as percent of calibrated results (a positive value meaning an increase, a negative value a reduction).
Kg N ha-1 mg N l-1 %
outlet flux NO3 stream NO3 gw NO3 sw fertilisation leaching uptake
end end change change change
Calibrated 79 18.0 16.8 37 - -
-Ccatch crops 66 17.5 16.7 36 - -27% +21%
Reduced fertilisation 64 14.7 16.3 26 -40% -28% -9%
Combined 56 14.9 16 25 -40% -37% -10%
reasoning behind the three types of agricultural scenarios tested here, one with a reduction of N fertilisation, one with the introduction of N catch crops, and one combining both N catch crops and fertilisation reduction. The catch crop scenario was simulated in INCA by introducing a supplementary crop growth period whenever possible in the crop rotations. This also induced changes to the HER input file, since the presence of catch crops increases actual evapotranspiration as compared to the bare soil intercrop period of the calibration scenario. The new amount of fertilisers used in the reduction scenario was calculated to be about 10% above the standard crop requirements for the area. In the combined scenario, the same amount of fertiliser was applied, without taking into account the requirements of the catch crops.
The results show that all three scenarios reduced differently the nitrate losses of the catchment but to different degrees (Table 4 and Fig. 7): the catch crop scenario reduces stream nitrate concentrations only slightly, but it reduces water fluxes and therefore the nitrate flux due to the increase in AET. The reduced fertilisation scenario reduces the nitrate concentrations in the stream significantly
Fig. 7. Agriculture scenarios : simulated nitrate stream concentrations for the calibration run and the three scenarios.
date 01/01/94 01/01/96 01/01/98 01/01/00 01/01/02 NO 3 (mg N l-1 ) 5 10 15 20 25 30 calibrated catch crop fertil. reduction combined
Simulating nitrogen budgets in complex farming systems using INCA: calibration and scenario analyses for the Kervidy catchment but, in terms of nitrate flux, the result is almost the same as
the catch crop scenario. Combining reduced fertilisation and catch crop introduction results in a decrease in both concentrations and water fluxes, leading to a decrease of the nitrate flux at the outlet of 30% over the nine years of simulation. However, it must be pointed out that, both in the calibration scenario and in the alternative scenarios, the catchment is not in steady state. In the calibration scenario the concentrations in the groundwater, which corresponds to the reservoir with the highest memory effect, increase steadily over the nine years, at a mean rate of 0.1 mg N l1 yr1. In the catch crop scenario, the increase is still there, but with a lower rate. It is only in the combined scenario that the concentration in the groundwater does not increase. This implies, firstly, that the beneficial effect of the scenarios on water quality would have been greater if a longer period had been considered; and secondly, that the scenarios designed produce, in the best case, a stabilisation of the situation, which means that more drastic measures would be required to actually reverse the trend. Indeed, the three scenarios tend to preserve the productivity of the system, decreasing only slightly, in the case of fertilisation reduction, the predicted nitrogen uptake by the crop, which can be seen as an indicator of the yield (Table 4). In short, this modelling exercise suggests that remediation of water pollution by nitrate in this catchment would be achieved only at the cost of a significant reduction in farming production.
Conclusions
The ability of a simple, semi-distributed conceptual model to analyse the nitrogen dynamics of a complex farming system has been investigated in detail. The INCA model has proved to be versatile enough to accommodate a variety of farming practices as well as environmental subsystems such as riparian areas, (although this has required some non-standard interpretations of the model structure). The results for nitrogen budget, mean process loads and seasonal dynamics are reasonable. However, the model failed to simulate the daily variations in the nitrate concentrations in the stream. These variations are controlled by different factors, including the dynamics of the riparian zone, overland flow, subsurface and deep flow (Durand and Juan Torres, 1996) while the hydrological structure of the model is based on a shallow surface reservoir (biologically reactive and producing quickflow), a subsurface reservoir, (non-reactive and producing delayed flow), and a reactive channel, which is too simple to reproduce these variations. A new version of the model, explicitly including a riparian zone as a seventh land cell that collects the flows from the other cells, is currently being tested and may well improve the
performance of the model. However, reproducing these daily variations is not critical to addressing issues of agricultural nitrogen diffuse pollution, for which the variables of interest are essentially the mean concentration and the flux, as well as the major components of the nitrogen budget at the catchment scale. In that respect, the analyses of the scenarios provide a useful insight into the consequences of different perturbations of the system.
In the short term, all the climate scenarios simulated here have tended to worsen the pollution, which results probably from the advanced N saturation of the system. A refined assessment of climate change effects could include GCM model-based climate time series scenarios and longer term simulation. The three main challenges for this analysis are: firstly, to obtain reasonable local climate scenarios; secondly, not to overlook processes or store changes that may become important at this time scale, such as the variation in the soil organic matter pools and C:N ratios (which are not accounted for in the present versions of INCA); and thirdly, to be reasonably sure to test pertinent scenarios. Indeed, it may not be relevant to test a climate scenario predicted for the next century with current farming practices that are obviously aberrant and not even complying with current French or EU regulations, such as limiting N organic loading to 170 kg N ha1 on arable land. In this regard, testing alternative farming practices, more sustainable both in terms of environmental quality and social acceptability, is an important step. A first attempt had been made here; it suggests that a moderate change of management practices within the same agriculture production system may effect some improvement but will not be sufficient to solve the problem of nitrate pollution. This highlights the need for construction of alternative scenarios using both agronomic and economic expertise and, probably, detailed testing of these scenarios on well known case studies, using the INCA approach in conjunction with more complex models, before regionalising the scenario testing. It has often been suggested that the nitrate diffuse pollution problem can be solved easily, simply by adjusting the fertilisation to the plant requirements. Unfortunately, the lack of precise, quantitative knowledge of the interactions between farming practices, socio-economic context and catchment dynamics makes this simple solution merely a theoretical statement. The INCA project is definitely a useful step forward in this context.
Acknowledgements
This work has been funded by the EU contract n°EVK1-1999-00011.The author is grateful to Jerôme Molenat and Gérard Gruau for providing unpublished data.
References
Abrassart, J., 2001. In: Pollutions Diffuses: du bassin versant au littoral. Actes de Colloques 24, Editions IFREMER, Plouzané, France, 298310.
Allen, R.G., Pereira, L.S., Raes, D. and Smith, M., 1998. Crop evapotranspiration (guidelines for computing crop water requirements). FAO Irrigation and Drainage Paper, No. 56, 290pp.
Andersen, H.E., Kronvang, B. and Larsen, S.E., 1999. Agricultural practices and diffuse nitrogen pollution Denmark: empirical leaching and catchment models. Water Sci. Technol., 39, 257 264.
Arheimer, B. and Wittgren, H. B., 2002. Modelling nitrogen removal in potential wetlands at the catchment scale. Ecol. Eng., 19, 6380.
Beaujouan, V., Durand, P. and Ruiz, L., 2001. Modelling the effect of the spatial distribution of agricultural practices on nitrogen fluxes in rural catchments. Ecol. Model., 137, 93105. Birkinshaw, S.J. and Ewen, J., 2000. Modelling nitrate transport
in the Slapton Wood catchment using SHETRAN. J. Hydrol., 230, 1833.
Bordenave, P., 2001. In Pollutions Diffuses: du bassin versant au littoral. Actes de Colloques 24, Editions IFREMER, Plouzané, France, 298310.
Bouraoui, F. and Dillaha, T.A., 2000. Answers-2000: Non-point-source nutrient planning model. J. Environ. Eng.-ASCE, 126, 10451055.
Cann, C., 1990. Transfer of nutrients in a region of intensive farming. In: Hydrological Research Basins and the Environment, Proceedings and Information / TNO committee on Hydrological Research No 44, The Hague, The Netherlands. 311318. Chauvin, M., Cros-Cayot, S., Houben, V. and Plet, P., 1997.
Elaboration des programmes daction de la directive nitrate en Bretagne, Eléments de diagnostic et de préconisations. Vol. 2, Edition CRAB, Rennes, France.
Cheverry, C., 1998. Agriculture intensive et qualité des eaux. INRA Edition, 425pp.
Durand, P. and Juan Torres, J.L., 1996. Solute transfer in agricultural catchments: the interest and limits of mixing models. J. Hydrol., 181, 122.
Durand P., Gascuel-Odoux C. and Cordier M.O., 2002. Parameterisation of hydrological models: a review and lessons learned from studies of an agricultural catchment (Naizin, France). Agronomy, 22, 217228.
Eisele, M. and Leibundgut, C., 2002. Modelling nitrogen dynamics for a mesoscale catchment using a minimum information requirement (MIR) concept. Hydrolog. Sci. J., 47, 753768. Haycock, N.E., Pinay, G. and Walker, C., 1993. Nitrogen-Retention
in River Corridors - European Perspective. Ambio, 22, 340 346.
Lasserre, F., Razack, M. and Banton, O., 1999. A GIS-linked model for the assessment of nitrate contamination in groundwater. J. Hydrol., 224, 8190.
Molenat, J., Gascuel, C., Davy, P. and Durand, P., 2004. How to model shallow water-table depth variations: the case of the Kervidy-Naizin catchment, France. Hydrol. Process., in press. Nash J.E. and Sutcliffe J.V., 1970. River flow forecasting through conceptual models, 1. A discussion of principles. J. Hydrol., 10, 282290.
Ruiz, L., Abiven, S., Durand, P., Martin, C., Vertes, F. and Beaujouan, V., 2002. Effect on nitrate concentration in stream water of agricultural practices in small catchments in Brittany : I. Annual nitrogen budgets. Hydrol. Earth Syst. Sci., 6, 497 505.
Saleh, A., Arnold, J.G., Gassman, P.W., Hauck, L.M., Rosenthal, W.D., Williams, J.R. and McFarland, A.M.S., 2000. Application of swat for the Upper North Bosque River Watershed. Trans. ASAE, 43, 10771087.
Vertes, F., Loiseau, F., Laurent, F., Recous, S., Leterme, P. and Mary, B., 2002. Grassland resowing and grass-arable crop rotation in France : agricultural and environmental issues. In: Grassland resowing and grass-arable crop rotation, J.G, Conijn, G.L.Velthof and F.Taube.(Eds.), International Workshop, 18-19 avril 2002 report 47, Wageningen, The Netherlands , 4764. Wade, A.J., Durand, P., Beaujouan,V., Wessel, W.W., Raat, K.J., Whitehead, P.G., Butterfield, D., Rankinen, K. and Lepisto, A., 2002. A nitrogen model for European catchments: INCA, new model structure and equations. Hydrol. Earth Syst. Sci., 6, 559 582. (See also Errata. Hydrol. Earth Syst. Sci., 8, 858859.)