HAL Id: hal-00301712
https://hal.archives-ouvertes.fr/hal-00301712
Submitted on 22 Aug 2005HAL is a multi-disciplinary open access
archive for the deposit and dissemination of sci-entific research documents, whether they are pub-lished or not. The documents may come from teaching and research institutions in France or abroad, or from public or private research centers.
L’archive ouverte pluridisciplinaire HAL, est destinée au dépôt et à la diffusion de documents scientifiques de niveau recherche, publiés ou non, émanant des établissements d’enseignement et de recherche français ou étrangers, des laboratoires publics ou privés.
The effects of aerosols on precipitation and dimensions
of subtropical clouds; a sensitivity study using a
numerical cloud model
A. Teller, Z. Levin
To cite this version:
A. Teller, Z. Levin. The effects of aerosols on precipitation and dimensions of subtropical clouds; a sensitivity study using a numerical cloud model. Atmospheric Chemistry and Physics Discussions, European Geosciences Union, 2005, 5 (4), pp.7211-7245. �hal-00301712�
ACPD
5, 7211–7245, 2005
Effects of aerosols on precipitation and
cloud dimension A. Teller and Z. Levin
Title Page Abstract Introduction Conclusions References Tables Figures J I J I Back Close
Full Screen / Esc
Print Version
Interactive Discussion
EGU
Atmos. Chem. Phys. Discuss., 5, 7211–7245, 2005 www.atmos-chem-phys.org/acpd/5/7211/
SRef-ID: 1680-7375/acpd/2005-5-7211 European Geosciences Union
Atmospheric Chemistry and Physics Discussions
The e
ffects of aerosols on precipitation
and dimensions of subtropical clouds; a
sensitivity study using a numerical cloud
model
A. Teller and Z. Levin
Department of Geophysics and Planetary Sciences, Tel-Aviv University, Tel-Aviv, Israel Received: 11 July 2005 – Accepted: 29 July 2005 – Published: 22 August 2005 Correspondence to: Z. Levin ([email protected])
ACPD
5, 7211–7245, 2005
Effects of aerosols on precipitation and
cloud dimension A. Teller and Z. Levin
Title Page Abstract Introduction Conclusions References Tables Figures J I J I Back Close
Full Screen / Esc
Print Version
Interactive Discussion
EGU
Abstract
Numerical experiments were carried out using the Tel-Aviv University 2-D cloud model to investigate the effects of increased concentrations of Cloud Condensation Nuclei (CCN), giant CCN (GCCN) and Ice Nuclei (IN) on the development of precipitation and cloud structure in mixed-phase sub-tropical convective clouds. In order to differentiate 5
between the contribution of the aerosols and the meteorology, all simulations were conducted with the same meteorological conditions.
The results show that under the same meteorological conditions, polluted clouds (with high CCN concentrations) produce less precipitation than clean clouds (with low CCN concentrations), the initiation of precipitation is delayed and the lifetimes of the 10
clouds are longer. GCCN enhance the total precipitation on the ground in polluted clouds but they have no noticeable effect on cleaner clouds. The increased rainfall due to GCCN is mainly a result of the increased graupel mass in the cloud, but it only partially offsets the decrease in rainfall due to pollution (increased CCN). The addition of more effective IN, such as mineral dust particles, reduces the total amount 15
of precipitation on the ground. This reduction is more pronounced in clean clouds than in polluted ones.
Polluted clouds reach higher altitudes and are wider than clean clouds and both produce wider clouds (anvils) when more IN are introduced. Since under the same vertical sounding the polluted clouds produce less rain, more water vapor is left aloft 20
after the rain stops. In our simulations about 3.5 times more water evaporates after the rain stops from the polluted cloud as compared to the clean cloud. The implication is that much more water vapor is transported from lower levels to the mid troposphere under polluted conditions, something that should be considered in climate models.
ACPD
5, 7211–7245, 2005
Effects of aerosols on precipitation and
cloud dimension A. Teller and Z. Levin
Title Page Abstract Introduction Conclusions References Tables Figures J I J I Back Close
Full Screen / Esc
Print Version
Interactive Discussion
EGU
1. Introduction
The role of aerosols in modifying clouds and precipitation has been one of the most intriguing questions in cloud physics and in the study of climate change. Most publi-cations to date show that increasing Cloud Condensation Nuclei (CCN) concentrations leads to higher cloud drop concentrations (Twomey, 1959), to smaller effective radii and 5
to longer-lived clouds (Albrecht, 1989; Ramanathan et al., 2001). In spite of these and many other studies, the effects of aerosols on precipitation amounts, has been made mostly through hypothesis or through the use of numerical models.
There are only very few reported statistical valid observations that deal with the rela-tionship between the properties of the aerosol population and their effects on precipita-10
tion. Warner and Twomey (1967) studied the effects of sugar cane fires on precipitation amounts downwind. Although some changes in cloud properties were reported, the study failed to conclusively show that association could be found between cane fires and rainfall amounts (Warner, 1968). Others such as Woodcock and Jones (1970) also showed that the effect of the smoke could not explain statistically the reduction 15
of precipitation and other factors such as meteorological conditions could have been responsible for the observed changes.
More recent studies using remote sensing observations of cloud properties in regions with and without air pollution in Australia (Rosenfeld, 2000), statistical analysis of rain events in orographic conditions (Givati and Rosenfeld, 2004) and field observations 20
in cold orographic clouds (Borys et al., 2003) revealed that increased pollution from anthropogenic sources leads to a decrease in rainfall and snowfall. A recent publication by Ayers (2005) disputed the conclusions of Rosenfeld (2000) and showed that on the day analyzed by the latter, air pollution could not have affected the rainfall.
Another aspect of the cloud-aerosol system, which needs to be addressed, is the 25
potential effect of large and giant CCN from natural sources (such as sea salt and mineral dust) on clouds and precipitation.
ACPD
5, 7211–7245, 2005
Effects of aerosols on precipitation and
cloud dimension A. Teller and Z. Levin
Title Page Abstract Introduction Conclusions References Tables Figures J I J I Back Close
Full Screen / Esc
Print Version
Interactive Discussion
EGU
concentrations of large CCN into warm clouds lead to the appearance of large drops and possibly to enhanced precipitation. Mather (1991) observed the appearance of large drops in the mixed phase clouds forming above the plume of a paper mill. This led him to propose that hygroscopic seeding could be an effective way to enhance precipitation.
5
Modeling studies on the affects of large and giant CCN (GCCN) concentrations on precipitation were carried out by a number of investigators (Feingold et al., 1999; Philips et al., 2002; Yin et al., 2002; Khain et al., 2004; Khain and Pokrovsky, 2004; Levin et al., 2005). All these studies showed that increasing the CCN concentration has a suppression effect on precipitation. Some of these studies have also shown that added 10
small concentrations of GCCN cause enhancement of precipitation from stratocumulus clouds (Feingold et al., 1999) and cumulonimbus clouds (Yin et al., 2002; Levin et al., 2005).
It is apparent from the above studies that the differences in the effect of anthro-pogenic air pollution on rainfall could be related to differences in the properties of the 15
polluting particles (chemistry, concentrations and size distributions). However, other effects such as various changes in meteorological conditions could not be ruled out.
Furthermore, one more aspects that should be taken into account in evaluating the effects of aerosols on clouds is the contribution of ice nuclei (IN), such as mineral dust, in the upper regions of the clouds. Increasing the concentrations of such IN could lead 20
to rain enhancement or suppression. Rosenfeld et al. (2001) showed using remote sensing observations that dust storms containing large amounts of CCN and IN tend to reduce the effective radius of particles near cloud top and to reduce precipitation as interpreted from TRMM. Van den Heever et al. (2005)1 tested the effects of dust particles acting as both GCCN and IN on large Florida convective clouds. Using the 25
RAMS they showed that the accumulated surface precipitation from a cloud field is
ini-1
Van den Heever, S. C., Carrio, G., Cotton, W. R., DeMott, P. J. and Prenni, A. J.: Impacts of nucleating aerosol on Florida convection, Part I: Mesoscale simulations the impact of hail size on simulated supercell storms, J. Atmos. Sci., accepted, 2005.
ACPD
5, 7211–7245, 2005
Effects of aerosols on precipitation and
cloud dimension A. Teller and Z. Levin
Title Page Abstract Introduction Conclusions References Tables Figures J I J I Back Close
Full Screen / Esc
Print Version
Interactive Discussion
EGU
tially greater in the cases in which the GCCN and/or IN concentrations are enhanced than in the simulation run of a clean case. However, at the end of the simulation, the accumulated precipitation is greatest in the clean case, demonstrating the reduction in surface precipitation associated with increases in aerosol concentrations. These re-sults demonstrated the dust modified the spatial and temporal distribution of the rainfall 5
on the ground.
In addition to their effects on precipitation amounts, aerosols also influence the spa-tial dimensions of clouds, such as cloud horizontal extend (normally named cloud frac-tion as seen from space) and cloud height. Using MODIS data, Koren et al. (2005) and Kaufman et al. (2005), showed that the increases in aerosol optical depth, corre-10
sponding to increases in aerosol concentrations over the Atlantic Ocean during sum-mer months lead to increases in the height and cloud fraction of convective and stratus clouds, and to a decrease in cloud drop effective radii.
Ackerman et al. (2000) simulated the cloud cover above the Indian Ocean and found that the addition of large concentrations of absorbing aerosols such as black carbon 15
reduces cloudiness (the semi-direct effect). On the other hand, Norris (2001) studied the historical weather records in the same region and showed that cloudiness was not affected by air pollution. Furthermore, McFarquhar et al. (2004) showed that aerial coverage of polluted clouds and cloud top heights in the Indian Ocean are lower than pristine clouds.
20
The conflicting results reported in the above references illustrate that much work is still needed to clarify the affects of pollution on clouds morphology and precipitation and to identify the relative role of the aerosols versus the effects of the local meteorology.
For the purpose of isolating the microphysical effects from the influence of the mete-orology, simulations using numerical cloud models could be used.
25
Recently, Levin et al. (2005) incorporated aerosol properties that were measured in a dust storm over the eastern Mediterranean into the Tel Aviv University 2-D cloud model (Yin et al., 2000) and found that GCCN or enhanced IN concentration cause large modification in the total precipitation amounts from the cloud. They also showed that
ACPD
5, 7211–7245, 2005
Effects of aerosols on precipitation and
cloud dimension A. Teller and Z. Levin
Title Page Abstract Introduction Conclusions References Tables Figures J I J I Back Close
Full Screen / Esc
Print Version
Interactive Discussion
EGU
GCCN and IN modified the production of large droplets, graupel particles, ice crystals and of cloud dimensions (height and width).
The main objective of this paper is to expand the work of Levin et al. (2005) by using many model simulations of different scenarios with the same cloud model for analyzing the impact of pollution and mineral dust aerosols on the development of clouds and 5
precipitation in sub tropical cumulonimbus clouds, and to study their contribution to the changes in cloud height, cloud horizontal extend and cloud lifetime.
2. The TAU-2-D cloud model
For the purpose of this study we used the Tel Aviv University 2-D numerical cloud model (TAU-2-D) with detailed treatment of the cloud microphysics. This model uses 10
the Spectral Method of Moments (Tzivion et al., 1987; Reisin et al., 1998) for calculat-ing the growth of water drops and ice particles by various processes such as nucleation of water and ice, condensation, collection, riming, melting, drop breakup and sedimen-tation. The cloud is initiated with a short pulse of temperature and humidity just below cloud base. For the present study we used 300 m height and 300 m lateral resolutions 15
and a 2 s time step.
The initial conditions of the CCN vertical size distribution profiles and their chemical compositions for the Mediterranean clouds were set according to the airborne physical and chemical measurements reported by Levin et al. (2005). These measurements correspond to typical CCN size distribution profiles for the Mediterranean region during 20
winter dust storms. Using the shape of the measured CCN size distributions the sim-ulations were run with initial CCN concentrations that varied between 90 cm−3(named “clean cloud”) and 1350 cm−3 (named “polluted cloud”) on the ground. The role of GCCN in clean and polluted conditions was also considered. In this study, GCCN were defined as aerosols larger than 0.5 µm in diameter for the Mediterranean aerosol size 25
distribution.
ACPD
5, 7211–7245, 2005
Effects of aerosols on precipitation and
cloud dimension A. Teller and Z. Levin
Title Page Abstract Introduction Conclusions References Tables Figures J I J I Back Close
Full Screen / Esc
Print Version
Interactive Discussion
EGU
following the classical K ¨ohler theory (Pruppacher and Klett, 1997). The drops grow by condensation and then by collision-coalescence processes. As the cloud develops vertically, reaching subfreezing temperatures, ice crystals begin to form by the freezing of cloud drops containing efficient IN, primarily those containing mineral particles. Ice nucleation is accounted for using the parameterization of Meyers et al. (1992) in which 5
the concentration of IN in the atmosphere is proportional to the supersaturation, when dealing with deposition or condensation-freezing processes, and proportional to the supercoolling temperature when dealing with contact nucleation. Ice particles also form through ice multiplication process induced by collisions of large drops and ice particles (Hallett and Mossop, 1974). The ice crystals grow by deposition and aggregation to 10
form snow and by riming to form graupel particles. The large graupel particles and the large ice crystals eventually descend, melting on their way down to form raindrops. Large raindrops collide with other raindrops and break up to form smaller drops based on the algorithm of Reisin et al. (1998) and the distribution of Low and List (1982a, b).
For scenarios in which mineral dust particles enter the clouds we assumed that the 15
concentration of IN increases by a factor of 10 above the values given by Meyers et al. (1992). Recently, DeMott et al. (2003) measured the IN concentrations in a dust layer that was transported from Africa to Florida. They showed that between about 1.5 and 4 km altitude the IN concentrations at −38◦C were about 1 cm−3. These values were about 20 to 100 times higher than those measured at lower altitudes in a non-20
dusty environment at the same location. Note that these measurements represent all the IN that nucleate ice down to −38◦C. In the Mediterranean clouds simulated here the clouds only reached about −30◦C, therefore the expected IN concentrations would be lower. Since there is no reliable data on the IN concentration in winter Mediterranean clouds we assumed that the concentration of IN increased by a factor of 10 above the 25
clean background environmental values given by Meyers et al. (1992). This increase is used as an illustration of the potential effects of mineral dust on clouds and it could be modified if IN measurements in dust storms in this region become available.
con-ACPD
5, 7211–7245, 2005
Effects of aerosols on precipitation and
cloud dimension A. Teller and Z. Levin
Title Page Abstract Introduction Conclusions References Tables Figures J I J I Back Close
Full Screen / Esc
Print Version
Interactive Discussion
EGU
ditions. Figure 1 shows the initial CCN size distribution on the ground used for the different cases. Figures 1a and b show the initial CCN size distributions for 10 of the cases used in the Mediterranean scenario without and with GCCN, respectively. The CCN size distributions in the cases with enhanced IN were the same as those shown in these figures. The different simulations represent a wide range of CCN concentrations 5
beginning from extremely clean conditions with CCN concentrations of 90–100 cm−3to extremely polluted conditions with CCN concentrations of 1350–1370 cm−3. The initial aerosol concentrations in all the cases remain constant from the surface to 1 km and then decrease exponentially with height with a decay factor of 2000 m (the concentra-tions decreased to 1/e of their values in 2000 m).
10
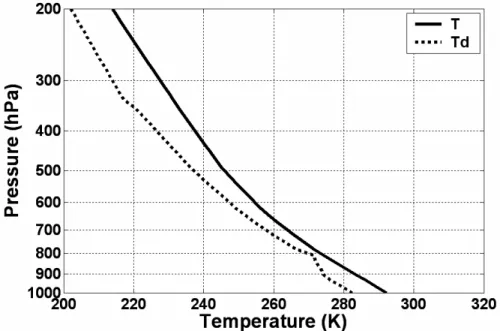
The initial thermodynamic conditions for the simulations were selected to represent average sounding conditions of winter convective clouds in the eastern Mediterranean region. The temperatures at the sea surface and at cloud base (about 1000 m) were 19◦C and 7◦C respectively. The humidity profile was similar to the profile presented by Yin et al. (2002) and is shown in Fig. 2. Wind shear was not included in the simulations 15
discussed here.
3. Results
The following discussion focuses on the effects of aerosols on four major features of clouds related to their size and precipitation production. These are: a) total precipi-tation on the ground, b) temporal evolution and spatial spreading of precipiprecipi-tation, c) 20
distribution of the hydrometeors within the cloud and d) cloud dimensions (horizontal spreading and cloud top height) as function of time and its lifetime.
3.1. The Effect of aerosols on the total precipitation on the ground
Figure 3 shows the total accumulated precipitation on the ground as a function of the initial CCN concentration for all the scenarios. Here, the total precipitation was de-25
ACPD
5, 7211–7245, 2005
Effects of aerosols on precipitation and
cloud dimension A. Teller and Z. Levin
Title Page Abstract Introduction Conclusions References Tables Figures J I J I Back Close
Full Screen / Esc
Print Version
Interactive Discussion
EGU
fined as the total amount of water (in m3) reaching the ground for the entire simulation time. The model is two-dimensional; therefore, the total precipitation was calculated assuming that the cloud has a horizontal thickness of one kilometer.
Figure 3 reveals that as CCN concentration increases, or as the clouds become more polluted, the total precipitation decreases. For the reference scenarios in which 5
no GCCN are added and IN concentrations remain as in Meyers et al (1992), the clean cloud (with total CCN concentration of 90 cm−3) produced 16 times more precipitation than the polluted cloud (1350 cm−3).
The addition of very small amounts of GCCN (here between 10–20 cm−3are added depending on the cloud type; corresponding to between about 1–10% of the back-10
ground CCN concentrations) leads, in some cases, to increases in rainfall. Figure 3 shows that GCCN increase precipitation in the polluted clouds but have no effect on the clean clouds (while actually, their relative fraction is higher in the clean clouds). In fact the effects of the GCCN are not felt in a significant way in clouds with CCN concentrations smaller than about 600 cm−3. These increases are sometimes signif-15
icant, especially in the polluted clouds, but they are small compared to the decrease in total rain when clean clouds become polluted. For example, a clean cloud with 300 CCN cm−3 reduces the total precipitation on the ground by a factor of four due to an increase in CCN to 900 cm−3. At the same time the addition of GCCN to the more polluted cloud will only enhance the rainfall by about 25%. In other words, when dealing 20
with meteorological conditions similar to those of the Mediterranean region, the effects on mixed phase clouds of pollution with or without GCCN is to decrease precipitation on the ground, while the GCCN helps to reduce this decrease somewhat.
The clouds that are developed with added IN produce ice more efficiently and deplete the cloud droplets. However, the simulation shows that under the same meteorological 25
conditions these increases lead to a reduction in total rain amounts in all clouds except the most polluted ones where the effects are negligible. These results are in agreement with Yin et al. (2000) and Reisin et al. (1998) who showed that seeding Mediterranean type clouds with artificial IN (like AgI) would lead to a reduction in rainfall.
ACPD
5, 7211–7245, 2005
Effects of aerosols on precipitation and
cloud dimension A. Teller and Z. Levin
Title Page Abstract Introduction Conclusions References Tables Figures J I J I Back Close
Full Screen / Esc
Print Version
Interactive Discussion
EGU
The above results suggest that the addition of small concentrations of GCCN, such as sea salt or mineral dust particles coated with sea salt or sulfate (Levin et al., 1996, 2005) can reduce the magnitude of this rain suppression. On the other hand, en-hancement of the IN concentration by the same mineral dust particles or by IN from anthropogenic sources suppresses the precipitation even more. We see, therefore, 5
that GCCN and IN affect most clouds in the opposite direction.
3.2. The effects of aerosols on the temporal evolution and spatial spread of precipita-tion on the ground
In addition to the effects of the CCN, GCCN and IN on the total accumulated precipita-tion, it is also instructive to look at their effects on the development of the precipitation 10
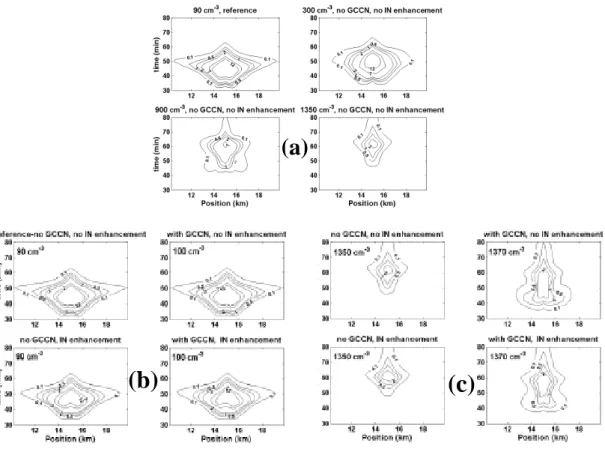
rate on the ground and its spatial spread as function of time. Figure 4 shows the max-imum precipitation rate on the ground as a function of time for the different cases and Figure 5 shows contour plots of the spatial spreading of the precipitation rate on the ground as function of time. Figure 5a shows the effect of CCN population (without GCCN and IN enhancement) and Figs. 5b and c shows the effects of added GCCN 15
and IN enhancement for the clean and the polluted clouds, respectively. From Figs. 4 and 5 it is clear that the maximum precipitation rate is reached near cloud center
Figure 4 shows that the times for the initiation of rain and the times to reach maximum precipitation rate are positively correlated to the CCN concentrations. In addition, the value of the maximum precipitation rate decreases as CCN concentrations increase. 20
Figure 5a shows the relationship between the CCN concentration and the spatial spreading of the precipitation for the reference cases in which neither GCCN nor en-hanced IN concentration were added. The results reveal that precipitation from clean clouds spreads over larger area than from the heavy polluted clouds. Similar to Fig. 4, Fig. 5a also shows that precipitation starts earlier in clean clouds, beginning from a 25
region near the main updraft, where vertical wind reaches its maximum value and then spreads toward the cloud edges. It is of great interest to note that in the cleanest cloud (with CCN concentration of 90 cm−3, see upper-left graph in Fig. 5a) the times of
max-ACPD
5, 7211–7245, 2005
Effects of aerosols on precipitation and
cloud dimension A. Teller and Z. Levin
Title Page Abstract Introduction Conclusions References Tables Figures J I J I Back Close
Full Screen / Esc
Print Version
Interactive Discussion
EGU
imum precipitation rate and maximum spreading are not identical. In a more polluted cloud these times are approximately the same. This finding shows that the time to produce large raindrops by the microphysical processes in clean cloud is shorter than the time it takes for the cloud to spread over large area. When the rain from the clean cloud reaches its maximum spreading, the precipitation rate at the cloud center is very 5
low (below 2 mm h−1). This means that at this stage most of the rain that developed at the cloud core has already reached the ground and the remaining small cloud droplets were transported closer to the cloud lateral boundaries during cloud development. The growth of the droplets at the cloud edges is limited due to the relatively low supersatu-rations and the lower concentsupersatu-rations of cloud drops. In the polluted cloud the droplets 10
that are transported to the edges are too small to produce precipitation.
Adding GCCN to the initial CCN distribution has very little effect on the maximum precipitation rate (compare Figs. 4a and b or 4c and d).
Figure 5b shows that adding GCCN to the clean clouds has no effect on the spatial spreading or on the time of precipitation initiation. On the other hand, adding GCCN to 15
the polluted cloud starts the rainfall earlier and increases the spatial spread of precipi-tation on the ground as compared to the reference case (Fig. 5c).
Comparison between Figs. 4a and c and Figs. 4b and d shows that enhancement of IN concentration reduces the maximum precipitation rate in the cleaner clouds. IN enhancement has only minor effect on reducing the spatial spread of precipitation in 20
the clean cloud (Fig. 5b) and has no effect on the spread of rainfall from polluted clouds (Fig. 5c).
3.3. The effect of aerosols on the distribution of the hydrometeors within the cloud The effects of the aerosols on the precipitation efficiency and the spatial distribution of the hydrometeors in the cloud are demonstrated by calculating the mass content of 25
each type of hydrometeor as a function of time. This is done by integrating the mass content over one dimension (horizontal or vertical) to obtain (in unit of g m−2) liquid water path (LWP), ice path (IP), and graupel path (GP) as a function of time. As will
ACPD
5, 7211–7245, 2005
Effects of aerosols on precipitation and
cloud dimension A. Teller and Z. Levin
Title Page Abstract Introduction Conclusions References Tables Figures J I J I Back Close
Full Screen / Esc
Print Version
Interactive Discussion
EGU
be shown below, these calculations will serve to estimate the mass of water vapor and aerosols transported to the mid troposphere following cloud dissipation and will be used to illustrate the effects of aerosols on cloud dimensions.
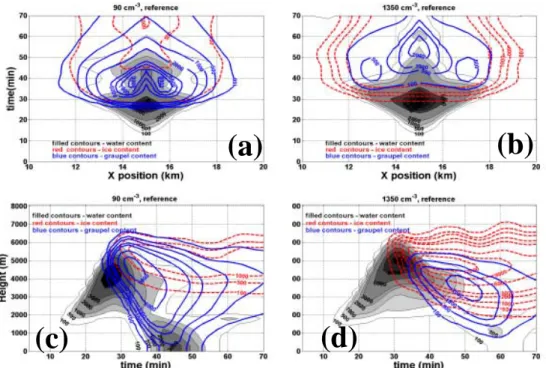
The water, ice and graupel paths of mass content (in g m−2) in the clouds as a func-tion of time, height and width are shown in Figs. 6–10. The upper two panels in each of 5
these figures represent the vertical integral of the mixing ratio of each type of hydrom-eteor as a function of time and horizontal location. The lower two panels represent the vertical distribution of the mixing ratio of the different hydrometeors integrated over the horizontal axis (units of g m−2) as a function of time.
Figures 6a and b reveal that the GP in the polluted cloud is much lower than in the 10
clean cloud. Figure 6c and d further show that the spatial spread of the graupel is much smaller, located between about 5000 m down to about 2000 m in the polluted cloud compared to spread between about 6000 m down to the surface in the clean cloud. Graupel particles first appear around 25 min and 6000 m in the clean cloud while they begin to form around 35 min and 5000 in the polluted cloud (see Figs. 6c 15
and d). The delay in the formation of the graupel particles in the polluted cloud is a result of the low freezing efficiency of the smaller cloud drops in this cloud. Since the graupel particles do not grow fast, the droplets reach higher altitudes and form more ice crystals.
As can be seen in Fig. 6, the IP is much higher in the polluted cloud and it spreads 20
over much larger vertical extend; all the way from about 7000 m down to 2000 m. In the polluted cloud as compared to the clean cloud the value of the LWP is slightly smaller, it spreads over slightly larger volume and the drops reach higher altitudes (compare Figs. 6c and d). These figures also show that the height of maximum LWP starts to descend earlier in the clean cloud (at about 28 min) as compared to 32 min and to a 25
slower descend in the polluted cloud. The above behavior is associated with the fact that the precipitation starts earlier (around 35 min) and lasts longer (it end on around 57 min) in the clean cloud. In contrast, the polluted cloud starts precipitating only after about 50 min and lasts only until about 67 min.
ACPD
5, 7211–7245, 2005
Effects of aerosols on precipitation and
cloud dimension A. Teller and Z. Levin
Title Page Abstract Introduction Conclusions References Tables Figures J I J I Back Close
Full Screen / Esc
Print Version
Interactive Discussion
EGU
Some of the precipitation in the clean cloud is formed by graupel particles (in spite of some melting, some graupel reach the ground), while in the polluted clouds the amount of rain is small and is mainly formed by raindrops. One other feature that clearly appears in Figs. 6a and b is the larger horizontal extend of the polluted cloud (about 1 to 1.5 km higher than the clean cloud) and the higher cloud top (about 0.5– 5
1 km higher than the clean cloud).
The effects of GCCN on the development of clean and polluted clouds are shown in Figs. 7 and 9, respectively. In these cases only 10 cm−3 of GCCN were added to the background CCN. As can be seen hardly any difference can be detected in the clean clouds while the effects on the polluted cloud are significant. Although larger 10
drops are produced when GCCN are present, the biggest effect is in the production of graupel particles (compare Figs. 9a and b). Once GCCN are active in the polluted cloud the graupel particles begin to form around 30 min (Fig. 9a) and at an altitude of 5500 m about 5 min earlier than in cloud with no GCCN. The larger drops formed due to the existence of the GCCN enhance the probability of freezing and increases 15
the riming efficiency; both leading to more graupel mass and enhanced precipitation on the ground (compare the contours at the lower altitudes on Figs. 9c and d). These figures also show that precipitation starts earlier and lasts much longer. The enhanced graupel production is responsible for the increase in precipitation shown in Fig. 3 (the difference between the curve with and without GCCN).
20
The effects of added IN on the clean and polluted clouds is shown in Figs. 8 and 10, respectively. Figure 8 shows that the amount of rainfall slightly decreases due to the added IN while the amount of ice crystals aloft increases. The additional IN lead to the formation of more ice crystals by depleting some of the cloud drops (note the small reduction in the LWC). The enhancement of small ice crystals in the upper parts of the 25
cloud leads to the formation of an anvil and to a large horizontal spread of the cloud mass as can be seen by comparing Figure 8a and b for times greater than 50 min.
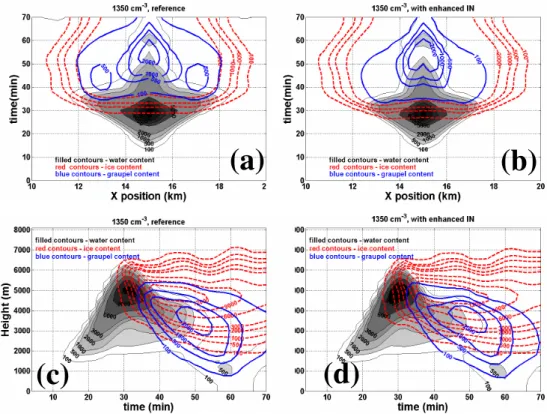
Figures 10a and b for the polluted cloud shows that the enhanced IN reduces the GP, especially at regions near its edges. Large amounts of ice crystals appear earlier in
ACPD
5, 7211–7245, 2005
Effects of aerosols on precipitation and
cloud dimension A. Teller and Z. Levin
Title Page Abstract Introduction Conclusions References Tables Figures J I J I Back Close
Full Screen / Esc
Print Version
Interactive Discussion
EGU
the cloud when IN is enhanced (25 min as in Fig. 10d compared to 30 min in Fig. 10c). On the other hand, the effect on precipitation on the ground is negligible.
Integrating the total mass in the cloud over time allows us to estimate the amount of water that can be evaporated back into the atmosphere after the rain stops. Figure 11 compares the total mass content as a function of time in the clean and polluted clouds. 5
It shows that the conversion from vapor to hydrometeors is more efficient in the clean cloud since the total hydrometeor mass reaches its maximum earlier. However, the maximum total mass in both clouds is only different by <10%, suggesting that the total mass is not strongly affected by the CCN concentrations. Of course the rate of hydrom-eteor formation of is certainly different (see Fig. 11). The CCN concentrations affect 10
the remaining mass in the cloud after the clouds stopped raining. While in the clean clouds most of the mass of the cloud disappears (mostly by rainfall), in the polluted cloud most of the mass remains above the ground. Evaporation of the drops and espe-cially melting and evaporation of the ice crystals (Fig. 6d) after cloud dissipation leads to higher aerosol concentrations and higher water vapor mass in the upper regions of 15
the troposphere. This may be significant when evaluating the effects of aerosols and water vapor on global radiative forcing.
3.4. The effects of aerosols on cloud’s dimensions and lifetime
Figure 6 shows that the horizontal extend of the polluted cloud is larger by as much as 1 km than the clean cloud. The depths of the polluted cloud are also bigger, but to a 20
much lesser extend (only about 200–500 m). Comparison between Figs. 6c and d also shows that while both clean and polluted clouds begin their growth at the same time (about 15 min from the start of the simulation), the polluted cloud lives longer, leaving more mass after precipitation stops (see also Fig. 11a). The slow rate of growth and the smaller sizes of the droplets and graupel particles in the polluted cloud explain the 25
longer lifetime of these clouds.
The addition of GCCN to the polluted cloud modifies the relative contents of water and graupel (see Figs. 9c and d after 30 min) but the effect on the cloud top height
ACPD
5, 7211–7245, 2005
Effects of aerosols on precipitation and
cloud dimension A. Teller and Z. Levin
Title Page Abstract Introduction Conclusions References Tables Figures J I J I Back Close
Full Screen / Esc
Print Version
Interactive Discussion
EGU
(considering all types of hydrometeors) is minimal. It is interesting to note that between 30–40 min most the mass at the upper regions of the polluted cloud (above 5000 m) contain water and ice while added GCCN convert some of the water to graupel. On the other hand there is no noticeable effect of GCCN on the height of the clean cloud. Figures 7 and 9 also show that adding GCCN to a polluted cloud has almost no influ-5
ence on the cloud lifetime although in polluted clouds rainfall is greater when GCCN are added.
The addition of IN to clean clouds increases the ice content near cloud top and slightly increases its height (compare Figs. 8c and d). The added ice crystals at the upper reaches of these clouds also increases cloud horizontal extend (Figs. 8a and 10
b). On the other hand, the addition of IN to the heavily polluted cloud only slightly increases cloud top height and width (see Figs. 10c and d) and does not have an effect of its lifetime (see Figs. 8 and 10).
4. Discussion
4.1. The effects of CCN concentration, GCCN and IN on rainfall 15
Figure 3 shows that under the same meteorological conditions polluted cloud precip-itate less than clean clouds. In fact, increasing the CCN concentrations from 300 to 900 cm−3 decreases the total amount of rain on the ground by a factor of about 3.7. Incorporating small numbers of GCCN in the CCN spectrum increases the total rainfall on the ground but does not compensate for the large decrease due to the increases in 20
CCN by pollution. Enhancing IN activity in the clouds simulated here reduces the total precipitation on the ground in all clouds except in the heavy polluted cases.
Furthermore, the results show that adding GCCN and enhancing IN activity not only affect the total precipitation on the ground (Fig. 3) but also modifies the precipitation rates (Fig. 4) and the spatial spread of the precipitation (Fig. 5), while influencing rela-25
ACPD
5, 7211–7245, 2005
Effects of aerosols on precipitation and
cloud dimension A. Teller and Z. Levin
Title Page Abstract Introduction Conclusions References Tables Figures J I J I Back Close
Full Screen / Esc
Print Version
Interactive Discussion
EGU
These results imply that the thermodynamic conditions determine the “potential” maximum total mass of the cloud (Fig. 11), but the distributions of water, graupel and ice hydrometeors during the cloud lifetime and the amount of precipitation are deter-mined by the cloud microphysical processes (Figs. 6–10). These processes are influ-enced by the characteristics of the CCN and the IN population that enter the cloud at 5
the beginning and during its growth.
A more careful view of the microphysical processes reveals that the insertion of small concentrations of GCCN affects differently the production of precipitation in clean and the polluted clouds. Supersaturation reaches higher values in clean clouds because the small concentrations of droplets are not sufficient to rapidly deplete the access 10
water vapor. The appearance of higher supersaturation in clean clouds, therefore, leads to faster growth by condensation of each droplet and to an earlier and faster growth by coalescence. The addition of a few (about 5–10% by number) GCCN to clean clouds does not accelerate the already rapid growth process. In the polluted clouds, on the other hand, the addition of similar concentrations of GCCN (only about 15
1.5% by number) creates a few relatively large droplets (with radii >20 µm) that grow rapidly by collecting smaller droplets. Subsequently and at higher altitudes, these large droplets are among the first to freeze and produce graupel particles (Figs. 9c and d). These different responses of the polluted and clean clouds to the addition of GCCN are seen in Fig. 3, where no effects on precipitation amounts are observed in the clean 20
clouds but significant enhancement effects are obtained in the polluted cloud.
When GCCN are missing from the CCN population, graupel production is limited because there are not many large droplets to freeze. Under these conditions high values of supersaturation with respect to ice develop and high concentrations of IN are activated. In our model, small frozen droplets become graupel particles only when their 25
radii are larger than 100 µm. Therefore, in the absence of large droplets, the riming efficiency remains low and the ice crystals remain small (as was shown by Borys et al., 2003).
ACPD
5, 7211–7245, 2005
Effects of aerosols on precipitation and
cloud dimension A. Teller and Z. Levin
Title Page Abstract Introduction Conclusions References Tables Figures J I J I Back Close
Full Screen / Esc
Print Version
Interactive Discussion
EGU
altitudes leading to an earlier formation of graupel particles (Fig. 9d). The reason more graupel particles are formed is because the larger unfrozen drops have higher riming efficiency with ice crystals. In addition, the larger drops have higher a probability to freeze.
Unlike the effects of the GCCN, increases in the IN concentrations affect differently 5
the clean and polluted clouds. In clean clouds, the large water drops produced by the few GCCN mainly contribute to the production of graupel particles. However, when more IN are present, the ice concentration increases at the expense of the water drops, which are the main source for the growth by riming. The enhancement of IN leads to lower water content, lower graupel mass loading and higher ice content (Fig. 8). In the 10
polluted clouds, enhancement of IN concentrations seems to have only a minor effect on the total precipitation. This is because high concentrations of small droplets climb to high altitudes before they become large enough to rime with ice crystals and to form graupel particles. Figure 3 summarizes this by showing that as CCN concentrations increases, the reduction in rainfall due to the enhanced IN concentration diminishes. 15
Comparison between Figure 4a and c also shows that while IN enhancement causes precipitation to start later in clean clouds, it does not have a significant effect on the polluted ones.
Similar results about the effect of CCN concentration on cloud rainfall efficiency were found in a number of numerical studies (Reisin et al., 1996, 1998; Phillips et al., 2001; 20
Khain et al., 2004; Khain and Pokrovsky, 2004) but only in relatively few observational studies (Warner and Twomey, 1967; Rosenfeld et al., 2000; Givati and Rosenfeld, 2004).
The above results also support the previous studies on the effects of GCCN on precipitation (e.g. Johnson et al., 1982; Feingold et al., 1999; Yin et al., 2002; Rosenfeld 25
et al., 2002). The results here show that inclusion of GCCN in the CCN population enhances precipitation only when CCN concentrations are high. These results suggest that large aerosols that can act as CCN such as sea salt and mineral dust coated with soluble material may have a positive effect only in highly polluted regions. Although the
ACPD
5, 7211–7245, 2005
Effects of aerosols on precipitation and
cloud dimension A. Teller and Z. Levin
Title Page Abstract Introduction Conclusions References Tables Figures J I J I Back Close
Full Screen / Esc
Print Version
Interactive Discussion
EGU
absolute amounts of rain from such polluted clouds are low, the relative increases due to the effects of GCCN could be high.
From the discussion above it becomes clear that in terms of total rainfall on the ground, increasing the concentrations of both GCCN and IN seem to have opposing effects. GCCN tend to increase precipitation, primarily in the polluted clouds, while 5
added IN decreases precipitation amounts, but mainly in the clean clouds. 4.2. The effects on cloud dimensions and lifetime
The results of the simulations also shed light on the role of aerosols in modifying the cloud dimensions and lifetime. These features have received much attention recently due to their effect on the earth radiation budget as characterized by the various global 10
aerosols indirect effects (e.g. Lohman and Feichter, 2005).
Figure 6 demonstrates that clouds that polluted clouds climb to higher altitudes than clean clouds. The initial CCN concentrations affect the size and types of hydrometeors that reach the cold regions of the cloud and thus may change cloud top height and width. Figures 6a and b show that the largest spreading of the cloud occurs at the 15
upper regions (where graupel and ice are present). In the polluted clouds many small droplets reach the higher levels with sizes that are insufficient to fall down against the updrafts. Because of their small size these droplets have low riming efficiencies with existing graupel or ice particles, thus preventing the latter from growing. At the same time, these small droplets can form ice crystals by immersion or by contact freezing 20
and increase the ice crystal concentrations in the upper reaches of the cloud (Fig. 6d). When the cloud stops precipitating these crystals simply evaporate releasing water va-por and aerosols to the upper regions of the troposphere. From Figure 11a one can surmise that about 3.5 times higher cloud mass is left behind in the mid troposphere af-ter precipitation stops from a polluted cloud than from a clean one (while the differences 25
between the maximum masses of the polluted and clean clouds during their growth are only about 10%). This water mass usually evaporates and modifies the vertical profile of humidity. In other words, polluted clouds are efficient vehicle for transporting water
ACPD
5, 7211–7245, 2005
Effects of aerosols on precipitation and
cloud dimension A. Teller and Z. Levin
Title Page Abstract Introduction Conclusions References Tables Figures J I J I Back Close
Full Screen / Esc
Print Version
Interactive Discussion
EGU
vapor from lower levels to the mid and upper troposphere.
The presence of GCCN increases the drop size of a few drops and accelerates their growth. This leads to an increase in the mass loading of drops and graupel. However, since the number of such large particles is relatively small, the effect on cloud top height is very small. IN enhancement in polluted clouds, on the other hand, reduces 5
the rate of graupel production but increases the ice mass in the upper parts of the cloud. These opposite tendencies account for the similar dimensions of the heavy polluted cloud (1350 cm−3) with or without enhanced IN.
5. Summary and conclusions
The Tel Aviv University 2-D cloud model was used to describe the links between aerosol 10
concentration, cloud growth processes and precipitation. It is shown that under the same meteorological conditions different aerosol populations can significantly modify total precipitation, cloud coverage and cloud life-time by affecting only the cloud micro-physical processes.
In order to separate the influence of meteorology from those of the aerosol-cloud mi-15
crophysical effects, a single atmospheric thermodynamic profile was used in all the dif-ferent scenarios. This profile represents typical winter conditions in the Mediterranean region.
The most important findings are the following:
– Under the same meteorological conditions, polluted cloud produce less
precipita-20
tion, the initiation of precipitation is delayed and the lifetime of the cloud is longer.
– A reduction by a factor of about 3.7 in total rain amounts on the ground is seen by
increasing CCN concentrations from 300 to 900 cm−3.
– GCCN enhances the total precipitation on the ground in polluted (or continental
with CCN concentrations >600 cm−3) clouds but it has no noticeable effect on 25
ACPD
5, 7211–7245, 2005
Effects of aerosols on precipitation and
cloud dimension A. Teller and Z. Levin
Title Page Abstract Introduction Conclusions References Tables Figures J I J I Back Close
Full Screen / Esc
Print Version
Interactive Discussion
EGU
– The increased rainfall due to GCCN is mainly due to the increase in the amount
of graupel in the cloud.
– The increase in rainfall due to GCCN is small in comparison to the decrease in
precipitation due to pollution.
– Adding more effective and high concentrations of IN (such as dust particles)
re-5
duces the total amount of precipitation on the ground. This reduction is more pronounced in clean clouds than in polluted ones.
– Polluted clouds and those affected by higher concentrations of IN lead to wider
clouds (anvils). This could explain the satellite observation of higher cloud fraction under high aerosol content.
10
– Polluted clouds have higher cloud tops than clean clouds.
– Since much of the cloud mass near cloud tops evaporates after the cloud stops
raining, more water vapor is released into the mid troposphere from polluted clouds than from clean ones. Using the model simulations we obtained a value of about 3.5 for the ratio of the amount of cloud mass that evaporates from a polluted 15
cloud to a clean one. This means that much water vapor is transported from lower levels to the mid troposphere under polluted conditions.
Since the results have implications for climate study and for water resources, it should be expanded to include tropical and fair weather clouds.
Acknowledgements. Part of this work was carried out while Z. Levin was on sabbatical at NASA 20
Goddard Space Flight Center under the UMBC-NASA GEST program. The authors thank Y. Kaufman, L. Remer and I. Koren from NASA Goddard for many constructive discussions about interpretation of aerosol-cloud interactions from model simulations and remote sensing measurements.
ACPD
5, 7211–7245, 2005
Effects of aerosols on precipitation and
cloud dimension A. Teller and Z. Levin
Title Page Abstract Introduction Conclusions References Tables Figures J I J I Back Close
Full Screen / Esc
Print Version
Interactive Discussion
EGU
References
Ackerman, A. S., Toon, O. B., Stevens, D. E., Heymsfield, A. J., Ramanathan, V., and Welton, E. J.: Reduction of tropical cloudiness by soot, Science, 288, 1042–1047, 2000.
Albrecht, B.: Aerosols, cloud microphysics, and fractional cloudiness, Science, 245, 1227– 1230, 1989.
5
Ayers, G. P.: Air pollution and climate change: has air pollution suppressed rainfall over Aus-tralia?, Towards a new agenda: 17th International Clean Air & Environment Conference proceedings, Hobart, Australia, 2005.
Borys, R. D., Lowenthal, D. H., Cohn, S. A., and Brown, W. O. J.: Mountaintop and radar measurements of anthropogenic aerosol effects on snow growth and snowfall rate, Geophys.
10
Res. Lett., 30(10), 1538, doi:10.1029/2002GL016855, 2003.
DeMott, P. J., Sassen, K., Poellet, M. R., Baumgardner, D., Rogers, D. C., Brooks, S. D., Prenni, A. J., and Kreidenweis, S. M.: African dust aerosols as atmospheric ice nuclei, Geophys. Res. Lett. 30 (14), 1732, doi:10.1029/2003GL017410, 2003.
Feingold, G., Cotton, W. R., Kreidenweis, S. M., and Davis, J. T.: Impact of giant Cloud
Conden-15
sation Nuclei on drizzle formation in marine stratocumulus: Implications for cloud radiative properties, J. Atmos. Sci., 56, 4100–4117, 1999.
Givati, A. and Rosenfeld, D.: Quantifying precipitation suppression due to air pollution, J. App. Meteor., 43, 1038–1056, 2004.
Hallett, J. and Mossop, S. C.: Production of secondary ice crystals during the riming process,
20
Nature, 249, 26–28, 1974.
Hindman II, E. E., Hobbs, P. V., and Radke, L. F.: Cloud Condensation Nuclei from a paper mill. Part I: Measured effect on clouds, J. Appl. Meteor., 16, 745–752, 1977a.
Hindman II, E. E., Tag, P. M., Silverman, B. A., and Hobbs, P. V.: Cloud Condensation Nuclei from a paper mill, Part II: Calculated effects on rainfall, J. Appl. Meteor., 16, 753–755, 1977b.
25
Hobbs, P. V., Radke, L. F., and Shumway, S. E.: Cloud Condensation Nuclei from industrial sources and their apparent influence on precipitation in Washington state, J. Atmos. Sci., 27 (1), 81–89, 1970.
Johnson, D. B.: The role of giant and ultragiant aerosol particles in warm rain initiation, J. Atmos. Sci., 39, 448–460, 1982.
30
Kaufman, Y. J., Koren, I., Remer, L. A., Rosenfeld, D., and Rudich, Y.: The Effect of smoke, dust and pollution aerosol on shallow cloud development over the Atlantic Ocean, Proc. Natl.
ACPD
5, 7211–7245, 2005
Effects of aerosols on precipitation and
cloud dimension A. Teller and Z. Levin
Title Page Abstract Introduction Conclusions References Tables Figures J I J I Back Close
Full Screen / Esc
Print Version
Interactive Discussion
EGU
Acad. Soc. USA, 102, 32, 11 207–11 212, 2005.
Khain, A., Pokrovsky, A., Pinsky, M., Seifert, A., and Phillips, V.: Simulation of effects of atmo-spheric aerosols on deep turbulent convective clouds using a spectral micro-physics mixed-phase cumulus cloud model. Part 1: model description and possible applications, J. Atmos. Sci., 61, 2963–2982, 2004.
5
Khain, A. and Pokrovsky, A.: Simulation of effects of atmospheric aerosols on deep turbulent convective clouds using a spectral micro-physics mixed-phase cumulus cloud model, Part 2: sensitivity study, J. Atmos. Sci., 61, 2983–3001, 2004.
Koren, I., Kaufman, Y. J., Rosenfeld, D., Remer, L. A., and Rudich Y.: Aerosol invigoration and restructuring of Atlantic convective clouds, Geophys. Res. Lett., in press, 2005.
10
Levin, Z., Ganor, E., and Gladstein, V.: The effects of desert particles coated with sulfate on rain formation in the eastern Mediterranean, J. Appl. Meteor., 35, 1511–1523, 1996.
Levin, Z., Teller, A., Ganor, E., and Yin, Y.: On the interactions of mineral dust, sea salt particles and clouds – Measurements and modeling study from the MEIDEX campaign, J. Geophys. Res, in press, 2005.
15
Lohmann, U. and Feichter, J.: Global indirect aerosol effects: A review, Atmos. Chem. Phys., 5, 715–737, 2005,
SRef-ID: 1680-7324/acp/2005-5-715.
Low, T. B. and List, R.: Collision coalescence and breakup of raindrops: Part I. Experimentally established coalescence efficiencies and fragments size distribution in breakup, J. Atmos.
20
Sci. 39, 1591–1606, 1982a.
Low, T. B., and List, R.: Collision coalescence and breakup of raindrops: Part II, Parameteriza-tion of fragment size distribuParameteriza-tions in breakup, J. Atmos. Sci. 39, 1607–1618, 1982b.
Mather, G. K.: Coalescence enhancement in large multicell storms caused by the emissions from a kraft paper mill, J. Appl. Meteor., 30, 1134–1146, 1991.
25
McFarquhar, G. M., Platnick, S., Di Girolamo, L., Wang, H., Wind, G., and Zhao, G.: Trade wind cumuli statistics in clean and polluted air over the Indian Ocean from in situ and re-mote sensing measurements, Geophy. Res. Lett., 31, L21105, doi:10.1029/2004GL020412, 2004.
Meyers, M. P., DeMott, P. J., and Cotton, W. R.: New primary ice-nucleation parameterizations
30
in an explicit cloud model, J. Appl. Meteor., 31, 708–721, 1992.
Norris, J. R.: Has Northern Indian Ocean cloud cover changed due to increasing anthropogenic aerosol?, Geophys. Res. Lett., 28, 3271–3274, 2001.
ACPD
5, 7211–7245, 2005
Effects of aerosols on precipitation and
cloud dimension A. Teller and Z. Levin
Title Page Abstract Introduction Conclusions References Tables Figures J I J I Back Close
Full Screen / Esc
Print Version
Interactive Discussion
EGU
Phillips, V. T. J., Choularton, T. W., Blyth, A. M., and Latham, J.: The influence of aerosol concentrations on the glaciation and precipitation of a cumulus cloud, Quart. J. Roy. Meteor. Soc., 128, 951–971, 2002.
Pruppacher, H. R. and Klett, J. D.: Microphysics of clouds and precipitation, Kluwer Acad., 1954, 1997.
5
Ramanathan, V., Crutzen, P. J., Kiehl, J. T., and Rosenfeld, D.: Aerosols, climate and the hydrological cycle, Science, 294, 2119–2124, 2001.
Reisin, T. G., Levin, Z., and Tzivion, S.: Rain production in convective clouds as simulated in an axisymmetric model with detailed microphysics. Part II: Effects of varying drops and ice initiation, J. Atmos. Sci., 53, 1815–1837, 1996.
10
Reisin, T. G., Yin, Y., Levin, Z., and Tzivion, S.: Development of giant drops and high reflec-tivity cores in Hawaiian clouds: Numerical simulation using a kinematic model with detailed microphysics, Atmos. Res., 45, 275–297, 1998.
Rosenfeld, D.: Suppression of rain and snow by urban and industrial air pollution, Science, 287 (5459), 1793–1796, 2000.
15
Rosenfeld, D., Rudich, Y., and Lahav, R.: Desert dust suppressing precipitation: A possible desertification feedback loop, Proc. Natl. Acad. Sci. USA, 98, 5975–5980, 2001.
Rosenfeld D., Lahav, R., Khain, A., and Pinsky, M.: The role of sea-spray in cleansing air pollution over ocean via cloud processes, Science, 297, 1667–1670, 2002.
Twomey, S. A.: The nuclei of natural cloud formation, Part II: The supersaturation in natural
20
clouds and the variation of cloud droplet concentrations, Geofis. Pura. Appl., 43, 243–249, 1959.
Tzivion, S., Feingold, G., and Levin, Z.: An efficient numerical solution to the stochastic collec-tion equacollec-tion, J. Atmos. Sci., 44, 3139–3149, 1987.
Warner, J.: A reduction in rainfall associated with smoke from sugar-cane fires – An inadvertent
25
weather modification?, J. Appl. Meteor., 7, 247–251, 1968.
Warner, J., and Twomey, S.: The production of Cloud Nuclei by cane fires and the effects on cloud droplet concentration, J. Atmos. Sci., 24, 704–706, 1967.
Woodcock, A. H. and Jones, R. H.: Rainfall trends in Hawaii, J. App. Meteor., 9, 690–696, 1970.
30
Yin, Y., Levin, Z., Reisin, T. G., and Tzivion, S.: The effect of giant cloud condensation nuclei on the development of precipitation in convective clouds - A numerical study, Atmos. Res., 53, 91–116, 2000.
ACPD
5, 7211–7245, 2005
Effects of aerosols on precipitation and
cloud dimension A. Teller and Z. Levin
Title Page Abstract Introduction Conclusions References Tables Figures J I J I Back Close
Full Screen / Esc
Print Version
Interactive Discussion
EGU
Yin, Y., Wurzler, S., Levin, Z., Reisin, T. G., and Tzivion, S.: Interactions of mineral dust particles and clouds: Effects on precipitation and cloud optical properties, J. Geophys. Res., 107, doi:10.1029/2001JD001544, 2002.
ACPD
5, 7211–7245, 2005
Effects of aerosols on precipitation and
cloud dimension A. Teller and Z. Levin
Title Page Abstract Introduction Conclusions References Tables Figures J I J I Back Close
Full Screen / Esc
Print Version Interactive Discussion EGU 23 (a) (b)
Figure 1 - Initial aerosol size distributions used in TAU-2D cloud model, (a) corresponds to cases in
(a)
23
(a)
(b)
Figure 1 - Initial aerosol size distributions used in TAU-2D cloud model, (a) corresponds to cases in which GCCN are not inserted, (b) corresponds cases in which GCCN are present.
(b)
Fig. 1. Initial aerosol size distributions used in TAU-2-D cloud model, (a) corresponds to cases
in which GCCN are not present,(b) corresponds to cases in which GCCN are inserted.
ACPD
5, 7211–7245, 2005
Effects of aerosols on precipitation and
cloud dimension A. Teller and Z. Levin
Title Page Abstract Introduction Conclusions References Tables Figures J I J I Back Close
Full Screen / Esc
Print Version
Interactive Discussion
EGU
24
ACPD
5, 7211–7245, 2005
Effects of aerosols on precipitation and
cloud dimension A. Teller and Z. Levin
Title Page Abstract Introduction Conclusions References Tables Figures J I J I Back Close
Full Screen / Esc
Print Version
Interactive Discussion
EGU
25
Figure 3 – Total precipitation on the ground produced by each case. Total precipitation was calculated by assuming cloud thickness of 1 km.
Fig. 3. Total precipitation on the ground produced by each case. Total precipitation was
ACPD
5, 7211–7245, 2005
Effects of aerosols on precipitation and
cloud dimension A. Teller and Z. Levin
Title Page Abstract Introduction Conclusions References Tables Figures J I J I Back Close
Full Screen / Esc
Print Version Interactive Discussion EGU 26 (a) (b) (c) (d)
Figure 4 – Precipitation rate as function of time for the entire cases. (a) corresponds to cases in which GCCN are not present and IN concentration is not enhanced, (b) corresponds to cases in which GCCN are added and IN concentration is not enhanced, (c) corresponds to cases in which GCCN are not present and IN concentration is enhanced, (d) corresponds to cases in which GCCN added and IN concentration is enhanced.
(a) (b)
26
(a) (b)
(c) (d)
Figure 4 – Precipitation rate as function of time for the entire cases. (a) corresponds to cases in which GCCN are not present and IN concentration is not enhanced, (b) corresponds to cases in which GCCN are added and IN concentration is not enhanced, (c) corresponds to cases in which GCCN are not present and IN concentration is enhanced, (d) corresponds to cases in which GCCN added and IN concentration is enhanced.
(c) (d)
Fig. 4. Precipitation rate as function of time for the entire cases. (a) corresponds to cases in
which GCCN are not present and IN concentration is not enhanced,(b) corresponds to cases
in which GCCN are added and IN concentration is not enhanced,(c) corresponds to cases in
which GCCN are not present and IN concentration is enhanced,(d) corresponds to cases in
ACPD
5, 7211–7245, 2005
Effects of aerosols on precipitation and
cloud dimension A. Teller and Z. Levin
Title Page Abstract Introduction Conclusions References Tables Figures J I J I Back Close
Full Screen / Esc
Print Version
Interactive Discussion
EGU
27
Figure 5 - Precipitation rate on the ground as function of time. (a) effect of CCN concentration when no GCCN are present and no IN enhancement, (b) Clean cloud (CCN concentration – 90–100 cm-3), (c) Polluted cloud (CCN concentration – 1350–1370 cm-3).
(a)
(b)
(c)
27
Figure 5 - Precipitation rate on the ground as function of time. (a) effect of CCN concentration when no GCCN are present and no IN enhancement, (b) Clean cloud (CCN concentration – 90–100 cm-3), (c) Polluted cloud (CCN concentration – 1350–1370 cm-3).
(a)
(b)
(c)
27
Figure 5 - Precipitation rate on the ground as function of time. (a) effect of CCN concentration when no GCCN are present and no IN enhancement, (b) Clean cloud (CCN concentration – 90–100 cm-3), (c) Polluted cloud (CCN concentration – 1350–1370 cm-3).
(a)
(b)
(c)
Fig. 5. Precipitation rate on the ground as function of time. (a) Effects of CCN concentration
when no GCCN are present and IN are not enhanced,(b) Clean cloud (CCN concentration –
90–100 cm−3),(c) Polluted cloud (CCN concentration – 1350–1370 cm−3).
ACPD
5, 7211–7245, 2005
Effects of aerosols on precipitation and
cloud dimension A. Teller and Z. Levin
Title Page Abstract Introduction Conclusions References Tables Figures J I J I Back Close
Full Screen / Esc
Print Version
Interactive Discussion
EGU
28
Figure 6 - Water, ice and graupel paths of mass content (in g m-2) in the clouds as a function of time, height and width. no GCCN were added and IN concentration are not enhanced. (a) and (b) - Vertical integral of the mixing ratio of each type of hydrometeor as a function of time and horizontal location for the clean cloud and the polluted cloud respectively. (c) and (d) - Vertical distribution of the mixing ratio of the different hydrometeors integrated over the horizontal axis (g m-2) as a function of time for the clean and the polluted clouds respectively.
(b)
(a)
(b)
(c)
(d)
Fig. 6. Water, ice and graupel paths of mass content (in g m−2) in the clouds as a function of time, height and width. no GCCN were added and IN concentration are not enhanced.(a) and (b) – Vertical integral of the mixing ratio of each type of hydrometeor as a function of time and
horizontal location for the clean cloud and the polluted cloud respectively.(c) and (d) – Vertical
distribution of the mixing ratio of the different hydrometeors integrated over the horizontal axis (g m−2) as a function of time for the clean and the polluted clouds respectively.
ACPD
5, 7211–7245, 2005
Effects of aerosols on precipitation and
cloud dimension A. Teller and Z. Levin
Title Page Abstract Introduction Conclusions References Tables Figures J I J I Back Close
Full Screen / Esc
Print Version
Interactive Discussion
EGU
30
Figure 7 - Water, ice and graupel paths of mass content (in g m-2) in the clean clouds as a function of
time, height and width. (a) and (b) - Vertical integral of the mixing ratio of each type of hydrometeor as a function of time and horizontal location for clouds without and with GCCN respectively. (c) and (d) - Vertical distribution of the mixing ratio of the different hydrometeors integrated over the horizontal axis (g m-2) as a function of time for the clouds without and with
GCCN respectively.
(b)
(d)
(a)
(b)
(c)
(d)
Fig. 7. Water, ice and graupel paths of mass content (in g m−2) in the clean clouds as a function of time, height and width.(a) and (b) – Vertical integral of the mixing ratio of each type
of hydrometeor as a function of time and horizontal location for clouds without and with GCCN respectively. (c) and (d) – Vertical distribution of the mixing ratio of the different hydrometeors
integrated over the horizontal axis (g m−2) as a function of time for the clouds without and with GCCN respectively.
ACPD
5, 7211–7245, 2005
Effects of aerosols on precipitation and
cloud dimension A. Teller and Z. Levin
Title Page Abstract Introduction Conclusions References Tables Figures J I J I Back Close
Full Screen / Esc
Print Version
Interactive Discussion
EGU
31
Figure 8 - Water, ice and graupel paths of mass content (in g m-2) in the clean clouds as a function of
time, height and width. (a) and (b) - Vertical integral of the mixing ratio of each type of hydrometeor as a function of time and horizontal location for clouds without and with IN enhancement respectively. (c) and (d) - Vertical distribution of the mixing ratio of the different hydrometeors integrated over the horizontal axis (g m-2) as a function of time for the clouds without
and with IN enhancement respectively.
(a)
(b)
(c)
(d)
Fig. 8. Water, ice and graupel paths of mass content (in g m−2) in the clean clouds as a function of time, height and width. (a) and (b) – Vertical integral of the mixing ratio of each
type of hydrometeor as a function of time and horizontal location for clouds without and with IN enhancement respectively. (c) and (d) – Vertical distribution of the mixing ratio of the different
hydrometeors integrated over the horizontal axis (g m−2) as a function of time for the clouds without and with IN enhancement respectively.
ACPD
5, 7211–7245, 2005
Effects of aerosols on precipitation and
cloud dimension A. Teller and Z. Levin
Title Page Abstract Introduction Conclusions References Tables Figures J I J I Back Close
Full Screen / Esc
Print Version
Interactive Discussion
EGU
32
Figure 9 - Water, ice and graupel paths of mass content (in g m-2) in the polluted clouds as a function
of time, height and width. (a) and (b) - Vertical integral of the mixing ratio of each type of hydrometeor as a function of time and horizontal location for clouds without and with GCCN respectively. (c) and (d) - Vertical distribution of the mixing ratio of the different hydrometeors integrated over the horizontal axis (g m-2) as a function of time for the clouds without and with
(b)
(d)
(a)
(b)
(c)
(d)
Fig. 9. Water, ice and graupel paths of mass content (in g m−2) in the polluted clouds as a function of time, height and width.(a) and (b) – Vertical integral of the mixing ratio of each type
of hydrometeor as a function of time and horizontal location for clouds without and with GCCN respectively. (c) and (d) – Vertical distribution of the mixing ratio of the different hydrometeors
integrated over the horizontal axis (g m−2) as a function of time for the clouds without and with GCCN respectively.
ACPD
5, 7211–7245, 2005
Effects of aerosols on precipitation and
cloud dimension A. Teller and Z. Levin
Title Page Abstract Introduction Conclusions References Tables Figures J I J I Back Close
Full Screen / Esc
Print Version
Interactive Discussion
EGU
33
Figure 10 - Water, ice and graupel paths of mass content (in g m-2) in the polluted clouds as a
function of time, height and width. (a) and (b) - Vertical integral of the mixing ratio of each type of hydrometeor as a function of time and horizontal location for clouds without and with IN enhancement respectively. (c) and (d) - Vertical distribution of the mixing ratio of the different hydrometeors integrated over the horizontal axis (g m-2) as a function of time for the clouds without
and with IN enhancement respectively.
(a)
(c)
(d)
(b)
Fig. 10. Water, ice and graupel paths of mass content (in g m−2) in the polluted clouds as a function of time, height and width. (a) and (b) – Vertical integral of the mixing ratio of each
type of hydrometeor as a function of time and horizontal location for clouds without and with IN enhancement respectively.(c) – and (d) – Vertical distribution of the mixing ratio of the different
hydrometeors integrated over the horizontal axis (g m−2) as a function of time for the clouds without and with IN enhancement respectively.
ACPD
5, 7211–7245, 2005
Effects of aerosols on precipitation and
cloud dimension A. Teller and Z. Levin
Title Page Abstract Introduction Conclusions References Tables Figures J I J I Back Close
Full Screen / Esc
Print Version
Interactive Discussion
EGU
34
Figure 11 - The effect of CCN concentration on the total mass of water, ice and graupel as a function of time.
Fig. 11. The effect of CCN concentration on the total mass of water, ice and, graupels as a