ORIGINAL PAPER
Inhibition of bacterial degradation of EtG by collection
as dried urine spots (DUS)
Ana Hernández Redondo&Christiane Körber& Stefan König&Andreas Längin&Ali Al-Ahmad& Wolfgang Weinmann
Received: 22 September 2011 / Revised: 20 December 2011 / Accepted: 20 December 2011 / Published online: 17 January 2012 # Springer-Verlag 2012
Abstract Ethyl glucuronide (EtG) and ethyl sulfate (EtS) are direct alcohol consumption markers widely used nowa-days for clinical and forensic applications. They are detecta-ble in blood and urine even after consumption of trace amounts of ethanol and for a longer time frame, being detectable even when no more ethanol is present. The insta-bility of EtG against bacterial degradation in contaminated urine samples and/or the possible postcollection synthesis of this metabolite in samples containing, e.g., Escherichia coli and ethanol, may cause false identification of alcohol up-take. Therefore, it is of paramount importance to constrict these error sources by inhibition of any bacterial growth causing hydrolization or synthesis of EtG. This study eva-luates a new method of collecting urine samples on filter paper, dried urine spots (DUS), for simultaneous detection of EtG, EtS and creatinine, having the great advantage of inhibiting bacterial activity. In addition, a method validation for the determination of EtG and EtS in DUS was performed according to the FDA guidelines. Sterile-filtered urine was spiked with EtG and EtS, inoculated with E. coli and incu-bated. Liquid and dried urine samples were collected after various time intervals up to 96 h. Liquid samples were frozen immediately after collection, whereas aliquots for
DUS were pipetted onto filter paper, allowed to dry and stored at RT until analysis 1 week after. The specimens were analyzed by LC–ESI–MS/MS. As expected, degradation of EtG, but not of EtS, was observed in contaminated liquid urine samples. However, the specimens collected on filter paper and stored at RT showed no degradation during stor-age. Therefore, collecting urine samples on filter paper for EtG and EtS analysis turns out to be a reliable method to avoid bacterial degradation of EtG and EtS, and consequent-ly, stabilization of these ethanol metabolites is achieved. In addition, simultaneous measurement of creatinine content as an indicator of urine dilution helps to interpret the results. Method validation for EtG and EtS in DUS was satisfactory, showing the linearity of the calibration curves in the studied concentration range, good precision, accuracy and selectivity.
Keywords Ethyl glucuronide (EtG) . Ethyl sulfate (EtS) . Bacterial degradation . Dried urine spot (DUS) . Creatinine . LC–ESI–MS/MS
Introduction
The body has different ways to inactivate and excrete exo-genous substances such as alcohol. Most of the consumed ethanol is oxidized by alcohol dehydrogenase (ADH) to acetaldehyde and by aldehyde dehydrogenase (ALDH) to acetic acid in a phase I metabolism [1, 2]. The two-stage oxidation represents a fast elimination step in the liver, so the time gap to detect ethanol in breath, blood or urine is limited to a short period of time, variable depending on the consumed amount of alcohol [3, 4]. For abstinence moni-toring, the focus on more sensitive biomarkers with a longer detection window has increased over the years [5].
A. Hernández Redondo (*)
:
C. Körber:
S. König:
A. Längin:
W. Weinmann
Institute of Forensic Medicine, Faculty of Medicine, University of Bern,
Bühlstrasse 20, Bern 3012, Switzerland
e-mail: ana.hernandez@irm.unibe.ch A. Al-Ahmad
Department of Operative Dentistry and Periodontology, University Medical Centre Freiburg,
Hugstetterstrasse 55, 79106 Freiburg, Germany DOI 10.1007/s00216-011-5687-7
The most important biological markers for abstinence control with urine samples are ethyl glucuronide (EtG) [6,7] and ethyl sulfate (EtS) [8,9]. EtG and EtS are formed shortly after starting the consumption of ethanol by a nonoxidative elimination pathway, catalyzed by uridine diphosphate-glucuronosyltransferase [10] or sulfotransferase [11], respec-tively, being less than 0.1% of the ethanol intake excreted through this phase II metabolism [4]. Already after the con-sumption of very small amounts of alcohol, EtG and EtS are detectable in blood and urine [12,13] and are still present after the ethanol has been eliminated [3,14]. The detection window of these biomarkers is dose- and individual-dependent [15,16] and ranges between 1 to 3 days after alcohol uptake, covering the time gap between short-term (e.g., ethanol) and long-term alcohol markers (e.g., GGT, CDT) [17]. Analysis of EtG and EtS is, therefore, a well-suited method for detection of recent alcohol consumption, being widely utilized in alcohol absti-nence programs, in workplace alcohol testing or as proof of alcohol uptake by court [18,19].
However, the risk of the presence of bacteria in urine that might hydrolyze or synthesize EtG and cause false identifi-cation of alcohol consumption detracts from the credibility of the method. As reported in the literature [20,21], bacteria present in urine samples due to urinary tract infections (UTI) or contamination during sampling may cause degradation of EtG leading, thus, to lower EtG concentrations or even to false-negative results. In addition, it has also been observed that EtG can be formed in a biological specimen after collection, if it is infected with Escherichia coli (bacteria containingβ-glucuronidase activity) and ethanol is present or produced during storage [22]. Although refrigeration or freezing of samples and the use of different preservatives are effective in preventing or reducing hydrolysis and/or syn-thesis of EtG [23], it is common that many urine samples for EtG and EtS determination are transported at ambient tem-peratures before analysis and the use of preservatives is not an extended use due to economic and safety reasons (addi-tives might disturb analysis of other compounds).
So far, no decomposition or postsampling formation of EtS by bacteria has been observed [20–22]. This stability and the similar detection window and sensitivity of EtS with respect to EtG [9] have made the simultaneous analysis of these two biomarkers recommendable in order to avoid undetected alcohol use or to distinguish ante mortem inges-tion of ethanol from postmortem synthesis in forensic tox-icological analysis [22].
Recently, the detection of different alcohol markers such as EtG and phosphatidyl ethanol (PEth) on dried blood and dried blood spots (DBS), respectively, have been reported [24–26]. DBS is an established method in neonatal meta-bolic screening and has also found acceptance in therapeutic drug monitoring [27]. The ease and rapid collection of a sample without specific handling and storage requirements
are the main characteristics of this sampling technique. Besides, specimens can be shipped in sealed envelopes with desiccant packs without the need of special biohazard arrangements, resulting in a cost-effective and simple sam-pling method [28]. It is well-known that analytes in DBS are less prone to hydrolysis due to the absence of water mole-cules [29, 30]. In general, analytes studied in DBS are reported to be fairly stable [27]. However, the use of dried urine spots (DUS) has not yet been studied for the analysis of drugs.
The aim of the present study was to investigate if collection of urine samples on filter paper is a feasible method for detection and quantification of EtG and EtS and if this sam-pling method stabilized EtG against bacterial activity. This was achieved by analyzing urine spiked with E. coli in the form of DUSs after storage for up to 7 days. The respective liquid urine samples were analyzed for comparison.
In addition, a method validation for the determination of EtG and EtS in DUS was performed according to the FDA guidelines [31]. Method validation included the evaluation of linearity, accuracy and precision, selectivity, dilution of concentrated sample, recovery and stability.
Experimental
Chemicals and materials
EtG and pentadeuterated EtG (D5-EtG) were obtained from
Lipomed (Arlesheim, Switzerland). Sodium EtS was pur-chased from ABCR (Karlsruhe, Germany). Deuterated EtS (D5-EtS) was synthesized by an in-house procedure with a
purity of >99.9%. Creatinine and trideuterated creatinine were purchased from Fluka Sigma Aldrich (Buchs, Switzerland). Acetonitrile supragradient grade was obtained from Biosolve (Chemie Brunschwig, Basel, Switzerland) and HPLC-grade water was produced in-house with a Milli-Q water system from Millipore (Billerica, USA). Formic acid (puriss p.a., 98%) and methanol (spectrophotometric grade,≥99%) were purchased from Fluka Sigma Aldrich (Buchs, Switzerland). HPLC-grade 2-propanol was purchased from Merck (Darm-stadt, Germany). Nonbleeding pH indicator strips obtained from Merck (Darmstadt, Germany) and filter paper What-mann 903 (formely Schleicher and Schuell 903) (GE Health-care, Dassel, Germany) as size A4 sheets, cut into 5-mm wide strips, were used for pipetting of urine samples.
Urinary creatinine content was determined by a Roche Hitachi 902 (Roche Diagnostics, Mannheim, Germany) ana-lyzer using the Jaffé picric acid reaction (DRI® Creatinine-Detect® Test, Microgenics, Passau, Germany). E. coli was isolated from autopsy material (liver, heart blood, urine, ascites, pericardial fluid and pleural fluid) (strain no. 9478) and used for spiking of the urine after it had been
sterile-filtered using a Millipore Millex Syringe-Driven Filter Unit with a 0.22-μm PSE-Membran (SLGP033RS). This mem-brane filter is typically used for laboratory applications including sterile filtration of protein solutions, tissue culture media, additives, buffers and water. This single-use filter unit consists of a membrane filter sealed in an acrylic housing and is nonpyrogenic and nontoxic. The Millex filter unit is compatible with most aqueous solutions and can also be used for pharmacy admixture application. Drug-free urine was obtained from a volunteer who was abstinent from alcohol for at least 1 week.
Preparation of calibration and quality control samples For spiking calibration samples, working solutions ranging
from 2.5μg/ml to 250 μg/ml for EtG and EtS and from
1,250μg/ml to 62,500 μg/ml for creatinine were prepared in methanol. The stock solution of creatinine was prepared in a mixture of methanol/formic acid (75/25, v/v). The acidic con-ditions were necessary to increase the solubility of creatinine in methanol. For spiking quality control samples, working solutions with EtG and EtS concentrations of 2.0, 6.0, 40 and 160μg/mL were prepared in methanol. Calibration sam-ples for the stability experiment were prepared in water in order to be able to calibrate also for creatinine. They were spiked at concentration levels of 0.1, 0.2, 1.0, 2.5, 5.0 and 10μg/ml for EtG and EtS, and 50, 100, 200, 500, 1,250, 2,500μg/ml for creatinine.
Experimental set-up
Blank urine was centrifuged (10 min, 1,780g) and sterile-filtered to remove any bacteria. The sterile urine (9 ml) was then spiked with EtG and EtS to a final concentration of approximately 5μg/ml and optionally with E. coli (1 ml of a
solution with approximately 108 colony forming units
(CFU)/ml) and glucose (10 mg/l), as a further source of carbon:
Culture I: urine spiked with EtG and EtS and E. coli. Culture II: urine spiked with EtG and EtS, E. coli and glucose.
Control sample: urine spiked with EtG and EtS. The cultures and the control sample (10 mL) were incubated on an incubator for 5 days at 37 °C. Aliquots were collected at different time intervals (0, 2, 4.5, 22, 28, 48, 72 and 96 h). Three samples were collected from each culture tube each time: a liquid sample (immediately frozen at−25 °C) and two aliquots collected on a pH indicator strip and on a What-man 903 filter paper strip. The urine spots were allowed to dry for 4 h at room temperature and were then stored at room temperature. To monitor the bacterial growth, Columbia blood
agar plates were prepared and incubated under aerobic con-ditions with 5% CO2until examination at each sampling time.
Dried urine spot sample preparation procedure and extraction
For each sample, 30μl of spiked water (calibrator) or urine were pipetted onto filter paper (pH indicator strip and What-man 903 filter paper strip) and allowed to diffuse and dry for at least 4 h at ambient room temperature. The specimens from the stability experiment were then stored in plastic tubes (2.0 ml, Sarstedt, Nümbrecht, Germany) at room temperature for 7 days prior to analysis, whereas the specimens for the validation were analyzed immediately. The filter paper from the stripes were then cut into smaller pieces and transferred to microtubes, where they were extracted by vortex mixing for 10 minutes with 300 μl of a methanol solution containing deuterated standards (0.05μg/mL D5-EtG, 3μL of a 1:10
6
dilution of synthesized D5-EtS and 50μg/mL D3-creatinine).
After centrifugation (10 min, 18,320 g), 150μl of the solution was transferred into glass vials with insert (0.5 ml Infochroma, Zug, Switzerland) and dried under a gentle stream of nitrogen at 50 °C. Samples were then reconstituted by adding 50μl of a water/acetonitrile/formic acid (95/5/0.1; v/v) solution and shaken for 1 min. Ten microliters was injected into the LC– MS/MS system.
Processing of liquid urine samples
For each liquid sample, 50μl of spiked water (calibrator) or urine was pipetted into a microtube. The liquid urine samples collected at different time intervals were frozen immediately after collection until analysis. All samples were extracted by vortex mixing for 10 min with 150 μl of an acetonitrile solution containing deuterated standards (0.1μg/ml D5-EtG,
6μl of a 1:106dilution of synthesized D5-EtS and 100μg/ml D3-creatinine). After centrifugation (10 min, 18,320 g), 100μl
of the supernatant solution was transferred into glass vials and dried under a gentle stream of nitrogen at 50 °C. Samples were then reconstituted by adding 100μl of a water/acetonitrile/ formic acid (95/5/0.1; v/v) solution and shaken for 1 min. Ten microliters was injected into the LC–MS/MS system. The creatinine content of liquid urine samples was measured by LC–MS/MS and then also by a Roche Hitachi 912 analyzer using the DRI creatinine kit (Microgenics, Passau, Germany) for comparison of the results.
Quantification of the colony forming units (CFU)
Serial dilutions (10−1–10−6) of cultures I and II were pre-pared in a 0.9% NaCl solution each sampling time. One hundred microliters of the diluted samples (10−6,10−5) and
blood agar plate and incubated at 37 °C. The agar plates were examined for bacterial growth after 24 h.
Validation
A validation method for the determination of EtG and EtS in DUS was performed according to the guidelines of the FDA [31]. During the validation, all samples were processed as DUS, as described before. The parameters evaluated were linearity, accuracy and precision, selectivity, dilution of concentrated sample, recovery and stability. Precision was expressed as the relative standard deviation (RSD%). Accu-racy was expressed as the mean relative error (RE%).
Calibration and quality control samples were prepared by spiking blank urine with the above described working so-lutions. Six-point calibration curves with EtG and EtS con-centrations of 0.1, 0.2, 1.0, 2.5, 5.0 and 10 μg/ml were prepared in duplicate on three different days, pipetted onto pH indicator strips, allowed to dry and analyzed. Precision and accuracy were determined by preparing DUS from urine spiked at different EtG and EtS concentration levels and defined as quality controls (QC): 0.1 μg/ml, 0.3 μg/ml (QClow), 2.0μg/ml (QCmiddle) and 8.0μg/ml (QChigh). The
lowest QC level had the same concentration as the first calibrator. Intraday precision was determined by replicate analysis (n06) of spiked samples at these four concentration levels; interday precision was assessed by analysis of spiked samples on 3 days.
The selectivity of the method was evaluated by analyzing blank urine from six different sources and tested for inter-ference from endogenous matrix components, metabolites, decomposition products, etc. Possible dilution of samples with concentrations over the calibration range was studied by preparing DUS with EtG and EtS concentrations ten
times the highest QC level (80 μg/ml). The methanolic
extracts containing the analytes and the internal standards were then diluted before reconstitution. Finally, 150μl of the diluted solution was evaporated and reconstituted by adding 50 μl of a water/acetonitrile/formic acid (95/5/0.1; v/v) solution. After the LC–MS/MS analysis, the results were corrected for the dilution factor.
In order to determine the recovery of EtG and EtS from DUS, DUS were created with blank urine and extracted as usual with methanol containing internal standards. Before evaporation and reconstitution, 150 μL of the extracts was spiked with 30μl of the appropriated QC working solution (six replicates at QClow, QCmiddleand QChigh). The recovery
was assessed by comparing the analyte/internal standard peak area ratio of these unextracted samples with that of extracted samples spiked at the same EtG and EtS concentrations.
The stability of EtG and EtS in DUS was investigated by storing specimens at different conditions. Therefore, DUS were prepared at both low (0.3μg/ml) and high (8.0 μg/ml)
concentration levels and stored in plastic sealable bags at room temperature and at 4 °C for 1, 2 and 3 weeks. Six replicates (n06) of each concentration level were analyzed after each time period. On the other hand, to assess the stability of already processed samples, extracts (six repli-cates at four different concentration levels: 0.1, 0.3, 2.0 and 8.0μg/ml) were reinjected after 7 days at 4 °C.
Chromatographic system
Instrumentation consisted of a CTC PAL autosampler, an Agilent 1200 series HPLC and a QTrap 3200 mass spec-trometer (AB Sciex, Rotkreuz, Switzerland) controlled by Analyst 1.5.1 software, which was also used for the data acquisition and processing. For the analytical separation, a 150×2 mm column with 4μm particles (Synergi Polar-RP, Phenomenex, Torrance CA, USA) contained in a column heater at 40 °C was used. To enhance signal intensity, 2-propanol was added postcolumn with a flow of 0.3 ml/min by a T-union before the eluent enters the electrospray ion source.
The gradient elution was performed with 0.1% formic acid in water as mobile phase A and 0.1% formic acid in acetonitrile as mobile phase B. The gradient was run at a flow of 0.3 ml/min, starting at 2% B for 2 min and increasing to 90% B for 3 min. The gradient was then changed back to the starting conditions over 0.5 min and kept constant for 6.5 min to re-equilibrate. The retention times of EtG, EtS and creatinine were 1.92, 1.68 and 1.57 min, respectively.
The mass spectrometer was operated in the negative multiple reaction monitoring (MRM) mode by employing a TurboIonSpray source. The following transitions (quantifier, qualifier and internal standard) and parameters (DP, CE) were used: EtG: m/z 221/75, m/z 221/85, m/z 226/75, DP:−28 V, CE:−24 V; EtS: m/z 125/97, m/z 125/80, m/z 130/98, −30 V, −25 V; creatinine: m/z 112/68, m/z 115/68 (IS), −35 V, −25 V. For the EtS qualifier transition, a DP of−50 V and a CE of −44 V were used.
Results and discussion
It has been reported, that some pathogens that cause urinary tract infections (UTIs) can hydrolyze or synthesize EtG [20–22], but it is not known that EtS is sensitive to bacterial degradation. E. coli is the predominant bacteria found in UTIs, with most strains presenting a β-glucuronidase activity that cleaves glucuronide conjugates such as EtG [21]. This study was designed to test whether spotting on paper and drying could hinder EtG and EtS degradation in urine contaminated with E. coli. The EtG and EtS concentrations, unlike ethanol, are known to be influenced by urine dilution [2,4]. For this reason, measurement of the creatinine content of the investigated
urine is necessary. In our laboratory, creatinine is regularly measured by a spectrophotometric test with liquid urine sam-ples. In our investigation, however, we worked with DUSs. Therefore, the possibility of extracting and measuring creatinine together with the two studied alcohol markers by an LC–ESI– MS/MS method was investigated.
Stability experiment
The two cultures (I and II) used for the stability test con-sisted of sterile urine spiked with EtG and EtS to a final concentration of approximately 5 μg/ml and (I) E. coli
(approximately 106 CFU); (II) E. coli (approximately
106 CFU) and glucose (10 mg/l), as a further source of carbon. Sterile urine spiked with EtG and EtS at the same concentration as the two cultures studied was used as control sample and incubated on an incubator for 5 days at 37 °C, together with cultures I and II.
The degradation of EtG and EtS in urine was followed-up for up to 4 days. Aliquots were collected at different time intervals: 0, 2, 4.5, 22, 28, 48, 72 and 96 h. Liquid samples were directly frozen after sampling, whereas aliquots for DUS were pipetted onto a pH indicator strip from Merck and onto Whatman 903 filter paper, in order to compare both types of absorbent papers. The DUSs were allowed to dry and stored in plastic tubes for 7 days at room tempera-ture. After this time, liquid samples were thawed and pro-cessed as described before together with a freshly made calibration curve in water. Simultaneously, samples collected as DUSs were also processed as required and two different calibration curves in water were made, one for the pH indica-tor strip samples and another one for the Whatman 903 filter paper samples. The three-calibration curves were prepared in water, in order to be able to calibrate creatinine, which is present in urine. The results are shown in Fig.1.
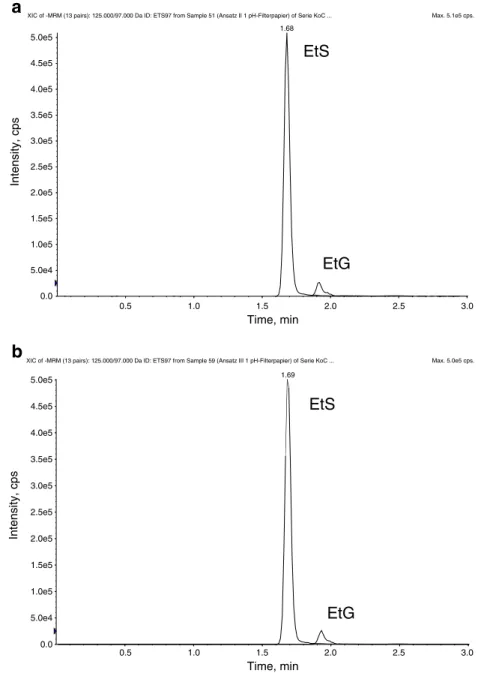
In agreement with literature reports [20,21], a degrada-tion of EtG in cultures I (see Fig.1a) and II (see Fig.1b) due to bacterial activity was observed during the studied time period: after 4.5 h, 60% of the EtG had been hydrolyzed. Aliquots of cultures I and II, collected and stored for 7 days at room temperature as DUS before analysis showed the same concentrations for both alcohol markers as the liquid samples; no further degradation was observed after collec-tion as DUSs (see Fig.2). This means, DUSs containing E. coli and stored for 7 days at room temperature showed no degradation of EtG during storage, but the same biomarker concentration as the liquid sample collected at the same time and stored refrigerated to prevent hydrolysis. By drying the contaminated urine samples on filter paper, bacterial growth was inhibited and, consequently, EtG was stabilized against bacterial hydrolysis. The same results were observed in DUSs collected on pH indicator strips and on Whatman 903 filter paper.
In addition, no difference in the degradation rate of EtG was observed between cultures I and II (see Fig.1a and b). This means, that the presence of glucose in the latter did not influence the hydrolysis of EtG by E. coli. In comparison with the results of Baranowski et al. [21], where EtG was totally degraded after 96 h, in our experiments, it took only 22 h. This can be explained by the higher concentration of bacteria in the presented study.
The EtS concentration did not change during the experi-ment (96 h at 37 °C) in cultures I and II, neither in the liquid
Fig. 1 EtG (black), EtS (blue) and creatinine (red) concentration in cultures I (a) and II (b) and in the control sample (c) in the different collection modes: liquid urine samples (rhombus with dashed line), pH indicator strips (triangle with dotted line) and Whatman 903 filter paper (square with solid line)
samples nor in any of the two kinds of DUSs (see Fig.1a and b), confirming previous observations about the stability of this alcohol metabolite during incubation with E. coli. The creat-inine concentration did not vary either during the test and was in agreement with the concentrations measured with the spec-trophotometric test (results not shown in detail). As expected due to the lack of ethanol in the urine samples, no EtG or EtS formation could be observed in any of the cultures studied, as it was the case in the experiments of Helander et al. [22]. Validation
The linearity of the calibration range was evaluated by analyzing DUS created from urine spiked at EtG and EtS concentration levels of 0.1, 0.2, 1.0, 2.5, 5.0 and 10μg/mL.
The calibration curve was analyzed in duplicate over three different days. A least squares regression algorithm with mean regression coefficients of 0.9981 and 0.9984 for EtG and EtS, respectively, best determined the linearity of the method in the studied calibration range. The limits of detec-tion (LOD) and limits of quantitadetec-tion (LOQ) were deter-mined using a linear regression model according to ISO 32645 guidelines with a calibration range from 0 to
1.0 μg/mL. The LOD and LOQ were 0.050 μg/ml and
0.175 μg/ml for EtG, and 0.100 μg/ml and 0.340 μg/ml
for EtS, respectively.
Precision and accuracy were determined by preparing DUS from urine spiked at EtG and EtS concentration levels of 0.1μg/ml, 0.3 μg/ml (QClow), 2.0μg/ml (QCmiddle) and
8.0μg/l (QChigh). Intra- and interday assay variations were
Max. 5.1e5 cps. . . . C o K e i r e S f o ) r e i p a p r e t li F -H p 1 I I z t a s n A ( 1 5 e l p m a S m o r f 7 9 S T E : D I a D 0 0 0 . 7 9 / 0 0 0 . 5 2 1 : ) s r i a p 3 1 ( M R M -f o C I X 0.5 1.0 1.5 2.0 2.5 3.0 Time, min 0.5 1.0 1.5 2.0 2.5 3.0 Time, min 0.0 5.0e4 1.0e5 1.5e5 2.0e5 2.5e5 3.0e5 3.5e5 4.0e5 4.5e5 5.0e5 Intensity, cps 1.68 Max. 5.0e5 cps. . . . C o K e i r e S f o ) r e i p a p r e t li F -H p 1 I I I z t a s n A ( 9 5 e l p m a S m o r f 7 9 S T E : D I a D 0 0 0 . 7 9 / 0 0 0 . 5 2 1 : ) s r i a p 3 1 ( M R M -f o C I X 0.0 5.0e4 1.0e5 1.5e5 2.0e5 2.5e5 3.0e5 3.5e5 4.0e5 4.5e5 5.0e5 Intensity, cps 1.69
EtS
EtG
EtS
EtG
a
b
Fig. 2 Ion chromatograms of DUSs from culture I collected at the beginning of the
experiment (t00) and stored
at RT for 7 days until analysis: a pH filter strip; b Whatman 903 filter paper
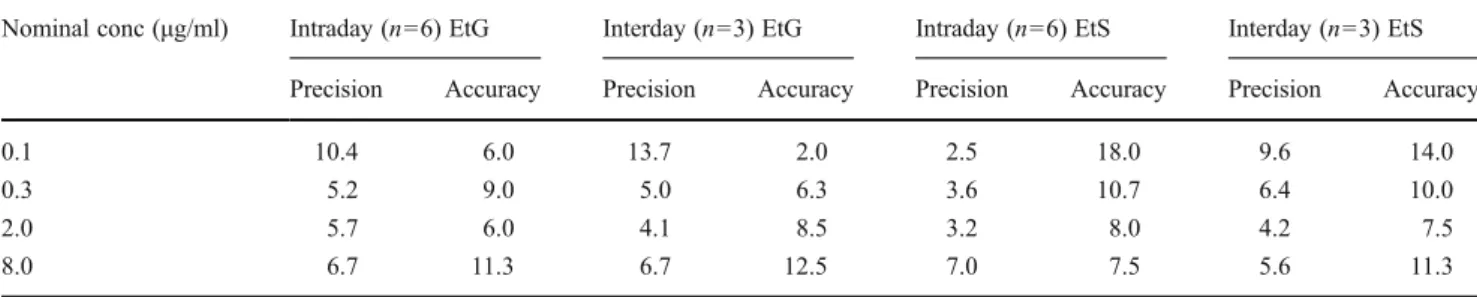
determined by analyzing replicate samples (n06) of each QC level on three different days. For both intra- and inter-day assays, precision and accuracy of EtG and EtS were always less than 15%, or 20% in the case of the QC level with the lowest concentration. Precision and accuracy data are summarized in Table1.
The selectivity of the method was evaluated by analyzing DUS created with urine from six different sources and compared with urine spiked at EtG and EtS concentrations of 0.1μg/ml. No interfering substances could be observed in any of the DUS analyzed for any of the ethanol metabolites studied, being, therefore, the selectivity ensured at the lowest calibration level.
In addition, the possibility of diluting a sample with EtG and EtS concentrations over the calibration range was studied during the validation. For this purpose, six DUS replicates (n06) were created with blank urine spiked at EtG and EtS concentrations ten times higher than QChigh, 80 μg/ml.
Following a tenfold dilution of the methanolic extracts, samples were injected into the LC–MS/MS system. The concentrations were back-calculated taking into consideration the dilution factor. Precision and accuracy were found to be within the acceptance limits of 15%.
The extraction efficiency of EtG and EtS from DUS was evaluated by analyzing DUS spiked with the analytes at three different concentrations: 0.3, 2.0 and 8.0μg/ml. Six replicates (n06) at each concentration level were extracted and analyzed, and the analyte/internal standard peak area ratios were compared with those of nonextracted DUS cre-ated with blank urine and spiked with EtG and EtS after the extraction to concentrations which represent 100% recovery. The recovery for EtG and EtS was always higher than 32% and 38%, respectively, and it was reproducible over the calibration range.
The stability of EtG and EtS in DUS was investigated by preparing specimens at two different concentration levels, QClowand QChigh, and by storing them in sealable plastic
bags at room temperature (RT) and at 4 °C for 1, 2 and 3 weeks. After these time periods, six replicates (n06) of each concentration level stored at room temperature and at 4 °C were processed and analyzed. The results shown in Table2demonstrate that both analytes are stable at RT and
at 4 °C for at least 1 week. After this time, their stability decreased.
Reinjection of already processed samples after 7-day storage at 4 °C was performed with six replicates (n06) from each QC level: 0.1, 0.3, 2.0 and 8.0μg/ml. In these reinjected samples, precision and accuracy for EtG and EtS were always less than 15%, except for EtG at QChigh, where
the accuracy was 17.5%.
Conclusion
In this study with dried urine spots (DUS), an innovative method for sample collection and subsequent simultaneous determination of EtG, EtS and creatinine in urine by LC– ESI–MS/MS is presented. The method proved to be not only reliable for the determination of these analytes but it can also be recommended due to the inhibition of degradation of EtG by E. coli observed in traditionally used liquid urine specimens.
Bacterial growth, necessary for bacterial degradation of analytes, was inhibited upon drying the contaminated urine specimens on filter paper. In this way, no hydrolysis of EtG took place, even upon storage of the samples at room temperature, eliminating thus the risk of having lower con-centrations or even false-negative identification of EtG. EtS was also stable on DUSs containing E. coli, confirming thus the reported stability of this metabolite against bacterial degradation. Other pathogens such as Clostridium sordellii [21] or Klebsiella pneumonia [20] that are reported to hy-drolyze EtG, were not studied in this experiment. However,
Table 1 Precision (RSD%) and accuracy (RE%) of the EtG and EtS analysis in DUS
Nominal conc (μg/ml) Intraday (n06) EtG Interday (n03) EtG Intraday (n06) EtS Interday (n03) EtS
Precision Accuracy Precision Accuracy Precision Accuracy Precision Accuracy
0.1 10.4 6.0 13.7 2.0 2.5 18.0 9.6 14.0
0.3 5.2 9.0 5.0 6.3 3.6 10.7 6.4 10.0
2.0 5.7 6.0 4.1 8.5 3.2 8.0 4.2 7.5
8.0 6.7 11.3 6.7 12.5 7.0 7.5 5.6 11.3
Table 2 Stability of EtG and EtS in DUS over 3 weeks at room temperature (RT) and at 4 °C expressed as mean relative error (RE%) Nominal conc.
(μg/ml) (n06)
1 week 2 weeks 3 weeks
RT 4 °C RT 4 °C RT 4 °C
EtG 0.3 5.1 6.3 −5.8 −2.6 17.2 10.0
8.0 11.0 15.5 22.3 30.0 16.7 7.6
EtS 0.3 1.4 1.9 2.3 10.5 12.6 17.4
the results presented here lead us to think that EtG is stable against any bacterial degradation, since dehydration of the specimens hinders the growth of pathogens.
The simultaneous extraction and determination of creati-nine, EtG and EtS from DUSs disregards the need for liquid urine samples, thus facilitating transport and storage of specimens, since there is no need to freeze samples to hinder bacterial degradation.
The DUS method is, thus, highly recommended for EtG and EtS determination in urine samples because it is con-sidered that with this sampling and collection method, a further step in the reliability of EtG and EtS analysis for detection of alcohol consumption can be done.
Acknowledgements The authors would like to acknowledge the
Swiss National Foundation for financial support.
References
1. Jones AW (1990) Excretion of alcohol in urine and diuresis in healthy men in relation to their age, the dose administered and the
time after drinking. Forensic Sci Int 45(3):217–224
2. Bergstrom J, Helander A, Jones AW (2003) Ethyl glucuronide concentrations in two successive urinary voids from drinking drivers: relationship to creatinine content and blood and urine
ethanol concentrations. Forensic Sci Int 133(1–2):86–94
3. Schmitt G, Droenner P, Skopp G, Aderjan R (1997) Ethyl glucu-ronide concentration in serum of human volunteers, teetotalers,
and suspected drinking drivers. J Forensic Sci 42(6):1099–1102
4. Dahl H, Stephanson N, Beck O, Helander A (2002) Comparison of urinary excretion characteristics of ethanol and ethyl glucuronide. J Anal Toxicol 26(4):201–204
5. Helander A (2003) Biological markers in alcoholism. J Neural Transm Suppl 66:15–32
6. Weinmann W, Schaefer P, Thierauf A, Schreiber A, Wurst FM (2004) Confirmatory analysis of ethylglucuronide in urine by liquid-chromatography/electrospray ionization/tandem mass spec-trometry according to forensic guidelines. J Am Soc Mass
Spec-trom 15(2):188–193
7. Seidl S, Wurst FM, Alt A (2001) Ethyl glucuronide—a biological
marker for recent alcohol consumption. Addict Biol 6(3):205–212
8. Helander A, Beck O (2004) Mass spectrometric identification of ethyl sulfate as an ethanol metabolite in humans. Clin Chem 50
(5):936–937
9. Dresen S, Weinmann W, Wurst FM (2004) Forensic confirmatory
analysis of ethyl sulfate—a new marker for alcohol consumption—
by liquid-chromatography/electrospray ionization/tandem mass
spectrometry. J Am Soc Mass Spectrom 15(11):1644–1648
1 0. F o t i R S , F i s h e r M B ( 2 0 0 5 ) A s s e s s m e n t o f U D P -glucuronosyltransferase catalyzed formation of ethyl glucuro-nide in human liver microsomes and recombinant UGTs. Forensic Sci Int 153(2–3):109–116
11. Schneider H, Glatt H (2004) Sulpho-conjugation of ethanol in humans in vivo and by individual sulphotransferase forms in vitro.
Biochem J 383(Pt. 3):543–549
12. Stephanson N, Dahl H, Helander A, Beck O (2002) Direct quan-tification of ethyl glucuronide in clinical urine samples by liquid
chromatography–mass spectrometry. Ther Drug Monit 24(5):645–
651
13. Wurst FM, Dresen S, Allen JP, Wiesbeck G, Graf M, Weinmann W (2006) Ethyl sulphate: a direct ethanol metabolite reflecting recent alcohol consumption. Addiction 101(2):204–211
14. Wurst FM, Kempter C, Seidl S, Alt A (1999) Ethyl glucuronide—a marker of alcohol consumption and a relapse marker with clinical and forensic implications. Alcohol Alcohol 34(1):71–77 15. Helander A, Bottcher M, Fehr C, Dahmen N, Beck O (2009)
Detection times for urinary ethyl glucuronide and ethyl sulfate in heavy drinkers during alcohol detoxification. Alcohol Alcohol 44
(1):55–61
16. Thierauf A, Halter CC, Rana S, Auwaerter V, Wohlfarth A, Wurst FM, Weinmann W (2009) Urine tested positive for ethyl
glucuro-nide after trace amounts of ethanol. Addiction 104(12):2007–2012
17. Wurst FM, Skipper GE, Weinmann W (2003) Ethyl glucuronide—
the direct ethanol metabolite on the threshold from science to
routine use. Addiction 98(Suppl 2):51–61
18. Skipper GE, Weinmann W, Thierauf A, Schaefer P, Wiesbeck G, Allen JP, Miller M, Wurst FM (2004) Ethyl glucuronide: a bio-marker to identify alcohol use by health professionals recovering
from substance use disorders. Alcohol Alcohol 39(5):445–449
19. Wurst FM, Yegles M, Alling C, Aradottir S, Dierkes J, Wiesbeck GA, Halter CC, Pragst F, Auwaerter V (2008) Measurement of direct ethanol metabolites in a case of a former driving under the influence (DUI) of alcohol offender, now claiming abstinence. Int J Legal Med 122(3):235–239
20. Helander A, Dahl H (2005) Urinary tract infection: a risk factor for false-negative urinary ethyl glucuronide but not ethyl sulfate in the
detection of recent alcohol consumption. Clin Chem 51(9):1728–
1730
21. Baranowski S, Serr A, Thierauf A, Weinmann W, Grosse Perdekamp M, Wurst FM, Halter CC (2008) In vitro study of bacterial degrada-tion of ethyl glucuronide and ethyl sulphate. Int J Legal Med 122
(5):389–393
22. Helander A, Olsson I, Dahl H (2007) Postcollection synthesis of ethyl glucuronide by bacteria in urine may cause false
identifica-tion of alcohol consumpidentifica-tion. Clin Chem 53(10):1855–1857
23. Thierauf A, Serr A, Halter CC, Al-Ahmad A, Rana S, Weinmann W (2008) Influence of preservatives on the stability of ethyl glucuronide and ethyl sulphate in urine. Forensic Sci Int 182 (1–3):41–45
24. Kaufmann E, Alt A (2008) Detection of ethyl glucuronide in dried human blood using LC-MS/MS. Int J Legal Med 122(3):245–249 25. Winkler M, Kaufmann E, Thoma D, Thierauf A, Weinmann W, Skopp G, Alt A (2011) Detection of ethyl glucuronide in blood
spotted on different surfaces. Forensic Sci Int 210(1–3):243–246
26. Faller A, Richter B, Kluge M, Koenig P, Seitz HK, Thierauf A,
Gnann H, Winkler M, Mattern R, Skopp G (2011) LC–MS/MS
analysis of phosphatidylethanol in dried blood spots versus con-ventional blood specimens. Anal Bioanal Chem.
27. Edelbroek PM, van der Heijden J, Stolk LM (2009) Dried blood spot methods in therapeutic drug monitoring: methods, assays, and
pitfalls. Ther Drug Monit 31(3):327–336
28. McDade TW, Williams S, Snodgrass JJ (2007) What a drop can do: dried blood spots as a minimally invasive method for integrat-ing biomarkers into population-based research. Demography 44
(4):899–925
29. Alfazil AA, Anderson RA (2008) Stability of benzodiazepines and cocaine in blood spots stored on filter paper. J Anal Toxicol 32 (7):511–515
30. Skopp G, Potsch L (2001) Detection of cocaine in blood stains. Arch Kriminol 207(3–4):81–88
31. Guidance for Industry: Bioanalytical Method Validation (2001) U.S. Department of Health and Human Services FDA.
Rock-ville, USA. http://www.fda.gov/downloads/Drugs/Guidance
ComplianceRegulatoryInformation/Guidances/ucm070107.pdf. Accessed 24 September 2011