HAL Id: hal-02477461
https://hal.inria.fr/hal-02477461
Submitted on 13 Feb 2020
HAL is a multi-disciplinary open access
archive for the deposit and dissemination of
sci-entific research documents, whether they are
pub-lished or not. The documents may come from
teaching and research institutions in France or
abroad, or from public or private research centers.
L’archive ouverte pluridisciplinaire HAL, est
destinée au dépôt et à la diffusion de documents
scientifiques de niveau recherche, publiés ou non,
émanant des établissements d’enseignement et de
recherche français ou étrangers, des laboratoires
publics ou privés.
Indetermination-free cytoarchitecture measurements in
brain gray matter via a forward diffusion MRI signal
separation method
Maëliss Jallais, Demian Wassermann
To cite this version:
Maëliss Jallais, Demian Wassermann. Indetermination-free cytoarchitecture measurements in brain
gray matter via a forward diffusion MRI signal separation method. ISMRM 2020 - 28th Annual
Meeting & Exhibition, Aug 2020, Sydney / Virtual, Australia. �hal-02477461�
Indetermination-free cytoarchitecture measurements in brain gray matter via a
forward diffusion MRI signal separation method
Maëliss Jallais and Demian Wassermann
Université Paris-Saclay, Inria, CEA, Palaiseau, France
Synopsis
Non-invasive imaging at the cellular level could lead us to quantify grey matter tissue cytoarchitecture, which has so far been accessible only through histology, or by indeterminate-prone approaches.
We propose a new dMRI-based index to study modulated by the size of the somas. This index can be extracted without indeterminations from any acquisition including three b-values superior to 3 ms/μm . Simulations were experimentally confirmed by tests on the HCP MGH data set.
Introduction
In this work we solve the problem of estimating soma sizes in grey matter with no indetermination. To extract a soma size-modulated mesasurement, we combine approximations to a biophysical model at low b-values and its associated return-to-the-origin probability (RTOP) for high b-values.
Such non-invasive measurement of cellular characteristics has the potential to quantify tissue cytoarchitecture, in a unique-solution system, which has so far been accessible only through histology.
Our contribution focuses on the human brain gray matter, which can be decomposed into three compartments, somas and processes that are modeled by spheres and 0-radius tubes, and extra-cellular water. This work shows the feasibility to extract factor that reflects the averaged diameter of the somas in the voxel with a unique solution. Our three-compartment model, under the hypothesis that there is no exchange between the three compartments , is as follow :
f and f represent the MR dendrite and soma signal fraction respectively, D and D the extra-cellular and soma diffusivities, D axial diffusivity and r the soma radius.
The tube signal is modeled by a power-law scaling , and the sphere signal by Balinov's approximation
. Here we exploit this relation to extract that, at fixed , modulated by soma
size with a method that can be applied to acquisitions with just 5 b-values. Three of them must be superior to a minimum b-value defined by
cell soma size, see Fig2. The spacing of these points is determined by the SNR as the signal difference between points must not be noise-dominated.
Others have already propose solutions to dMRI soma measurement for high b-values, and more b-values in all, but their method leads to indeterminate systems. Our direct method is indetermination free.
Methods
By combining the expression to our biophysical model (1) for RTOP at large q (respectively b) and a Lemonade variant at low b (respectively q), we produce a method to extract the parameters of our model.
RTOP: high b. We compute a q-bounded RTOP, a direct measure of the restrictions of the diffusing fluid molecule motion that gives us
information about the structure of the media :
For q large enough, RTOP of the sphere signal converges towards a value that depends on C. We therefore obtain from eqs (1) and (2) assuming a large enough q :
By solving an ordinary least square regression we can find the coefficients a , b and c of the previous polynomial and we end up with 2 equations with 3 unknowns.
Spiked LEMONADE: low b. We adapted the method proposed in in adding the sphere contribution (f and C). Estimating the rotational
invariant moment tensors M , M , and M for a b-value up to 2.5ms/μm we can find 4 more equations with 6 unknowns.
Total system. We end up with a system of 6 equations for 6 unknowns that has no degeneracy.
Spiked LEMONADE, low b :
1 1 1 2 1 2
=
(q,
) +
(q,
, ) + (1 −
− )
(q,
)
S
(q)
S
(0)
f
tS
tubesD
af
sS
spheresD
sr
sf
tf
sS
ecsD
ecst s ecs s a s 3 1
⋅
+ γ
4 πτD√ ||aq
−1 4− log
S
spheres(q) = C( ,
r
sD
s) ⋅
q
2C
= C( ,
r
sD
s)
D
s 5 6,7RT OP
(
q
max) =
d
1
(2π)
3∫
qmax 0S
(q)
S
(0)
q
max max maxRT OP
(
q
max) =
+
⋅
+
⋅
(1 − )
f
t(2π ⋅ 8
)
2√
−
π
−
⋅ 4
C
3/2f
t4(2π)
3πτD
|| a− −
−−−
√
q
2 maxγ
3(2π)
3q
max3fit fit fit 8
s
RTOP, high b:
Numerical simulations. To mimic neurons, we modelled the sphere and tube signals using the DMIPY simulator with soma radius equal
to approximately 20 and 15μm, reproducing Von Economo and pyramidal neurons.
Experimental Data. We used the HCP MGH Adult Diffusion data set to study the variation of C on the insula, precentral and postcentral
parts of the Destrieux atlas. It is composed of 35 subjects, with δ/Δ=10.6/43.1ms and b=1, 3, 5, 10ms/μm2.
Results
Simulations. RTOP computation on soma simulations shows the convergence values specific to soma diameters of different neurons in the
brain, obtained from Neuromorpho.org (Fig.2a). This value is proportional to C, and Fig2b shows that C is modulated by the size of the somas, and inversely proportional to it. The relative error of C with respect to the minimum b-value used for the RTOP computation is presented in Fig2c.
Experiments. Fig3, C value for three cortical regions on subject 1010 (right handed), preliminary evidence shows: larger soma size spread
and asymmetry on the insula, agreeing with . and larger somas on the left postcentral, possibly hemispheric dominance . Fig 4. Soma-to-dendrite volume ratio showing soma predominance agreeing with literature . Although further work is needed, this showcases our method’s potential.
Discussion and Conclusion
The minimal b-value needed to compute the large approximation of the signal RTOP must be at least 3ms/μm to get a good C approximation in the case of VEN and pyramidal neurons. The proposed method does not need a large range of b-values as in .
Acknowledgements
This work was supported by the ERC-StG NeuroLang and the ANR/NSF NeuroRef grants.
References
1. Partha P. Mitra and Pabitra N. Sen. Effects of microgeometry and surface relaxation onNMR pulsed-field-gradient experiments: Simple pore geometries.Physical Review B, 453(1):143–156, January 1992. ISSN 0163-1829, 1095-3795. doi:
10.1103/PhysRevB.45.143.URLhttps://link.aps.org/doi/10.1103/PhysRevB.45.143.
2. Palombo M, Shemesh N, Ianus A, et al., Abundance of cell bodies can explain the stickmodel’s failure to describe high b-value diffusion signal in grey matter. Proc. Int. Soc.Magn. Reson. Med. 2018, 1096
3. Jelle Veraart, Els Fieremans, and Dmitry S. Novikov. On the scaling behav-ior of water diffusion in human brain white matter.NeuroImage, 185:379–387,January 2019. ISSN 10538119. doi: 10.1016/j.neuroimage.2018.09.075. URLhttps://linkinghub.elsevier.com/retrieve
/pii/S1053811918319475
4. Balinov et al. The NMR Self-Diffusion Method Applied to Restricted Diffusion. Simu-lation of Echo Attenuation form Molecules in Spheres and between Planes. 1993
5. Marco Palombo, Clemence Ligneul, and Julien Valette. Modeling diffusion of intracel-lular metabolites in the mouse brain up to very high diffusion-weighting: Diffusion inlong fibers (almost) accounts for non-monoexponential attenuation: Modeling Diffusionof Brain Metabolites in Vivo up to Very High Diffusion Weighting.Magnetic Resonancein Medicine, 77(1):343–350, January 2017. ISSN 07403194. doi:
10.1002/mrm.26548.URLhttp://doi.wiley.com/10.1002/mrm.26548
6. Rutger H.J. Fick, Demian Wassermann, Emmanuel Caruyer, and Rachid De-riche.MAPL: Tissue microstructure estimation using Laplacian-regularizedMAP-MRI and its application to HCP data.NeuroImage, 134:365–385,July 2016. ISSN 10538119. doi: 10.1016/j.neuroimage.2016.03.046. URLhttps://linkinghub.elsevier.com/retrieve/pii/S1053811916002512
7. Mitra et al. Pulsed-field-gradient NMR measurements of restricted diffusion and thereturn-to-origin probability.Journal of Magnetic Resonance, 114:47–58, 1995
8. Dmitry S. Novikov, Jelle Veraart, Ileana O. Jelescu, and Els Fieremans. Rotationally-invariant mapping of scalar and orientational metrics
⎧
⎩
⎨
⎪
⎪
⎪
⎪
⎪
⎪
⎪
⎪
⎪
⎪
=
+ 3 C + 3(1 −
− )
M
(2),0f
tD
af
sf
tf
sD
e=
M(2),2 p2f
tD
a=
+ 5
+ 5(1 −
− )
M
(4),0f
tD
2afs
C
2f
tf
sD
2e=
M(4),2 p2f
tD
2 a⎧
⎩
⎨
⎪
⎪
⎪
⎪
=
a
fit (1− )ft√π (2π ⋅4)3 C3/2=
b
fit ft√π 2(2π)4√τD||a 7 9 10 10 2 5of neu-ronal microstructure with diffusion MRI.NeuroImage, 174:518–538, July2018.ISSN 10538119.doi: 10.1016/j.neuroimage.2018.03.006.URLhttps://linkinghub.elsevier.com/retrieve/pii/S1053811918301915
9. Evrard, H. C., Forro, T. & Logothetis, N. K. Von Economo Neurons in the Anterior Insula of the Macaque Monkey. Neuron 74, 482–489 (2012)
10. Katrin Amunts and Karl Zilles.Architectonic Mapping of the Hu-man Brain beyond Brodmann.Neuron, 88(6):1086–1107, Decem-ber 2015.ISSN 08966273.doi: 10.1016/j.neuron.2015.12.001.URLhttps://linkinghub.elsevier.com/retrieve/pii/S0896627315010727
Figures
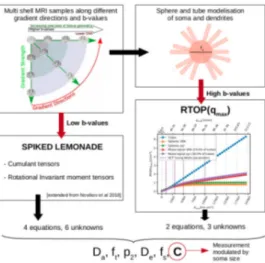
Figure 1: Visual abstract. On the top left we illustrate a multi-shell dMRI. On the one hand we are using gradient directions at low b-values
to estimate rotational invariants moment tensors. On the other hand we are computing RTOP(q ) for high q-values. We end up with a determinate system and get C, a measurement that is modulated by soma size.
Figure 2: (a) RTOP of the soma signal depends on the sphere diameter. The minimum b-value used for the large b approximation is related
to the diameter of the somas acquired. (b) C is modulated by the sphere diameter. (c) Relative error of C estimation. The bigger the soma, the lower b-values for a better realtive error. The minimum b-value used for the large b approximation is lower for VEN than pyramidal neurons.
Figure 3: C value for three cortical regions on subjet 1010 (right handed), Preliminary evidence shows: larger soma size spread and
asymmetry on the insula, agreeing with . ; and larger somas on the left postcentral, possibly hemispheric dominance .
max
Figure 4: Soma-to-dendrite volume ratio showing soma predominance agreeing with literature . Although further work is needed, this
showcases our method’s potential.

![[PDF] Formation de base sur les réseaux informatique - Cours réseau](data:image/gif;base64,R0lGODlhAQABAIAAAP///wAAACH5BAEAAAAALAAAAAABAAEAAAICRAEAOw==)