HAL Id: insu-01297927
https://hal-insu.archives-ouvertes.fr/insu-01297927
Submitted on 5 Apr 2016
HAL is a multi-disciplinary open access
archive for the deposit and dissemination of
sci-entific research documents, whether they are
pub-lished or not. The documents may come from
teaching and research institutions in France or
abroad, or from public or private research centers.
L’archive ouverte pluridisciplinaire HAL, est
destinée au dépôt et à la diffusion de documents
scientifiques de niveau recherche, publiés ou non,
émanant des établissements d’enseignement et de
recherche français ou étrangers, des laboratoires
publics ou privés.
Streaming potential measurements: 2. Relationship
between electrical and hydraulic flow patterns from rock
samples during deformation
Benoit Lorne, Frédéric Perrier, Jean-Philippe Avouac
To cite this version:
Benoit Lorne, Frédéric Perrier, Jean-Philippe Avouac. Streaming potential measurements: 2.
Rela-tionship between electrical and hydraulic flow patterns from rock samples during deformation. Journal
of Geophysical Research : Solid Earth, American Geophysical Union, 1999, �10.1029/1999JB900155�.
�insu-01297927�
JOURNAL OF GEOPHYSICAL RESEARCH, VOL. 104, NO. B8, PAGES 17,879-17,896, AUGUST 10, 1999
Streaming potential measurements
2. Relationship between electrical and hydraulic flow
patterns from rock samples during deformation
Benoit Lorne, Fr6d6ric Perrier, and Jean-Philippe
Avouac
Commissariat h l'l•nergie Atomique, Laboratoire de D6tection et de G6ophysique, Bruy•res-le-Chfitel, France
Abstract. Streaming potential and resistivity measurements have been performed on
Fontainebleau
sandstone
and Villejust quartzite samples
in a triaxial device during
compaction,
uniaxial compression,
and rupture. Measurements
on individual samples
do
not show any clear intrinsic dependence of the streaming potential coefficient with
permeability. An apparent dependence of the streaming potential coefficient with
permeability
is, however, observed
during deformation.
The effect of surface conductivity
is taken into account
and is small compared
with the observed
changes
in the streaming
potential coefficient.
The observed
dependence
is therefore interpreted in terms of a
difference
in the evolution of the electrical and hydraulic
connectivity
patterns during
deformation.
This effect causes
the streaming
potential coefficient,
and consequently
the
inferred • potential, to be reduced by a geometrical
factor R G representing
the electrical
efficiency
of the hydraulic network. Estimates
of the RG factor varying between 0.2 and
0.8 for electrolyte
resistivity
larger than 100 l•m are obtained by comparing
the values of
the • potential inferred from intact rock samples with the values obtained from crushed
rock samples, where the geometrical effects are assumed to be negligible. The reduction
of the streaming
potential coefficient
observed
during compaction
or uniaxial compression
suggests
that the tortuosity of the hydraulic network increases
faster than the tortuosity of
the electrical
network. Before rupture, an increase
in the streaming
potential coefficient
associated
with the onset of dilatancy
was observed
for three samples
of Fontainebleau
sandstone
and one sample of Villejust quartzite. The changes
in streaming
potential
coefficient
prior to failure range from 30% to 50%. During one experiment, an increase
in
the concentration of sulfate ions was also observed before failure. These experiments
suggest that observable streaming potential and geochemical variations could occur before
earthquakes.
1. Introduction
This paper is the second part of a study devoted to an
experimental investigation of the electrokinetic effect (EKE)
in the laboratory. As discussed at length by Lorne et al. [this
issue], this study is motivated by the fact that variations of
electric potential observed in a variety of geophysical contexts
(geothermal fields, volcanoes, and, in some instances, before
earthquakes) remain poorly understood. In the companion
paper we used crushed samples to investigate the properties of
the electrical double layer (EDL), which is at the core of the
EKE, and some empirical laws were obtained. To assess the
EKE in natural systems, in the present study we investigate the
relationship between fluid flow and electric potentials during
deformation and rupture. The streaming potential coefficient,
which is the ratio of the electric potential to the pressure
gradient, is measured by recording the voltage across a sample
through which an electrolyte is flowing. The streaming poten-
tial coefficient (also called the electrokinetic coupling coeffi-
cient) is proportional to the pressure gradient and a quantity
called the s r potential, which characterizes the structure of the
EDL.
Copyright 1999 by the American Geophysical Union. Paper number 1999JB900155.
0148-0227/99/1999JB900155509.00
Earlier measurements of the streaming potential coefficient
with rock samples were performed by Jouniaux and Pozzi [1995a, b, 1997] in a triaxial device, and the effect of deforma-
tion and rupture was studied. The reported values of the s r
potential for Fontainebleau sandstone and a 1 mmol/L 1:1 electrolyte solution at pH -- 5.6 varied from -20 to -97 mV.
In this paper we first compare s r potentials inferred from
streaming potential measurements of crushed Fontainebleau
sandstone samples, reported by Lorne et al. [this issue], with
results using intact rock samples. This systematic comparison
between crushed and intact rock samples is also of potential
value for rock formations for which the sample permeability in
the laboratory is small, whereas the permeability in the field is
high because of a pattern of fractures at large scales. For such
rock formations one could measure the s r potential of crushed
samples and extrapolate to the field scale using the scaling
relations empirically established for Fontainebleau sandstone.
When extrapolating to the large scale, the question of the
permeability dependence of the streaming potential coefficient
arises. The effect of permeability was addressed by Jouniaux
and Pozzi [1995a] using Fontainebleau sandstone and M6riel
limestone samples. They found a permeability dependence of
the streaming potential coefficient, which they interpreted to
result from the variation of surface conductivity with perme-
ability. However, we question this interpretation since, first, it
relies on a value of the surface conductance of Fontainebleau
sandstone of 5 x 10 -9 •-1, which corresponds to values of
surface conductivity as large as 3.4 mS/m, a value which is
incompatible with the value 0.07 mS/m measured experimen-
tally [Ruffet et al., 1991]; and, second, the Kozeny-Carman
model [Scheidegger, 1974] is used to predict that surface con-
ductivity
approximately
scales
as k -ø's, where
k is the perme-
ability.
For a change
in permeability
from 10
-•6 to 10-•2 m 2,
as considered by Jouniaux and Pozzi [1995a], the surface con-
ductivity should increase by about a factor of 100. No experi-
mental evidence for such a large effect has been reported so far. The interpretation by Jouniaux and Pozzi [1995a] may
therefore have overestimated the role played by the surface
conductivity. It appears crucial therefore to measure the
streaming potential coefficient and the surface conductivity
simultaneously as a function of permeability.
Studying the permeability dependence of the streaming po-
tential coefficient also raises fundamental questions in rock
physics. Until now, the interpretations of the streaming poten-
tial results in rocks have been based on the Helmholtz-
Smoluchowski equation [Overbeek, 1960] derived for capillary
tubes. This equation relates the streaming potential coefficient
to the • potential and predicts that the streaming potential
coefficient has no intrinsic dependence on permeability, once
surface conductivity effects are taken into account. In the con-
text of porous media, Pride [1994] showed that the Helmholtz-
Smoluchowski equation was also valid when a statistical vol-
ume averaging procedure is used. However, this relation needs
to be tested experimentally, and this is the purpose of this
paper.
2. Streaming Potentials in Rocks
The conductivity (resistivity) of the rock sample is noted o- r
(Pt), while the conductivity (resistivity) of the electrolyte sat-
urating the pore space is noted o- l (9r). The rock conductivity
can be expressed as
{Yl o-!
-=--+
o-,.
= F
where F is called the formation factor, F o is the bulk formation factor, and the constant o-, is the surface conductivity.
2.1. EKE in Capillary Models
In the equivalent channel model of Kozeny and Carman
[Scheidegger, 1974] the pore space of the rock sample is rep-
resented by a capillary tube of section S c and length L c in a
typical volume of electrically insulating material of length L
and section S (Figure la). The ratio L•/L is known as the
hydraulic tortuosity r.
In this model the bulk formation factor F 0 can be written as
1/Fo = •/r:, (2)
where ß is the volume fraction of the pore space (porosity),
and the surface conductivity o- s as [Ishido and Mizutani, 1981]
S,
•rs:/•s .•, (3)
where k s is the surface conductance of the capillary and Si is its
specific internal area (internal pore surface area per volume of
rock sample).
The permeability k is given by
Sc S
(a)
(b)
(c)
(d)
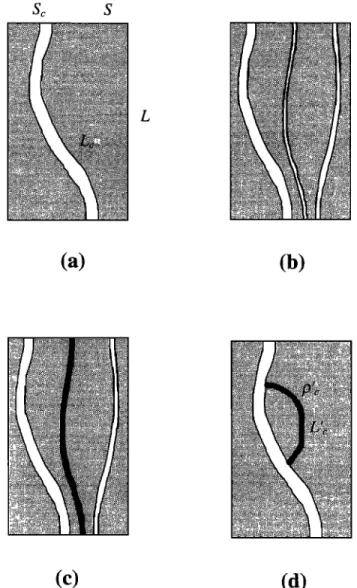
Figure 1. Various flow patterns in capillary tubes in a non-
conducting matrix: (a) one single capillary (equivalent chan-
nel), (b) distribution of capillary tubes of various diameters
and tortuosities, (c) distribution of capillaries including some
containing a nonflowing conducting medium (in black), and
(d) capillary tube with a branch containing a nonflowing con-
ducting medium.
(I)3
k = c S•r2,
(4)
where c is a constant depending on the geometry of the cap-
illary; c = 0.5 for tubes and 1/3 for cracks [Scheidegger, 1974].
If a pressure difference Ap is applied to the rock sample, the
resulting motion of the electrolyte results in an electrical con-
vection current I .... :
Sap
I .... : • -- -- (5)
rl Fo L '
where rl is the dynamic viscosity of the electrolyte, e is its
electrical permittivity [Overbeek, 1960; Ishido and Mizutani,
1981], and • is the electrical potential on the shear plane
[Bikerman, 1964; Lorne et al., this issue].
Let A V be the potential difference between the two ends of
the rock sample, taking the reference point for potential at the
LORNE ET AL.: STREAMING POTENTIALS FROM ROCK SAMPLES 17,881
electrical resistance of the rock sample, the conduction current
Icond is
Icond -- /XV/R. (6)
If the rock sample is electrically isolated, the conduction and
the convection currents are equal and the streaming potential
coefficient C s, defined by C s = AV/Ap, is given by the Helm-
holtz-Smoluchowski equation [Overbeek, 1960; Ishido and Mi-
zutani, 1981; Pride, 1994; Revil et al., 1996]
AV e
Cs
= X-tip: p4;.
(7)
with (equations (5) and (6))
G = F/Fo. (8)
This relationship remains valid if the rock is modeled by a
distribution of independent capillaries of various sizes (Figure
lb) and if some of these capillaries are electrically conducting
but nonflowing (Figure lc). More generally, (8) has also been
shown to hold in the context of a pore space volume averaging
procedure [Pride, 1994]. However, some situations where this
relation may not be valid are discussed in section 2.2.
2.2. Effect of Independent Hydraulic and Electrical
Networks
Imagine that the patterns of electrical and hydraulic path- ways do not coincide. On the one hand, all the pores contrib- uting to the permeability must contribute to the electrical con- ductivity. On the other hand, very tiny pores or conducting
mineral phases, like sulfides or carbon, may contribute to the
electrical connectivity although they may not participate in the
hydraulic network.
Consider, for example, the hypothetical rock sample de- picted in Figure l d. It has a capillary tube with a branch of a noncirculating conductive phase of length L 'c. If the surface
conductivity is neglected, one has F/Fo = 1. However, in such
a model, assuming that the conductance of the branching chan-
nel is much larger than the conductance of the channel with
electrolyte, the electrical path is reduced compared with the hydraulic path by a factor L 'c/Lc, and one has
Lc-L;
G = L•'
(9)
and (8) is violated.
This example of a different percolation path for the hydrau-
lic and electrical flows may not be a purely theoretical case. In
a real rock, there are always several interconnected percolation
networks and at least a bulk pore space conductivity and a
grain surface conductivity. Surface roughness can also create
locally different directions for fluid flow and the electric cur-
rent in a single fracture or joints [Brown, 1987, 1989; Walsch et
al., 1997; Glover et al., 1997a].
To describe this effect, David [1993] introduced the concept
of hydraulic and electrical tortuosities % and %, defined in the
context of the equivalent channel model of Kozeny-Carman by 2
1/ F o = (I) / 'r e
tI)
3
(10)
k:c 2 2. St Th
On the basis of a reasonable number of network calculations,
David [1993] found that the hydraulic tortuosity is larger than
the electrical tortuosity by a factor of 1.5. In this context, the
convection current (equation (5)) would scale like 1/rh, the
resistance would scale like 1/%, and one would expect a rela-
tionship of the type
G • reit h. (11)
Let us consider the quantity defined by
Fo
Ro = G F'
(12)
This quantity R G is expected to be related to the electrical
efficiency of the hydraulic network and should be <1. By con-
trast, the factor F/F o expresses the hydraulic efficiency of the
electrical network. Our approach in this paper is to obtain
some estimates of RG from measurements of the streaming
potential and the resistivity for intact rock samples.
In the following, the streaming potential coefficient will be corrected from surface conductivity effects using an experi- mentally measured value of the ratio F/Fo:
F
ro Of
R(po)
'
(13)
where P0 is a value of the electrolyte resistivity for which the
electrolyte bulk conductivity dominates the sample conductiv-
ity.
Correcting the streaming potential coefficient for surface
conductivity effects using the ratio F/F o obtained from (13),
the inferred s r potential, called the effective potential and
noted Sreff, is
Cs Fo
geff: -14 (14)
pfF'
with Cs expressed
in mV/0.1 MPa, s
r in mV, and 9/in tim. A
value of 7 x 10 -•ø F/m has been assumed for the water per-
mittivity, and a value of 10 -3 Pa s has been assumed for the
water viscosity at 25øC.
Using the definition of the Ro factor (11), the effective g
potential is related to the true s r potential by the relationship
geff(Pf, rock) = R•(pf, rock)sr(pf, minerals). (15)
The parameter Ro in general depends both on the rock and
the electrolyte properties. The true s r potential depends only on
the properties of the mineral-electrolyte interface because the
effect of the pore size on the s r potential is negligible [Pride and
Morgan, 1991; Pride, 1994; Lome et al., this issue, appendix]. In
crushed samples, which are far above the percolation thresh-
olds, the effects due to differences in the electrical and hydrau-
lic flows will be assumed to be negligible, and therefore the
measured s r potential with crushed samples provides the true s r
potential.
3. Experimental Setup
3.1. Sample Assembly and Triaxial Cell
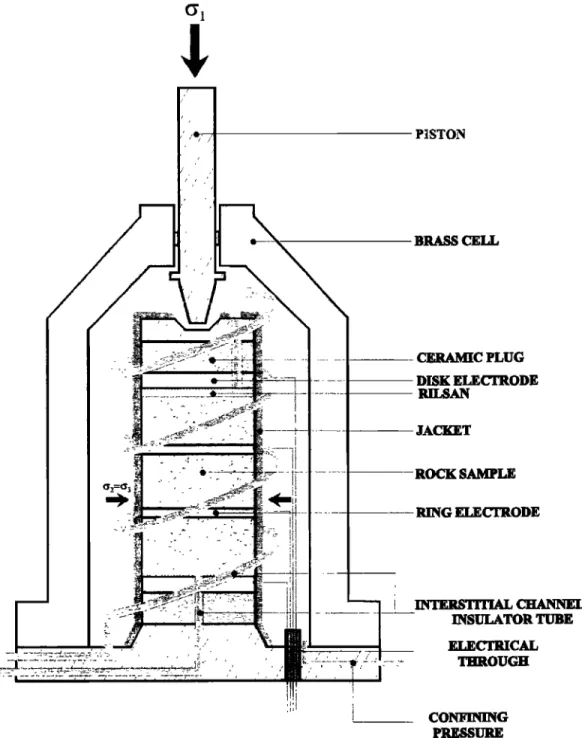
The triaxial cell is shown in Figure 2, and an overview of the
experimental setup is shown in Figure 3. Stainless steel 5 mm
thick electrodes are placed at both ends of the rock sample,
which has a diameter of 36 or 30 mm and a length of 72 mm.
A sheet of tissue (Rilsan) is inserted between the electrode and
the rock sample to ensure a good electrical contact between the rock sample and the electrode (M. Darot, personal com-
PISTON BIIA• CELL •C PLUG DISK ELEC"TRODE JACKET ROCK SAMPLE RING ELECTRODE INTER$TITIAL CHANNEL INSUI•TOR TUBE EIJ•CTRIC• THI•OUGH CONFINING PRF..•URE
Figure 2. The triaxial cell used for streaming potential and resistivity measurements using rock samples.
munication, 1994). Ceramic plugs with a thickness of 5 mm are
inserted between the stainless steel base of the cell and the bottom electrode, and the stainless steel cap and the upper
electrode. A polymer jacket (Rhodorsil) is formed around the
sample assembly in a polymer mold, which is then removed. In
addition, a heat shrinkable sleeve encases the ceramic plug and
the electrode as well as the top 1 cm of the rock in order to avoid fluid circulation between the sample and the jacket. Contact areas between the jacket and the tubes are sealed by silicon glue.
The interstitial fluid is circulated out of the sample through
1.2 m long stainless steel tubing. In order to prevent any con-
tact between the interstitial fluid and the metal pieces of the
assembly, a Teflon tube with an inner diameter of 0.81 mm and
a outer diameter of 1.63 mm is inserted in the stainless steel
flow channel (Figure 2). This polymer tubing reaches to the
rock sample through the ceramic plug and the electrode. It can
be used up to internal pressures of 18 MPa. Another slightly
larger tube was similarly inserted in the inlet flow channel. In
order to prevent collapse of the small tubes under pressure, a
syringe needle is inserted in the end of the tubes near the electrode, at the contact point with the Rilsan. The polymer
tube suppresses any leakage resistance parallel to the rock
sample and also protects the electrolyte from chemical con- tamination by the brass metal pieces.
LORNE ET AL.' STREAMING POTENTIALS FROM ROCK SAMPLES 17,883
PH
METER
- FORCE
- DISPLACEMENT
TRANSFER FLUID
150 MPa PRESSURE CONTROLLER
- INTERSTITIAL PRESSURE ß Pi - VOLUME CHANGE: Vi
200 MPa PRESSURE CONTROLLER
- CONFINING PRESSURE ß Pc - VOLUME CHANGE: Vc
--• VOLTMETER
I
'• IMPEDANCE
METEl/
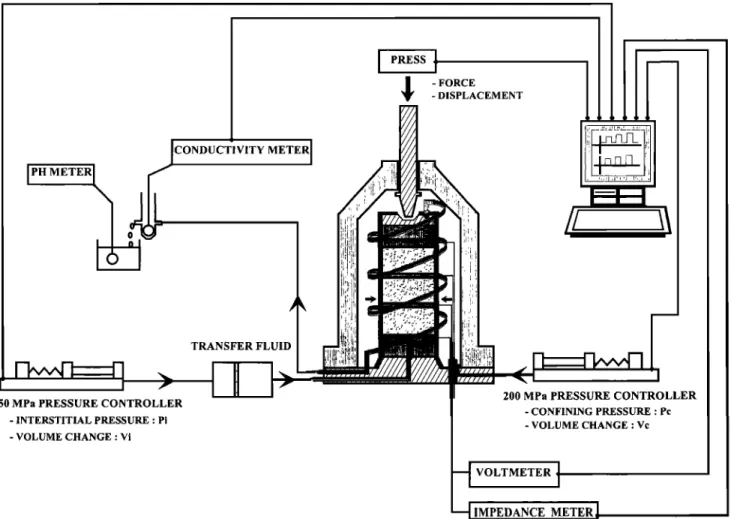
Figure 3. The experimental setup used for streaming potential and resistivity measurements using rock
samples.
sample through a degassed distilled water circuit connected to
an external pressure controller which has a maximum range of
200 MPa (Figure 3). The interstitial fluid is contained in a
transfer cell (volume 180 mL) connected to an external pres-
sure controller of 150 MPa maximum range. The electrolyte is
circulated from the bottom to the top of the sample, but the
direction of the flow can be reversed if needed. The electrolyte
that has circulated in the rock sample is collected after flowing
through a conductivity cell for pH measurement for chemical
analysis. The maximum flow rate possible for the interstitial
fluid is 6 mL/min. The pressure generators provide a precision
of 1 mm 3 on the volumes. The precision of these generators for
measuring pressure is, however, not adequate for all experi-
ments, and a pressure transducer having an accuracy of 0.35
kPa and a maximum pressure of 250 kPa is connected to the
entrance of the interstitial fluid loop. The maximum interstitial
pressure used during the experiments was 200 kPa for most
samples. For some samples a maximum pressure of 1.5 MPa
was used, and for this pressure range the pressure measure-
ment from the pressure generator transducer was used.
Uniaxial force is applied from the top by a press held by two
columns whose rigidity is > 10 TM Pa. The maximum force is 100
kN, corresponding to a pressure of 98 MPa for a 36 mm
diameter sample and 140 MPa for a 30 mm diameter sample.
The press can be servocontrolled in force or displacement.
The pressure, conductivity, pH, and electrical measurement
devices are described by Lorne et al. [this issue]. Flow rates,
pressures, force, displacement, conductivity, and electrical
measurements are recorded with a sampling time of 1 s.
3.2. Permeability Measurements
The permeability
is computed
from the volume
flow given
by
the pressure
generators
(accuracy
of +1 mm
3) and the pres-
sure gradient, taking into account the head loss in the circuit.
The head loss is dominated by the pressure gradient along the
small polymer tubing at the outlet and amounts to 10 kPa for
a flow rate of 6 mL/min. The calculated value was experimen-
tally checked without any rock sample in the cell. The smallest
measured permeability in the experiment was 0.1 mdarcy
(10
-16 m2). Most samples
used
for the measurements
in this
paper
had a permeability
larger
than 10 mdarcy
(10-•4 m2).
3.3. Chemical Measurements
The electrolytes were prepared as by Lorne et al. [this issue]
using KC1 as a salt, with a pH of 5.7. The solutions flowing out
of the samples were sampled during some experiments in order
to check for contamination of the electrolyte by the rock and to
monitor chemical changes during deformation. The dominant
ion content of the samples was determined by electrophoresis.
3.4. Electrical Measurements
The stainless steel electrodes were stable enough to measure
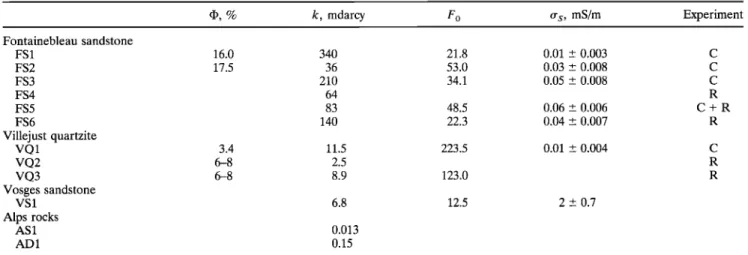
Table 1. Main Characteristics of the Rock Samples
•, % k, mdarcy F 0 ors, mS/m Experiment
Fontainebleau sandstone FS1 FS2 FS3 FS4 FS5 FS6 Villejust quartzite VQ1 VQ2 VQ3 Vosges sandstone VS1 Alps rocks AS1 AD 1 16.0 17.5 340 21.8 0.01 + 0.003 C 36 53.0 0.03 +_ 0.008 C 210 34.1 0.05 _+ 0.008 C 64 R 83 48.5 0.06 _+ 0.006 C + R 140 22.3 0.04 _+ 0.007 R 3.4 11.5 223.5 0.01 _+ 0.004 C 6-8 2.5 R 6-8 8.9 123.0 R 6.8 12.5 2 + 0.7 0.013 0.15
For each sample, the initial porosity ((I)), permeability (k), bulk formation factor (F0), and surface conductivity (0rs) are given. C stands for compaction experiment, and R stands for rupture. The porosity was measured by mercury injection (see text).
Lorne et al., this issue]. The quality of the stainless steel was
found, however, to be a critical factor for stability, and SS316L
steel was used, as in marine applications. Poorer quality steels,
brass, or copper showed corrosion after dismantling and were
unstable. Platinum electrodes provide good electrical contacts
for resistivity measurements [Locknet and Byeflee, 1985; Ruffet
et al., 1991; Glover et al., 1994], but the measurement of
streaming potentials using platinum electrodes can be affected
by large motoelectrical potentials [Ogilvy et al., 1969] depend-
ing on the electrode arrangement and the setup. Silver elec- trodes [Morgan et al., 1989] could not be used in our pressure
cell.
In contrast to the setup used by Jouniaux and Pozzi [1995b],
the small tubes inserted in the interstitial flow channels pre-
vented leakage resistance in parallel with the rock sample. The
small tube also prevented electrolyte leakage into the confining
pressure reservoir, which would also produce leakage resis-
tance. The potential measurements were extremely stable with
this setup (measured drift of the order of 1 mV/h or smaller),
and no difference was seen in the DC value of the electric
potential if one of the electrodes was connected to either the
ground of the cell or the ground of other measuring devices.
3.5. Rock Samples and Experimental Protocol
The main characteristics of the rock samples used for the
experiments presented in this paper are listed in Table 1. Most
measurements were performed using prediagenetic Fontaine-
bleau sandstone, for which most experimental data exist. We
also made measurements on other types of rocks. The porosity
was determined by mercury injection in samples drilled from the same block of rock used to obtain samples for streaming
potential measurements, since after mercury injection, electri-
Cal measurements could not be made. Thus porosity of the
samples is not measured for the same samples as those used for
electrical measurements, except for samples FS1 and FS2 after
compaction, whose porosity was measured after all streaming
potential measurements were completed.
The Fontainebleau sandstone contains >99% quartz with
traces of calcareous cement, with an average grain size of 125
/•m. The Villejust quartzite contains >99.5% quartz, with an average grain size of 200/•m. The grains of the quartzite are rounded, closely imbricated, producing a small porosity (5-
8%) and a permeability near the percolation threshold [e.g.,
Duplessis and Roos, 1994; Knackstedt and Duplessis, 1996]. The
Vosges sandstone contains a mass fraction of 3-4% of oxides
and -11% clay [David et al., 1994]. We also measured a sample
of calcareous Permian sandstone (AS1) and a sample of cel-
lular dolomite (AD1) collected at a geological contact in the
Alps [Perrier et al., 1998; Trique et al., 1999].
After installation in the triaxial cell the sample is cleaned by
circulating degassed pure water with a conductivity varying
between 5 x 10³ and 104 llm (depending on impurities leached
from the rock) for >1 day. Next, the electrolyte is circulated
through the sample, and the conductivity is monitored at the
outlet. After a stabilization time which depends on the sample
permeability, the output conductivity as well as the rock resis-
tance become stable.
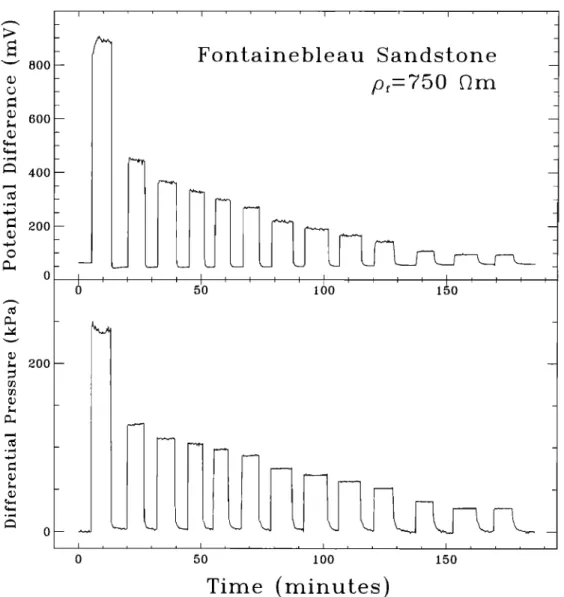
The streaming potential A l/is then measured for several
pressure gradients Ap. A typical streaming potential experi-
ment is shown in Figure 4. A stable value of electrical potential
is reached a few minutes after the pressure gradient is estab- lished. The measured equilibrium potential is corrected for
electrode drift assuming a linear variation during the time the
electrolyte is flowing and is plotted in Figure 5 as a function of
the pressure gradient corrected for head loss. The potential is
linearly proportional to the pressure, and the streaming poten-
tial coefficient Cs is the slope of this curve. During most ex- periments, pressure gradients <30 kPa were used to avoid changing the stress state of the rock, and the experimental
uncertainty on the streaming potential coefficient varied from
30% for a streaming potential coefficient of 40 mV/0.1 MPa to
2% for a streaming potential coefficient of 1000 mV/0.1 MPa.
Possible edge effects on the sample were estimated by com-
paring the potential differences measured between various po-
sitions along the sample. For this purpose, some experiments were performed with some additional electrodes made of
stainless steel rings wrapped around the rock cylinder. The
results of one of these experiments are shown in Figure 6,
where the potential difference between one disk electrode and
one ring electrode near the center of the sample is compared
with the symmetric combination on the other side of the sam-
ple. The measurements on both sides of the sample are in
agreement, with a standard deviation of 7.5 mV for an average
LORNE ET AL.' STREAMING POTENTIALS FROM ROCK SAMPLES 17,885 '• 800 • 600 • 4oo • •oo o • 200 I I I I
Fontainebleau
Sandstone
p-750
0 50 100 150 I : : I I i ] i i i 0 50 100 150Time (minutes)
Figure 4. A typical streaming potential measurement with Fontainebleau sandstone. The electric potential
reference is taken at the high-pressure end (convention of Morgan et al. [1989]). A positive potential difference
(i.e., a positive streaming potential coefficient) corresponds to a negative • potential. A single measurement
of streaming potential takes <10 min to reach a stable value. The electrode drift during that time is in general
<1 mV.
within 10% along the sample. This conclusion, however, can
not be generalized for any rock sample. Some samples may be
more heterogeneous, especially rocks from the Alps containing
veins of quartz or calcite, and this may explain most of the variations observed from sample to sample. When measure- ments were repeated on the same sample after several days, the values of the streaming potential coefficient were repro- ducible within a few percent if the permeability had not
changed.
The formation factor was computed from the measured re-
sistance of the rock sample at I kHz, and the bulk formation
factor and surface conductivity were determined using (1).
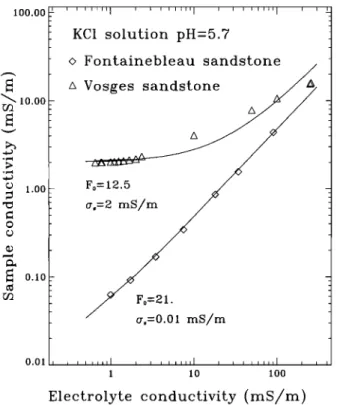
Results are shown in Figure 7 for the Vosges sandstone (VS1)
and one sample of Fontainebleau sandstone (FS1) after com-
paction. Values for surface conductivity found in this experi-
ment are in good agreement with the measurements of Ruffet
et al. [1991] for Vosges sandstone. For Fontainebleau sand-
stone our results range from 0.01 to 0.06 mS/m (Table 1),
whereas Ruffet et al. [1991] obtained slightly larger values from
0.07 to 0.09 mS/m. Values as large as 0.5 to 0.7 mS/m have been measured for some samples of Fontainebleau sandstone (P.
Glover, private communication, 1997). Such large values tend
to be typical of sandstones such as Berea or Darley Dale
sandstone containing significant proportions of clays [Glover et
al., 1994].
In the Kozeny-Carman model, combining (2), (3), and (4),
one can write
as
= ks F/2
.
(16)
Our estimates of the surface conductivity in Fontainebleau
sandstone, listed in Table 1, do not support this simple predic-
tion, used by Jouniawc and Pozzi [1995a]. For example, accord-
ing to (16), sample FS2 should have a surface conductivity reduced by a factor 0.8 compared with sample FS1, but the
experimental value for FS2 is 3 times larger than the value for
looo
800
600
400
200
0 0 Fontainebleau Sandstonep,= 750 •]m
50 100 150 200Pressure Gradient (kPa)
25O
Figure 5. Potential difference as a function of the pressure gradient for the experiment shown in Figure 4. The experimen- tal errors are of the order of the size of the symbols. This
experiment yields a positive streaming potential coefficient of
350 mV/0.1 MPa. lOO o 60 0 o o o 40 , , , I , , , 40 60 80 100
Potential
1-4 (mV)
Figure 6. The potential difference between disk electrode 1 and ring electrode 4 compared with the potential difference between ring electrode 5 and disk electrode 8. The position of
the electrodes is shown. The various measurements corre-
sponds to several steps during the uniaxial deformation of the
sample. 100.00 • 1 o.oo o 1 .oo ¸ • 0.10 0.01 KC1 solution pH=5.7 Fontainebleau sandstone Vosges sandstone
Fo=
12.5 /
Fo=21.
/ or,=0.01 mS/m 1 10 100Electrolyte conductivity (mS/m)
Figure 7. The conductivity of the rock sample versus the
conductivity of the KC1 solution, for a sample of Fontainebleau
sandstone (FS1, compacted) and a sample of Vosges sandstone
(VS1). The curve for Fontainebleau sandstone corresponds to
a least squares adjustment of equation (6) to the data. The
curve for the Vosges sandstone corresponds to the values for
the bulk formation factor and the surface conductivity given by
Ruffet et al. [1991], illustrating the good agreement of the resistivity data of the present experiment with the results of Ruffet et al. [1991]. The experimental errors (not including
poorly known sample to sample variations) are of the order of
the size of the symbols.
surface conductivity 40% larger than sample FS 1, but the mea-
sured value for FS6 is 4 times larger than the value for FS1.
This indicates the importance of other factors determining the
surface conductivity (i.e., the proportion of clay impurities or
the presence of particularly calcareous surface coatings).
Therefore it is preferable, as discussed in section 2.2, not to
rely on the Kozeny-Carman model but to measure the ratio
F/F o to correct the streaming potential coefficient for surface
conductivity.
In Figure 8 the F/F o factor determined using (13) is shown
for one sample of Fontainebleau sandstone as a function of the
electrolyte resistivity. For this sample this factor is >0.9 (i.e., a
surface conductivity correction of Cs < 10%) for electrolyte
resistivity <600 Dm.
4. Experimental Results Without Deformation
and Discussion
4.1. Comparison With Crushed Samples and Effect or Electrolyte Resistivity
The effective • potentials, inferred from streaming potential
measurements using (14), are presented as a function of elec-
trolyte resistivity in Figure 9 for Fontainebleau sandstone and
in Figure 10 for Villejust quartzite.
LORNE ET AL.' STREAMING POTENTIALS FROM ROCK SAMPLES 17,887 1.2 0.8 Fontainebleau Sandstone A A Fo=21 .01 mS/m Fo=21 •
o'
-•0.05
mS/m
•
100 1000 10000Electrolyte Resistivity (f•m)
Figure 8. The streaming potential correction factor F/F o, as
derived from the measurements of rock and electrolyte con-
ductivity measurements for one sample of Fontainebleau sand-
stone (Figure 7). The full line corresponds to the calculated
value assuming a bulk formation factor of 21 and a surface
conductivity of 0.01 mS/m. The dotted line corresponds to the
calculated value assuming a bulk formation factor of 21 and a
surface conductivity of 0.05 mS/m.
varies between -20 and -30 mV (Figure 9). For values of the
electrolyte resistivity •<200 am the •eff potentials measured for
rocks are compatible with those from crushed samples [Lome
et al., this issue]. The variation with electrolyte resistivity pre-
dicted by the three-layer model based on the work of Davis et
al. [1978] is also valid for the rock samples. For electrolyte
resistivities >200 am the • potentials measured for rocks are
systematically smaller than those for crushed samples, and the
discrepancy increases with increasing electrolyte resistivity.
The Fontainebleau samples used in this experiment are
poorly cemented and easily disaggregated without producing
fresh crack surfaces in the quartz grains of the rocks. The
surface properties of the disaggregated grains are therefore
likely to be similar to the surface properties of the grains in the
intact rock sample. In addition, the • potential measured with
the crushed sample was changed by <10% by an acidic treat-
ment [Lorne et al., this issue]. Furthermore, any difference in
the • potential due to differences in surface state between
disaggregated and intact samples should also be observed at
the lower values of the electrolyte resistivity. As this is not the
case (Figure 9), we conclude that the comparison between rock
samples and crushed samples may be used to infer a value of
the R G factor (RG = •eff/•crushed) '-'" 0.5 at 1000 II m.
The value of the F/F o correction factor calculated via (13)
varies from unity at 30 llm to 0.9 at 600 llm and 0.75 at 1000
llm (Figure 8) for sample FS1. The measurement of large rock
resistivity can be problematic, but it would probably lead to an
underestimation of the resistance, hence an overestimate of
the surface conductivity, and, consequently, an underestimate
of the F/F o factor. However, the F/F o factor needed to match
the • potential values for crushed and rocks samples is smaller
than that measured. If the calculation of the F/F o factor using
¸ • 20 Crushed Sample [] FS1 /x FS2 + FS4 • FS5
x FS6
A •o
•ø•
+ pH - 5.7 0 , , ,,110 , i , • J i i , I , • , , 100 10100 Electrolyte resistivityFigure 9. The effective • potential, inferred from streaming
potential measurements using Fontainebleau sandstone rock
samples, as a function of the KC1 solution resistivity. The data
are compared with measurements obtained for crushed sam-
ples [Lorne et al., this issue]. The curve corresponds to a the-
oretical prediction for the quartz-KC1 interface obtained with
a three-layer numerical model of the electrical double layer [Lorne et al., this issue], based on the work of Davis et al.
[1978]. When not indicated, the experimental errors are given
by the size of the symbols.
(13) is correct, then there must be another physical origin for
the Ro factor for electrolyte resistivities >200 tim.
The results in Figure 9 agree with the previously reported
values for • potential of Fontainebleau sandstone of -21.9 mV
[Jouniaux and Pozzi, 1995b] and -17 mV [Jouniaux and Pozzi,
1997]. However, the value of -97 mV mentioned by Jouniaux
and Pozzi [1995a] is not compatible with our data. This value
may have been overestimated because the electrolyte resistivity
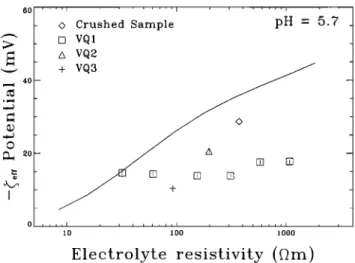
¸ • 20 0 Crushed Sample [] VQ1 /x VQ2 + VQ3 I pH - 5.7 11o 1 oo 1 oloo
Electrolyte resistivity (f•m)
Figure 10. The effective • potential, inferred from streaming
potential measurements using Villejust quartzite rock samples,
as a function of the KC1 solution resistivity. The data are
compared with one measurement obtained for a crushed sam-
ple [Lome et al., this issue]. The curve corresponds to a theo-
retical prediction for the quartz-KC1 interface obtained with a
three-layer numerical model of the electrical double layer [Lorne et al., this issue], based on the work of Davis et al.
[1978]. When not indicated, the experimental errors are given
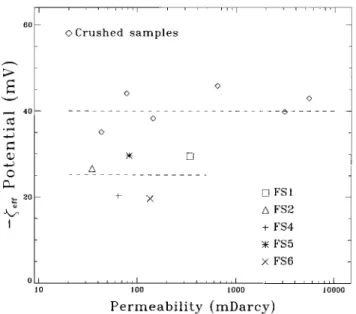
• 2o Crushed samples cl FS1 •2 FS2 + FS4 • FS5 x FS6 I 100 1000 Permeability (mDarey)
Figure 11. The effective •' potential, inferred from streaming
potential measurements using Fontainebleau sandstone rock
samples, as a function of permeability for a KC1 solution of 400
am resistivity and pH = 5.7. The data are compared with
measurements obtained for crushed samples [Lome et al., this
issue]. The error on each individual measurement is given
approximately by the size of the symbols. The indicated bands
(dotted lines) around the average values (dashed line) indicate
a one standard deviation error reflecting sample to sample variations.
was measured as 1000 11m at the output of the sample. The
initial resistivity of the electrolyte, which at the input was pure
water at pH = 5 [Lome et al., this issue], was certainly higher
than this (>5000 llm). A higher resistivity would result in
lower values of the •' potential calculated from (14).
For Villejust quartzite data shown in Figure 10 the effective •' potentials inferred from the streaming potentials measured
for intact rocks are smaller than those calculated from the
streaming potentials measured for a crushed sample for elec-
trolyte resistivities >30 11m. The formation factor of Villejust
quartzite is larger (Table 1) and the F/Fo factor smaller (0.27
at 1000 llm) than for the Fontainebleau sandstone. Other rock
samples also show smaller •' potentials when compared with the crushed samples. For example, the •'eff potential for a
crushed Vosges sandstone is measured to be -15.6 f•m at p•,, -
80 11m, while values ranging between -7 and -12 mV are
measured for a rock sample containing an electrolyte with p•,, =
385 llm. The range in values is caused by the uncertainty in
the value of surface conductivity used for the calculation of the
F/F o factor. In the case of the Vosges sandstone, which has a
high surface conductivity of 2 _+ 0.7 mS/m (Figure 7), the value
of F o cannot be measured directly and must be inferred. Thus
a small change in the value of the surface conductivity pro-
duces a large variation of the F/F o factor. Other rocks (ASI and AD1) have •' potentials smaller by a factor of 2 to 4 compared with the crushed samples.
To summarize, for electrolyte resistivities larger than •100
11m the effective •' potentials calculated from the streaming
potentials measured for intact rocks are systematically smaller
than those calculated from the streaming potentials measured
for crushed samples. This can be interpreted as a difference in
surface state between the crushed and intact samples. How-
ever, for smaller values of the electrolyte resistivity the effec-
tive •' potentials calculated for the rock samples are consistent
with those calculated for the crushed samples. We therefore
find it more plausible that the data indicate that the R G factor
is <1 and that the streaming potential is affected by a rock-
dependent geometrical factor more complex than F/F o. This
factor would vary rapidly for samples near the permeability percolation threshold and hence would be quite different for
crushed and intact rock samples. The data also imply that this
factor is important in the domain where surface conduction
becomes the dominant mechanism of electrical conduction,
perhaps as a result of an interaction between the electrical
double layer and the electrical flow pattern. For our hypothesis
that the R G factor is smaller than unity to be correct, we require the true •' potential in the rock to be equal to the •'
potential in the crushed sample. Because the results using rock
samples and crushed samples agree for electrolyte resistivities
smaller than about 100 llm, crushed samples containing elec-
trolytes with such resistivities may be used to esimtate the •'
potentials of rocks with permeabilities too small for direct streaming potential measurements.
4.2. Comparison With Crushed Samples and Effect of Permeability
The effective •' potentials for Fontainebleau sandstone are
presented as a function of permeability in Figure 11. They are
compared with measurements obtained for crushed samples
[Lome et al., this issue]. The values measured for intact rock
samples are systematically lower than the values obtained for
crushed samples. No clear dependence as a function of per-
meability appears for th-e crushed or intact rock samples. How-
ever, the scatter of the data points may mask a permeability
dependence of the effective •' potential, and hence of the Ro
factor. In order to study the possible permeability dependence
of the effective •' potential we studied samples during compac-
tion. The results of such compaction experiments are pre- sented in section 5.
5. Experimental Results During Deformation
and Discussion
5.1. Compaction
Five samples were studied during compaction: FS1, FS2,
FS5, FS6, and VQ1 (Table 2). Each was hydrostatically com-
pacted by increasing the confining pressure from 0.2 MPa to a
maximum value varying between 3 and 10 MPa (Table 2). We
observe a reduction of the permeability by a factor of 4 to 7 for
the Fontainebleau sandstone samples and a factor of 2 for the
Villejust quartzite sample. David et al. [1994] parametrized the
permeability as k •exp(-TPeff) , where Peff is the effective
Table 2. Characteristics of the Rock Samples Used During
Compaction
Maximum
Confining
Pressure Permeability, Formation Porosity,
Sample (0.1 MPa) mdarcy Factor %
FS1 80 340-53 21.3-22.7 17.5-15 FS2 100 33-6 49-64 17-10 FS5 30 83-23.5 38-50
FS6 30 135-70 18.9-20.2
LORNE ET AL.: STREAMING POTENTIALS FROM ROCK SAMPLES 17,889 AAAAAAA • AAA COmpaction + FS1 A FS2 [] Vql lOO Permeability (mD)
Figure 12. Bulk formation factor and surface conductivity as
a function of permeability for three rock samples during com-
paction. The experimental error on the values of the formation
factors is indicated by the size of the symbols.
pressure. The 3/parameter calculated for Fontainebleau sand-
stone
(Table 2) varies
from 17 to 42 x 10-3/0.1 MPa and is
larger than the value of 9.8 x 10⁻³/0.1 MPa reported by David
et al. [1994], indicating that our samples are rather poorly cemented. Our 3/parameter values are comparable with the
values reported by David et al. [1994] for other sandstones. The
3/parameter for the Villejust quartzite sample VQ1 is 8 x 10⁻³/0.1 MPa and indicates a difference in mechanical behav-
ior of the quartzite compared with sandstone during compac-
tion.
At each step during the compaction of a sample the forma-
tion factor and the streaming potential were determined. For
samples FS5 and FS6 the measurements were made at a fixed
electrolyte resistivity of 30 and 200 am, respectively. To cal-
culate the rock sample resistivity from the measurement of its
resistance, we assumed that the length and cross section of the
sample remain constant during compaction. The small varia-
tion of the rock sample resistivity due to the change of length
and cross section was therefore not taken into account, as the
change of length and cross section of the rock samples was not
monitored during our experiments. Note, however, that the main purpose of the measurement of the resistance is the
calculation of the ratio F/F o through (13). For this ratio, and
consequently for the determination of •eff, the length and cross
section of the sample are irrelevant.
For samples FS1, FS2, and VQ1 the following procedure was
used. At each step in confining pressure, the KC1 electrolyte
solution was changed from 10 to 1000, 600, 300, 150, 60, and 30
am and back to 10 am. The confining pressure was then
increased with the 10 am electrolyte in the sample. The bulk
formation factor and the surface conductivity were determined
using (1) and are shown in Figure 12 as a function of perme-
ability. The formation factor increases slightly during compac-
tion, while the surface conductivity remains stable within ex- perimental errors.
The evolution of the formation factor, porosity, and perme- ability during compaction may be parametrized, in a manner
similar to that of Bernabd [1991], as F • k p, cI) • k q, and F •
cI) m with m - p/q. The data for the formation factor in Figure
12 are well represented by such a simple parametrization. The
values calculated are given in Table 3. The q parameter is the
inverse of the a parameter of David et al. [1994], who measured
a • 20 (q • 0.05) for Fontainebleau sandstone. Our results
for FS1 are compatible with those of David et al., [1994], but
the other samples have larger q. Thep parameter corresponds
to - l/r, where the r parameter is defined by Bernabd [1991].
For crystalline rocks a value of -0.5 for the p parameter (r =
2) is reported by Bernabg [1995]. Our values for Fontainebleau
sandstone are significantly smaller, p = - 0.04 for FS1 and
p - - 0.18 for FS2 (Table 2). The value ofp = -0.33 for
quartzite, however, is similar to the valuep = -0.5 quoted by
Bernabd [1995].
The surface conductivity may be similarly parametrized as
rr s • k s. The Kozeny-Carman model (see equation (16))
predicts • = - (1 + 3p)/2. This relationship is compatible
with the two data points for Villejust quartzite in Figure 12 and
Table 3. For Fontainebleau sandstone the surface conductivity
remains constant within experimental error during compac- tion, although (16) predicts that there should be an increase.
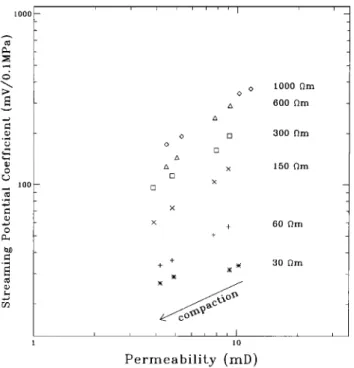
The streaming potential coefficients measured during com-
paction for each electrolyte resistivity are shown in Figure 13
for FS1 and FS2 and Figure 14 for VQ1. The streaming po-
tential coefficients for each electrolyte resistivity are continu-
ous as a function of permeability, which illustrates the repro- ducibility of the measurements. The streaming potential
decreases significantly by a factor of 2-10 as the permeability
decreases during compaction. The ratio F/F o is measured si-
multaneously and shown as a function of permeability in Fig-
ure 15 for FS1 and FS2 and in Figure 16 for VQ1. The ratio
decreases by a maximum of 10-20% during compaction for
FS1 and FS2 (Figure 15) and is constant during compaction for
VQ1 (Figure 16). A change in the ratio F/F o to explain the
change in the streaming potential coefficient may therefore be
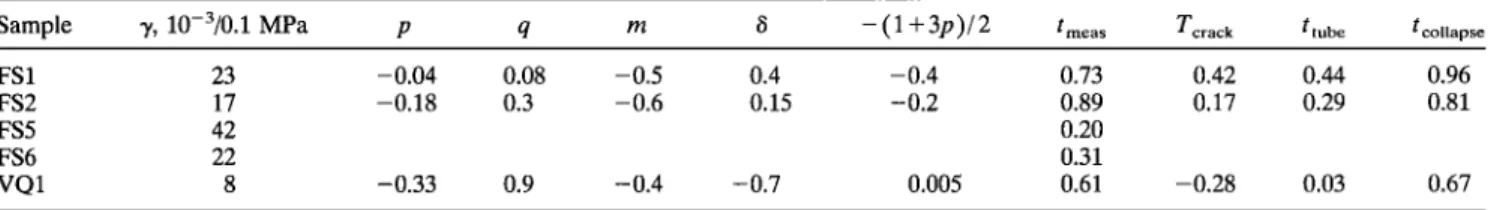
Table 3. Power Law Coefficients Determined for the Rock Samples During Compaction
Sample % 10-3/0.1 MPa p q m • - ( 1 + 3p)/2 t .... T .... k ttube tcollapse
FS1 23 -0.04 0.08 -0.5 0.4 -0.4 0.73 0.42 0.44 0.96 FS2 17 -0.18 0.3 -0.6 0.15 -0.2 0.89 0.17 0.29 0.81
FS5 42 0.20
FS6 22 0.31
VOl 8 -0.33 0.9 -0.4 -0.7 0.005 0.61 -0.28 0.03 0.67
The measured t parameters for FS1, FS2, and VQ1 are the values averaged over the various fluid resistivities. The meanings of the p, q, m,
1000 finn
•oo
•m-
300
tim
150
tim
60 timso
•m
10 •mFigure 13. Streaming potential coefficient as a function of
permeability for various electrolyte resistivities during compac-
tion for Fontainebleau sandstone samples FS1 and FS2. The
experimental errors are given by the size of the symbols.
FS2 FS1 ß ß • 30 tim 1.0 • x 60 tim + + + + + + [] 150 tim [-• + + [] 300 tim + + • 600 Qm
• 0.8
+ + x
O
x+
• x x• • B 1000 tim 0.6 0.4 , , ,•,l , , , , , ,, •l , , , , , ,, 10 100 Permeability (reD)Figure 15. The ratio F/F o, determined using equation (10),
as a function of permeability for various electrolyte resistivities
during compaction for Fontainebleau sandstone samples FS1
and FS2.
excluded.
The fact that the reduction
of streaming
potential
coefficient during compaction is also observed for the smaller
values of the electrolyte resistivity also indicates that this vari-
ation is not due to the contribution of surface conductivity,
which
is important
only for a resistive
electrolyte
(9œ
> 600
l•m, equation (1) and Figure 8).
1000 ¸ ¸ [] a a [] [] x x 1000 tim 600 tim + + • 300 tim 150 Om 60 tim 30 tim Permeability (mD)
Figure 14. Streaming potential coefficient as a function of
permeability for various electrolyte resistivities during compac-
tion for Villejust quartzite sample VQ1. The experimental errors given by the size of the symbols.
5.2. Discussion of the Observations
During Compaction
These data support our hypothesis that the streaming po-
tential coefficient not only depends on the •' potential but is
also sensitive to the rock structure. Since the measured change
of the F/Fo factor is of the order of 10% only (whereas changes
by a factor of 2-10 would be needed to account for the change
+ + + + 60 Qm x x x x 150 tim [] [] [] [] 300 0m A ZX a a 600 tim o.o , , , , , , , • 1 lO Permeability (mD) 1000 tim
Figure 16. The ratio F/Fo, determined using equation (10),
as a function of permeability for various electrolyte resistivities
LORNE ET AL.: STREAMING POTENTIALS FROM ROCK SAMPLES 17,891
in Cs), the reduction of Cs must arise from a reduction the R G factor. During compaction, electrical and hydraulic networks are affected differently. The data indicate that the hydraulic network is evolving faster than the electrical network during
compaction.
The streaming potential coefficient during compaction is
parametrized as Cs or •'eff m kt. The values for the t parameter
are shown in Figure 17 as a function of electrolyte resistivity. As evident from the data in Figures 13 and 14, the t parameter
increases with increasing electrolyte resistivity. This is true for
a single sample (FS1, FS2, and VQ1) and for samples FS5 and
FS6 as well.
Let us assume that the physics behind the R G factor can be
parametrized using the hydraulic and electrical tortuosities defined in (10). This leads us to identify the variations of Cs
during compaction with the variations of %/%. Then, some
scaling law can be derived for the t parameter as a function of
the other scaling parameters p and q. As another equation is
needed for the porosity, we use
(I) = T e rag, (17)
where g is a geometrical exponent equal to 1 for cracks and 2
for tubes, from dimensional arguments following BernabE [1991]. The electrical tortuosity is added in order to account.
for the electrical efficiency of pore space [Herrick and Kennedy,
1994]. Equation (17) implies that the channels open to hydrau-
lic flow have a small contribution to the porosity, in contrast to
the channels which are electrically connected.
The system of (10), (11), and (17) is then redundant
[BernabE, 1991], and the t parameter can be calculated
1 p q-p
t = 5 + 2 2q '
(18)
½ FS1 a FS2 uVQ1 • FS5 x FS6 0.0 • • •l•l . 10 100 1000 Ele½[roly[e Resis[ivi[yFigure 17. The permeability exponent t parameter of the effective • potential versus electrolyte resistivity during com-
paction (•cff "• kt) for Fontainebleau sandstone and Villejust
quartzite samples. collapsed portion primary channel secondary channel
Figure 18. A simple model for the evolution of transport
properties associated with pore collapse during compaction.
When the shaded portion collapses, fluid percolation proceeds
through a secondary path.
This prediction is compared with the measurements in Table 3
separately for cracks and tubes, inserting the measured values
forp and q in (18) to obtain a prediction for t. The calculated
values are much smaller than the measured values for FS1,
FS2, and VQ1 but are comparable with the results for FS5 and
FS6. This indicates that this simple modified equivalent chan-
nel model does not capture all the essential physical features of
the data.
This model also does not account for the observed variation
of the t parameter with electrolyte resistivity (Figure 17). The
role of the electrolyte is important: the t parameters for FS1, FS2, and VQ1 are larger than for FS5 and FS6. This fact may be due to the experimental procedure. As described before,
the compaction of FS1, FS2, and VQ1 was done for Pt' = 10
12m. Some conductive electrolyte may have been trapped in the sample during the compaction, and the increase of the t
parameter with increasing electrolyte resistivity would then be
related to the resistivity contrast between the flowing and trapped electrolyte.
Collapse of pores [Zhang et al., 1990] would also produce an
enhancement of the t parameter. A simple mechanism for the
evolution due to pore collapse is illustrated in Figure 18. In this
model it is assumed that the evolution of the transport prop-
erty is dominated by the length of the percolating paths, with little change in pore throat size. During compaction, some parts of the percolation path collapse, and flow proceeds
through a more complex path. The evolution of the permeabil-
ity is thus due to the evolution of the tortuosity. The convection
current would scale like the permeability as 1/Th, the resis-
tance like the inverse of the formation factor, and therefore the
streaming potential, which combines (5) and (6), like
tcollapse = 1 -1- p. (19)
The values of the t parameter predicted by this model are close
to t and in good agreement with the measured values (Table 3)
for FS1, FS2, and VQ1. Thus, if channels with pore collapse
have a significant contribution to the formation factor, which would be the case if this collapse occurs with a conductive electrolyte, then the value of the t parameter is increased.
Thus the observed reduction of the streaming potential co-
efficient during compaction suggests an important effect of
coupled percolation networks contributing to electrical and hydraulic flows. It can be interpreted as evidence that the
hydraulic tortuosity is increasing faster than the electrical tor-