HAL Id: hal-02946449
https://hal.archives-ouvertes.fr/hal-02946449
Submitted on 23 Sep 2020HAL is a multi-disciplinary open access
archive for the deposit and dissemination of sci-entific research documents, whether they are pub-lished or not. The documents may come from teaching and research institutions in France or
L’archive ouverte pluridisciplinaire HAL, est destinée au dépôt et à la diffusion de documents scientifiques de niveau recherche, publiés ou non, émanant des établissements d’enseignement et de recherche français ou étrangers, des laboratoires
Aqueous Synthesis of DNA-Functionalized Near-Infrared
AgInS 2 /ZnS Core/Shell Quantum Dots
Annette Delices, Davina Moodelly, Charlotte Hurot, Yanxia Hou, Wai-Li
Ling, Christine Saint-Pierre, Didier Gasparutto, Gilles Nogues, Peter Reiss,
Kuntheak Kheng
To cite this version:
Annette Delices, Davina Moodelly, Charlotte Hurot, Yanxia Hou, Wai-Li Ling, et al.. Aqueous Syn-thesis of DNA-Functionalized Near-Infrared AgInS 2 /ZnS Core/Shell Quantum Dots. ACS Applied Materials & Interfaces, Washington, D.C. : American Chemical Society, 2020, 12 (39), pp.44026-44038. �10.1021/acsami.0c11337�. �hal-02946449�
Aqueous synthesis of DNA-Functionalized
Near-Infrared AgInS
2
/ZnS Core/Shell Quantum Dots
Annette Delices,†,‡ Davina Moodelly,‡ Charlotte Hurot,‡ Yanxia Hou,‡ Wai Li Ling,§ Christine
Saint-Pierre,‡ Didier Gasparutto,‡ Gilles Nogues,∥ Peter Reiss,‡* Kuntheak Kheng†*
†. Univ. Grenoble Alpes, CEA, CNRS, IRIG, PHELIQS, F-38000 Grenoble, France
‡. Univ. Grenoble Alpes, CEA, CNRS, IRIG, SyMMES, UMR5819, F-38000 Grenoble, France §. Univ. Grenoble Alpes, CEA, CNRS, IBS, F-38000 Grenoble, France
∥. Univ. Grenoble Alpes, CNRS, Institut Néel, F-38000 Grenoble, France KEYWORDS
Quantum dots, semiconductor nanocrystals, AgInS2, core-shell, hot-injection, seed-mediated
ABSTRACT
The unique photophysical properties of quantum dots (QDs) paved the way for the development of advanced emitting nanomaterials in bio-imaging and biosensing applications. Biocompatibility, biofunctionality, non-toxicity as well as colloidal and chemical stability are essential criteria to be fulfilled by the QD emitters. At present, it remains challenging to achieve efficient near-infrared emitting QDs respecting these criteria, in particular in the absence of toxic heavy metals such as cadmium or lead. In this perspective, we developed water soluble near-infrared emitting AgInS2/ZnS core/shell (AIS/ZnS) QDs functionalized with DNA. The newly
established aqueous route relying on a two-step hot-injection synthesis led to highly luminescent chalcopyrite-type AIS/ZnS core/shell QDs with an unprecedented photoluminescence quantum yield (PLQY) of 55% at 700 nm and a long photoluminescence decay time of 900 ns. Fast and slow hot-injection of the precursors were compared for the AIS core QDs synthesis, yielding a completely different behavior in terms of size, size distribution, stoichiometry and crystal structure. The PL peak positions of both types of core QDs were 710 (fast) and 760 nm (slow injection) with PLQYs of 36% and 8%, respectively. The slow and successive incorporation of the Zn and S precursors during the subsequent shell growth step on the stronger emitting cores promoted the formation of a three-monolayer thick ZnS shell, evidenced by the increase of the average QD size from 3.0 nm to 4.8 nm. Bioconjugation of the AIS/ZnS QDs with hexylthiol modified DNA was achieved during the ZnS shell growth, resulting in a grafting level of 5-6 DNA single strands per QD. The successful chemical conjugation of DNA was attested by UV-Vis spectroscopy and agarose gel electrophoresis. Importantly, surface plasmon resonance imaging (SPRi) experiments using complementary DNA strands further corroborated the successful coupling and the stability of the AIS/ZnS-DNA QD conjugates as well as the
preservation of the biological activity of the anchored DNA. The strong NIR emission, long-term stability and biocompatibility of the obtained AIS/ZnS-DNA QDs provide a high potential for their use in biomedical applications.
INTRODUCTION
Significant progress has been made in the development of advanced emitting nanomaterials including nanoscale metal organic frameworks, carbon nanotubes, carbon dots and quantum dots (QDs), as alternatives to conventional organic fluorophores for biosensing and bio-imaging applications.1–4 For such applications, near-infrared (NIR) emitters are of particular interest to
minimize autofluorescence as well as light absorption and scattering from the biological environment. QDs have attracted huge attention in this context, owing to their unique
photophysical properties, specifically their photoluminescence (PL) at tunable wavelength across the visible, NIR-I and NIR-II regions determined by their size, shape and chemical
composition.5,6 Furthermore, their high quantum yield (PLQY), long PL lifetime, long-term
stability and strong photobleaching resistance, place QDs among the most attractive fluorescent nanomaterials for bio-applications. However, commonly used binary NIR QDs exhibit (cyto-)toxic effects caused by the presence of hazardous elements (e.g., Cd, Pb). Therefore, growing efforts are devoted to the development of biocompatible and toxic heavy metal-free QDs.7–11
Among them, ternary I-III-VI chalcopyrite-type materials are becoming the focus of interest.12–14
These ternary QDs, regarded as promising eco-friendly materials for multiple applications, display a direct band gap (1.04-1.87 eV in the bulk materials) and high absorption coefficients (104-105 cm-1). Among them, silver indium sulfide (AgInS2, AIS) QDs, and their alloys with Zn,
stand out from their analogues thanks to their elevated PLQY and long lifetime (several hundred nanoseconds) regardless of the synthetic medium (organics or water). Nevertheless, AIS QDs prepared in organic solvents generally demonstrate better photophysical properties15 but are not
directly applicable in biological systems. Aqueous phase transfer via ligand exchange is feasible but is known to result in a significant loss of PLQY.16 Therefore, aqueous synthesis is of
particular interest to directly obtain water-soluble AIS QDs. To date, in aqueous medium, several colloidal synthetic approaches have been reported such as heat-up, hot-injection, hydrothermal and microwave irradiation assisted methods.14,17,18 The brightest AIS QDs have been produced
by heat-up (PLQY ~60 %19,20) and microwave (PLQY ~66 %21) approaches. To make them
compatible with biomedical applications, generally further surface chemical modification is required.
Conjugation of QDs with biomolecules was first reported by Bruchez et al. and Chan et al. in 1998 employing biotin22 and proteins23, respectively, in combination with CdSe/ZnS core/shell
QDs. The following year, Mirkin et al. initiated the functionalization of QDs with single stranded DNA (ssDNA) bound by a thiol functional group.24 Since then, a large number of
advanced hybrid-QD nanostructures using DNA have been elaborated, constituting a major breakthrough in biomedical applications. Several pathways are possible to functionalize QDs with DNA. For example, Sun and Gang achieved covalent bonding by coupling carboxyl groups on the QD surface with amino-DNA.25 Along the same line, the group of Dubertret triggered the
reaction between amino-DNA with thiol functions present on an amphiphilic polymer used to encapsulate the QDs.26 In both studies, the resulting QDs are structurally and optically stable
while varying the pH and the ionic strength. Another approach is the direct attachment of ssDNA during the inorganic (ZnS, CdS) shell growth. This one-step method relies on the introduction of thiol or phosphorothioate modified ssDNA in the shell precursors’ solution which acts as
capping and stabilizing agent.27–31 All these works were carried out using CdSe, CdTe and
CdxPb1-xTe QDs and so far, no study has been devoted to the DNA-functionalization of ternary
Herein, we report a novel synthesis method for AIS/ZnS core/shell QDs via a two-step procedure as well as an efficient way for their surface functionalization with ssDNA while preserving their strong luminescence. First, the aqueous synthesis of NIR-emitting AIS core QDs (cQDs) was performed using two different approaches, by comparing the classical fast hot-injection method with a yet unexplored slow hot-injection procedure referring to seed-mediated growth. Both methods led to significant differences in the QD properties, yielding 3.0 nm Ag-poor Ag0.53InS2
QDs crystallizing in the chalcopyrite phase (fast injection) and 5.2 nm close-to-stoichiometric Ag1.1InS2.1 QDs of lower size distribution, crystallizing in the orthorhombic phase (slow
injection). The PL peak positions of two types of QDs were 710 and 760 nm with PLQYs of 36% and 8%, respectively. Capping the stronger emitting cQDs with a ZnS shell layer led to highly luminescent AIS/ZnS core/shell QDs (csQDs) reaching a PLQY of 55%, stabilized in the aqueous phase by hydrophilic glutathione (GSH) ligands. Up to now, producing a thick ZnS shell layer on AIS QDs was challenging in aqueous medium. Here we adopted an approach based on the slow and successive incorporation of Zn and S precursor solutions promoting the formation of a thick shell evidenced by a QD size increase from 3.0 nm to 4.8 nm. Hexylthiol modified ssDNA was incorporated during the ZnS shell growth under precise control of pH and ionic strength. Successful chemical conjugation of ssDNA affording csQD-DNA was attested by several techniques (UV-Vis spectroscopy, agarose gel electrophoresis). Importantly, surface plasmon resonance imaging (SPRi) experiments using complementary DNA strands further corroborated the successful coupling and the stability of the bright AIS csQD-DNA conjugates as well as the preservation of the biological activity of the anchored DNA.
EXPERIMENTAL SECTION Materials
All the chemicals were used as received without further purification. Silver nitrate (AgNO3,
99.99 %), indium (III) chloride (InCl3, 99.99 %), sodium sulfide nonahydrate (Na2S.9H2O),
L-glutathione reduced (GSH), ammonium citrate dibasic (C6H6O7.2NH4, 98 %), zinc acetate
dihydrate (Zn(CH3COO)2.2H2O, 99.99 %), poly(ethylene glycol) methyl ether thiol (PEG-SH,
Mn= 2000 Da) phosphate buffered saline tablet (PBS), sodium chloride (NaCl, 99 %), sodium hydroxide pellet (NaOH, 98 %), potassium phosphate dibasic (K2HPO4, 98%) and glycerol
(99%) were all purchased from Sigma Aldrich. 2-Propanol (99.8 %) and ammonium hydroxide solution (NH4OH, 33 %) were supplied by Fisher Scientific. The thiol (HS-(CH2)11-(EG)3-OH,
Mw= 336 Da) is purchased from Prochimia. MilliQ ultrapure water (18.2 MΩ.cm) was used in all experiments. All the modified oligonucleotides were customized and purified by Eurogentec, the sequences are listed below:
5' GTGCGAGTGAATTCCGAAGGTATTT-SH 3' (ssDNAQD; ε= 247800 M-1.cm-1)
5' TACCTTCGGAATTCACTCGCACTTTTTTTTTTTT-SH 3' (ssDNASPRcc; ε= 297300 M -1.cm-1)
5' GACCATCGTGCGGGTAGGTAGACCTTTTTTTTTTTT-SH 3' (ssDNASPRcontrol; ε= 332500
M-1.cm-1)
cQDs were synthesized via hot-injection synthetic method in two different ways: the “fast” and “slow” injection.
Fast hot-injection approach
Typically, 8 mL of 0.1 M GSH and 70 mg of ammonium citrate were added into a three-neck flask. The pH was adjusted to 6.5 using NH4OH (5 M). Subsequently, 0.5 mL of 1 M InCl3 was
introduced, leading to the formation of a precipitate. Then NH4OH was added until complete
dissolution of the precipitate and the pH of the mixture increases back to 6.5.. The reaction mixture was brought to boiling and then first 1.25 mL of 0.1 M AgNO3 and next 625 µL of 1 M
Na2S were quickly injected. The solution was kept boiling under stirring for 1h. The color of the
solution changed from transparent to brownish red. Slow hot-injection approach
The procedure is similar to the fast injection approach except that the addition of AgNO3 and
Na2S is different. Briefly, once the mixture containing GSH, ammonium citrate, and InCl3 was
brought to boiling, 250 µL of 0.1 M AgNO3 and 125 µL of 1 M Na2S were quickly injected to
form the AIS seeds. Then, 1 mL of 0.1 M AgNO3 and 500 µL of 1 M Na2S were successively
added dropwise using a syringe pump for 20 min. The solution was kept boiling under stirring for 1h. The color of the solution was brownish red but darker than the fast injection approach. AIS/ZnS core/shell synthesis (csQDs)
For the ZnS shell growth on cQDs, two distinct solutions were prepared (A and B). Solution A contained 7 mL of Zn(CH3COO)2.2H2O stock solution (0.1 M) and 7 mL of the stabilizing
15.3 mL H2O. Both solutions were added in parallel and slowly via a syringe pump with a
constant flow rate of 0.15 mL/min into the core solution (V= 4 mL) at constant temperature (96 °C). Two aliquots were extracted from the solution after 50 and 100 min during the addition, respectively, for characterization in order to follow the growth process. After completed injection, the mixture was maintained at 96 °C for another hour.
DNA Functionalization on AIS/ZnS QDs (csQD-DNA)
DNA single strands were attached to the ZnS shell during its synthesis. Briefly, 100 µL of the cQDs solution diluted in 5 mL of H2O was heated to 96 °C. Then, 2 mL of an aqueous solution
containing 97 µL of Zn(CH3COO)2.2H2O stock solution (0.1 M) and 1 mL of HS-DNA
(ssDNAQD ; C= 0.1 M in PBS at pH 7.4) and 2 mL of another solution containing 9.7 µL Na2S (1
M) were added dropwise and in parallel via a syringe pump. After the addition, the mixture was maintained at this temperature for 1h. For better comparison, csQDs without DNA were prepared under the same condition except that DNA was replaced by GSH.
QDs purification
All QDs were purified by precipitation performed by the addition of 2-propanol followed by centrifugation (10303 g for 5 min). The pellet was redissolved in H2O. For csQD-DNA, they
were purified by centrifugation through vivaspin centrifugal filter with a 300 kDa molecular weight cut off (3 times centrifugation at 10303 g for 2 min).
Characterization Techniques
X-Ray diffraction (XRD) measurements were carried out by using a Bruker D8 Advance DaVinci diffractometer with CuKα radiation λ= 1.5406 Å from 2θ= 10-100 °. The chemical
composition was determined by energy-dispersive X-ray spectroscopy (EDX) performed on a scanning electron microscope ULTRA 55 (Carl Zeiss AG) with SDD detector (Bruker AXS) and working at 10 kV. Transmission electron microscopy (TEM) analyses were performed on a Technai F20 operating at 200 kV. The samples were deposited onto an ultra-thin graphene oxide layer on a Quantifoil for minimal background from the support film. The UV-Visible absorption spectra were recorded with a NanoDrop 2000c spectrophotometer with an optical path length of 1 mm. The photoluminescence (PL) spectra were obtained from a Horiba Fluorolog-3 model FL3-22 spectrometer (Horiba Jobin Yvon) equipped with 450 W Xe lamp and a R928P detector. The photoluminescence decay curves were recorded using the time-correlated single-photon counting (TCSPC) technique on Fluorolog-3 spectrometer (Horiba Jobin Yvon) and the excitation source was a pulsed light emitting diodes with an excitation wavelength of 455 nm (NanoLED-05A, >1.3 ns pulse, Horiba). The curves were fitted with DAS6 analysis software provided by Horiba Scientific. For measurements of photoluminescence quantum yields (PLQY) a G8 integrated sphere module (GMP SA, Switzerland) was used in the Fluorolog-3 spectrometer (Horiba Jobin Yvon).
Agarose gel electrophoresis
To qualitatively attest the presence of DNA on QDs, csQD-DNA conjugates were
characterized by fluorescence detection in agarose gel electrophoresis. cQDs and csQDs were used as control. Each solution contains 8 µL of the corresponding sample, 2 µL of the loading dye and 0.5 µL of the DNA intercalating agent (SYBR Gold) for some of them. The migration was performed with a FlashGelTM System (Lonza) using a FlashgelTM DNA cassette (1.2% agarose gel) and was running at 120 V.
Surface plasmon resonance imaging (SPRi)
Surface plasmon resonance imaging was used to confirm the presence of DNA on the QDs after the functionalization, and most importantly, to evaluate the biological activities of the DNA ligands on QDs. For this, first, a biochip was prepared using the complementary DNA strand (ssDNASPRcc) and an arbitrary DNA strand (ssDNASPRcontrol) for negative control. They were
immobilized onto a SPRi prism coated with a thin gold film supplied by Horiba Scientific. 48h before use, the gold surface of the prism was subjected to plasma treatment with a Femto plasma cleaner (Diener electronic) (25 % argon, 75 % oxygen, 0.6 mbar, 40 W, 3 min). Then, droplets of DNA solutions were deposited on the prism by a non-contact spotting robot
(sciFLEXARRAYER S3, Scienion, Germany). In this study, DNA spotting solutions were prepared in 4 different buffer solutions for optimization: 1) PBS with pH=7.4; 2) 0.1 M K2HPO4
with pH= 9.25; 3) 0.5 M K2HPO4 with pH= 9.25; 4) 1 M K2HPO4 with pH= 9.25. Each spotting
solution contains 10 µM of DNA, 10 µM of PEG-SH (Mn= 2000 Da) and 5 % glycerol in the corresponding buffer. Moreover, for each condition, three replicates were randomly deposited on the prism to avoid any bias due to the position effect on the biochip. After spotting, the prism was placed in a humidity-controlled chamber (relative humidity of 96%) at 25 °C for 24h for the immobilization of DNA by self-assembly. Then, the prism was rinsed thoroughly with deionized water. Finally, the free gold surface on the prism was blocked with PEG-SH (Mw=336 Da, 100 µM) for 1h and rinsed completely with deionized water.
The biochip was then used for the analysis of csQD-DNA conjugates using the classical Kretschmann-type optical configuration at a fixed working angle. The measurements were carried out with an OpenPleX system (Horiba Scientific) placed in an incubator at 25 °C. For this, a collimated, polarized light beam at 635 nm was sent through the prism to illuminate the
whole biochip. The reflectivity of all the DNA spots was simultaneously monitored and recorded with a CCD camera, with each pixel mapping a specific position on the prism. Upon the injection of csQD-DNA conjugates, binding events occurred. Consequently, the reflectivity of the spots on the biochip increased, which was recorded. A measurement was taken every three seconds. Thanks to image treatment software, SPR images were then converted to variations of
reflectivity (expressed as Δ Reflectivity, %) versus time, generating a series of kinetic binding curves, called sensorgrams.
In practice, the prism was mounted into a 10 μL PEEK flow cell, which was connected to a fluidic system. Filtered running buffer (PBS at pH 7.4 with 0.4 M NaCl) was pushed by a computer-controlled syringe pump (Cavro Scientific Instruments, USA) at a constant flow of 0.52 μL/s. In addition, it passed through a degassing system (Alltech, France) before arrival in the flow cell to eliminate air bubbles. The samples of csQD, ssDNAQD and csQD-DNA
conjugates were manually injected through a six-port injection valve (Upchurch Sci., USA) using a syringe. The injection loop volume was 500 µL. After each analysis, the biochip was
completely regenerated in situ with 0.2 M NaOH for re-use. csQD-DNA were used for the SPR measurements few days to more than 3 months after their preparation. In this work, only the results obtained after 3 months are illustrated.
RESULTS AND DISCUSSION
AIS core QDs synthesis: fast vs. slow hot-injection
In this study, a two-step procedure in aqueous medium has been developed to synthesize AIS/ZnS core/shell QDs functionalized with DNA, as depicted in Scheme 1. In the first step, the preparation of the core QDs (cQDs) used the same chemicals as in the synthesis reported by
Stroyuk et al.19 Briefly, AgNO
3, InCl3 and Na2S were brought to react together with a molar ratio
set at 1:4:5 and GSH and citrate were added as stabilizing agents. However, the reported heat-up synthesis led to a very broad size distribution of the QDs, requiring supplementary post-synthetic size fractionation steps. Furthermore, it is challenging to access the NIR range with emission peaks centered at wavelengths exceeding 650 nm. To overcome these limitations, we explored a different synthetic approach applying a hot-injection method. Typically, this approach involves a fast injection of one or several precursors into a hot reaction mixture limited by the solvent boiling temperature.32,33 In aqueous medium, the boiling temperature is considerably lower
compared to organic media and thus does not provide the same degree of freedom for
modulating the nucleation and growth temperatures. However, this approach could lead to nearly monodispersed AIS QDs showing a maximum PLQY of up to 3% and 15 % for AIS/ZnS QDs34
with a core synthesis using AgOAc, In(OAc)3, Na2S and GSH. To optimize the overall PLQY
and the uniformity in size and shape of the cQDs two methods have been compared. The first one is the classical fast injection of precursors while the second one applies slow hot-injection, referred to as seed-mediated growth.
Among the soluble metal salt used in the preparation of AIS QDs, AgNO3 and InCl3 have been
chosen as silver and indium sources, respectively. At pH >3.5, In3+ is no longer complexed by
Cl¯ but with HO¯ and must precipitate. For this reason, the prior presence of citrate as chelating
agent in solution is necessary to prevent the precipitation of indium. The kinetic of indium citrate formation is faster than the indium hydroxide complex formation. And compared to that of indium acetate, the stability constant is higher for the indium citrate complex. Since InCl3 is a
strong Lewis acid, it will react with the strongest base present in the solution i.e. citrate, on the basis of Pearson’s hard and soft acids and bases (HSAB) principle.35 As for AgNO3, the soft acid
Ag+ will interact with the sulfhydryl group of GSH to form a digonal coordination complex
chain (−S(G)−Ag−S(G)−),36,37 leading to a pale yellow solution. Immediately after Na2S
injection the solution turns to dark brown indicating that HS¯ has reacted with silver thiolate to form intermediate Ag2S.36 Right after the reaction mixture becomes brownish red, which is the
typical color of AgInS2 QDs formed by cation exchange with In3+ (2 Ag2S + In3+ → AgInS2 + 3
Ag+).38
As an alternative approach aiming at reducing the size distribution of the cQDs, we explored here the seed-mediated growth mechanism. This approach is widely applied for the preparation of larger noble metal nanoparticles, magnetic nanocrystals and QDs synthesized in organic solvents. Here, in contrast to the fast injection where the AgNO3 and Na2S precursors are
completely added at once, a slow injection is applied to ensure the progressive, continuous and uniform growth of the same material as the preformed seeds. The synthesis is performed at the boiling point (100°C) which induces the rapid decomposition of the injected precursors into multiple monomers that deposit on the seeds surface leading to the formation of larger QDs. The solution aspect during the synthesis is similar to that of the previous synthesis prior to the seed formation. Then, the solution gets increasingly dark, indicating the growth of the QDs.
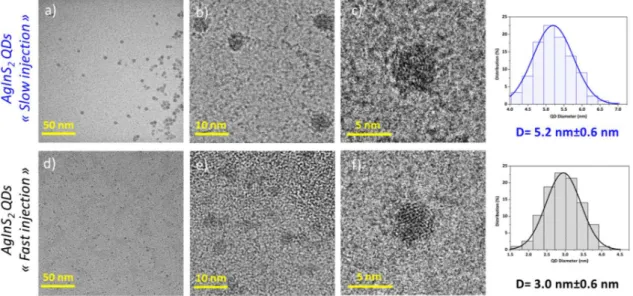
The cQDs morphology and the size distribution were analyzed by TEM and the images are shown in Figure 1. In general, regardless of the approach used for the synthesis, the particles are fairly uniform with a well-defined spherical shape. In the case of slow precursor injection, the particles are bigger, with an average size diameter of 5.2 ± 0.6 nm and a narrow size distribution of 11.5 %. The QD solution appears darker than in the case of the “fast injection”, which leads to a significantly smaller size of 3.0 ± 0.6 nm and larger size distribution (20 %). The chemical composition was determined by EDX. It was found that for cQDs obtained with the fast
precursor injection, a nonstoichiometric composition of Ag:In:S= 1:1.9:3.8 is obtained showing a strongly silver-deficient composition (Ag0.53InS2). This indicates that silver vacancies (VAg) are
present within the crystal lattice, which act as acceptor type defects. To the contrast, the cQDs obtained with the slow precursor injection are more Ag-enriched showing a quasi-stoichiometric composition of Ag:In:S= 1:0.91:1.9 (Ag1.1InS2.1). For both syntheses, it should be noted that the
initial Ag:In:S ratio was set at 1:4:5, considered as the optimum ratio to yield the highest PL intensity based on literature.19,21 Comparing with the elemental analyses suggests that the cQDs
composition strongly depends on the reaction kinetics and the unbalanced precursors’ reactivity. For the fast-injection, the Ag-deficient cQDs composition and the Ag:In= 0.53:1 cationic ratio were expected as the starting ratio was Ag:In=1:4 and In3+ has lower reactivity than Ag+. In the
case of the quasi-stoichiometric composition, the slow injection of Ag and S favors the growth of the seeds but minimizes the cation exchange reaction between In3+ and Ag+ which explains the
larger Ag content in these cQDs. The expected defects in this case are in the form of silver (AgInt) and sulfur (SInt) interstitials acting as donors and acceptors, respectively. Using powder
X-Ray diffraction (Figure 2b) the cQDs obtained with the two different synthetic routes can clearly be distinguished. For the “fast injection” cQDs, the diffractogram shows mainly three broad peaks centered at 27.1°, 45.3° and 52.9° that match well with the (112), (204) and (312) lattice planes of the tetragonal chalcopyrite reference pattern (JCPDS 00-025-1330). As for the “slow injection” cQDs, an orthorhombic phase is predominantly observed (JCPDS 00-025-1328) with two broader peaks at 28.3° and 48° with a small shoulder at 52.7° associated to the (121), (320), (322) lattice planes respectively. The broader diffraction peaks indicate that the
As shown in Figure 2c, both types of cQDs exhibit a broadband PL emission in the NIR-I region. The broad PL bandwidth is a specific feature of ternary I-III-IV2 QDs ascribed to
transitions between photoexcited electrons delocalized in the conduction band and holes localized at an acceptor-type defect level within the band gap, referred to as the free-to-bound transition.17,39 However, we note that the line width of the obtained QDs (around 300 meV) is
significantly narrower than that obtained with established heat-up syntheses.17 The PL band
centered at 760 nm that corresponds to the “slow injection” cQDs, is weakly photoluminescent (PLQY= 8 %). In contrast, the “fast injection” cQDs exhibit a PL band at shorter wavelength (710 nm) due to Ag-deficient composition, with significantly stronger photoluminescence (PLQY= 36 %). The higher PLQY can be attributed to the higher crystallinity and to the higher density of defect states in the Ag-deficient cQDs.17 In the absorption spectra (Fig. 2d) no
apparent excitonic peak is visible but only a large shoulder centered at 420 nm for the “fast injection” cQDs and at 550 nm for “slow injection” cQDs. To get further insight on the optical properties, time-resolved photoluminescence measurements have been performed to determine the photoluminescence lifetime of the QDs (Fig. 2e). As most of the ternary QDs, the decay curves were fitted by a multi-exponential function40–45. For both cQDs, the decay curve displays
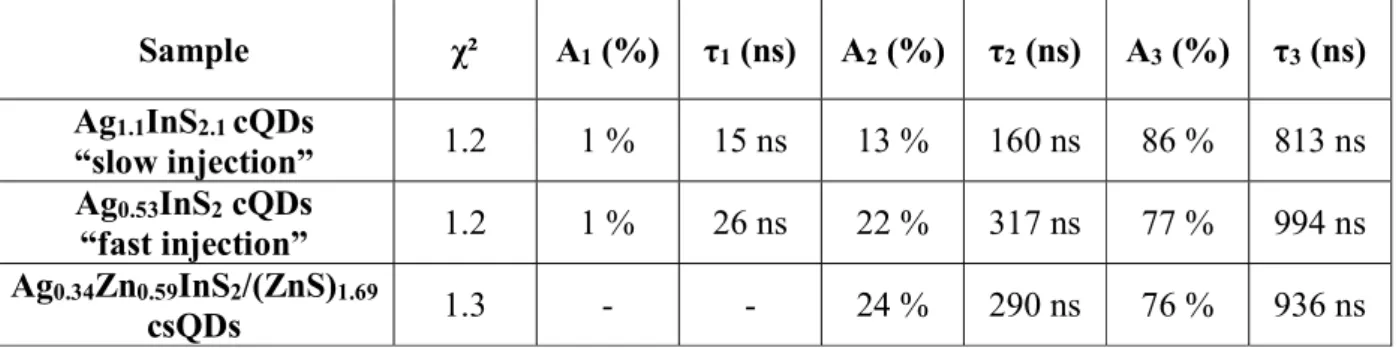
a triple exponential model considering the chi-square values (χ²) and the accurate fit in the short time (Fig. S1 and Table S1):
𝐼(𝑡) = 𝐴 𝑒 + 𝐴 𝑒 + 𝐴 𝑒
where τ is the decay time and A is the relative amplitude of each decay component. The three components are attributed to three different radiative recombination processes. The first decay time τ1 refers to the fast photo-carrier recombination process on the QD surface defects mainly
caused by dangling bonds, τ2 to the recombination process on QD surface states and the last
decay time τ3 to recombination inside the core states39,46 (Table 1). The “fast injection” cQDs
show a long fluorescence lifetime of more than 990 ns, with a contribution of 77 % of the total emission. Therefore, the radiative recombination process within the QD core mainly dominates the fluorescence emission similarly to the “slow injection” cQDs where the contribution is comparable (86 %), again with a long lifetime of 810 ns.
To conclude this part, AIS core QDs have been successfully prepared according to two synthetic approaches. Although the seed-mediated growth route has led to larger, close-to-stoichiometric, orthorhombic particles of lower size distribution, the chalcopyrite-type QDs resulting from the classical fast hot-injection route exhibit a significantly higher PLQY of (36 % vs. 8 %) with a longer lifetime exceeding 900 ns which are beneficial for bio-applications. Therefore, for the following surface engineering steps the chalcopyrite-type cQDs are considered
AIS/ZnS core/shell QDs
To protect the AIS core QDs against photodegradation and to further enhance their PLQY, a ZnS shell was grown in a second step of the synthesis. Ubiquitously used, ZnS is a wide band gap semiconductor (3.7 eV) showing a low lattice mismatch with AIS cQDs (8 %). Different routes for ZnS shell growth on AIS QDs in the aqueous phase have been reported in literature including thermal decomposition47,48 as well as the injection of ZnS precursors either at room
temperature38,49 or at higher temperature in heat-up,19 microwave radiation assisted,45,50 and
hydrothermal38,51 approaches. In contrast, here the ZnS shell was obtained through the
sulfur, to the AIS cQDs at elevated temperature (96 °C). It should be noted that the zinc precursor solution contained additional GSH surface ligands to assure the full coverage and colloidal stability of the csQDs. The amount of ZnS shell precursors was calculated to achieve around 3-4 monolayers on the cQDs. Due to the slow injection, the precursor concentration was low enough to prevent separate nucleation of ZnS seeds and to enable the diffusion of the precursor ions to the core particle surface, leading to the formation of a high quality ZnS shell.
From the TEM images in Figure 3a, it was found that the csQDs had an average diameter of 4.8 ± 1 nm, i.e. significantly larger than the core (3.0 ± 0.6 nm). The ZnS thickness is thus estimated as 0.9 nm corresponding to the formation of three monolayers. As mentioned previously, the X-ray diffractogram of the cQDs shows mainly three broad peaks centered at 27.1°, 45.3° and 52.9° that match with the (112), (204) and (312) lattice planes of the tetragonal chalcopyrite reference pattern (Fig. 3b). After the shell growth, these diffraction peaks are shifted to higher 2θ angles (27.9°, 46.4° and 54.4°) towards the characteristic peaks of cubic ZnS
(JCPDS 01-071-5975). This behavior, widely observed in many reported core/shell systems, clearly indicates the successful growth of a thick ZnS shell on the AIS cQDs. In addition, the diffraction peaks of the csQDs are narrower compared to those of the cQDs, with the FWHM varying from 2θ= 4.74° to 2θ= 3.76°, as expected for larger crystallite sizes. The relatively low lattice mismatch between the core and the shell material (8 %) favors epitaxial shell growth. In addition, the EDX analyses reveal that after growing the ZnS shell, the atomic ratio of the resulting csQDs (normalized for the In content) is Ag:In:S:Zn = 0.34:1:3.69:2.28. Comparison with the cQDs (Ag:In:S = 0.53:1:2) shows that the amount of silver decreased by around 35 % while the amount of Zn with respect to S in the shell is in excess of 35 %. This result suggests that the shell growth caused the diffusion of a fraction of Zn2+ into the core crystal lattice leading
to cation exchange with Ag+. Therefore, the chemical composition of the csQDs can be written
as Ag0.34Zn0.59InS2(ZnS)1.69, demonstrating almost equilibration of the cation and anion charges
in the QD core after Zn2+ diffusion.
The UV-Vis absorption and photoluminescence spectra of the cQDs and csQDs are shown in Figure 4. The absorption spectra (Figure 4a) do not exhibit any marked features, in accordance with many reported works on ternary QDs. However, during the shell coating, a strong increase of the absorbance below 350 nm is observed, caused by the growth of the shell of the wide band gap material ZnS (Eg = 3.7 eV / 335 nm). The PL spectrum of the cQDs is centered at 710 nm (Figure 4b, black curve). Monitoring the evolution of the PL spectra with reaction time during the injection of the ZnS precursors revealed that the PL peak position gradually shifted to lower wavelength (696 nm) while the PL intensity increased simultaneously. The observed
hypsochromic shift is lower than expected, because in principle two factors favor this behavior: i) inclusion of Zn2+ in the cQDs and concomitant decrease of Ag+ content; ii) compression of the
QD core by the ZnS shell due to its lower lattice parameter. The increase of PL intensity is essentially explained by the passivation of surface defects, which results in a reduction of non-radiative recombination pathways. The measured PLQY was initially 36 % for the cQDs and significantly increased up to a maximum of 55 % for the csQDs (Table 2). The PL line width (full width at half-maximum, FWHM) is about 128 nm for the cQDs and remains almost the same for the csQD (136 nm), while both samples exhibit roughly the same size distribution (around 20%). Thus, it can be concluded that the ZnS shell passivates the surface of the cQDs without introducing further defects. Capping ZnS on cQDs obtained from slow injection was investigated but as expected the maximum PLQY was only 15 % (Fig. S2).
Time-resolved PL analyses (Fig.4c and 4d, Table 1) shows that the decay curve of the csQDs can be very well fitted with bi-exponential model. Hence, the first component (A1, τ1), required
for the fitting in the case of the cQDs and corresponding to fast recombination processes on the QD surface defects, does not contribute anymore (Fig. S3, Table S2). The other two decay components are comparable to those of the uncoated QDs. Therefore, the coating of the QD core with the ZnS shell efficiently passivates surface defects responsible in part for PLQY losses through non-radiative transitions.
Summarizing, the developed synthetic approach favors the formation of a thick ZnS shell of three monolayers on the AIS cQDs, leading at the same time to a partial Ag/Zn cation exchange in the core. The obtained Ag0.34Zn0.59InS2/(ZnS)1.69 csQDs exhibit NIR PL emission at around
700 nm with a maximum PLQY of 55 % and a long PL lifetime exceeding 900 ns.
QD conjugation with DNA
As mentioned in the introduction, several ways have been proposed to conjugate QDs with ssDNA. Here, we selected the approach of DNA functionalization during the shell growth because it combines several advantageous features: i) experimentally, the shell growth procedure remains almost the same, just GSH is replaced by thiolated ssDNA; ii) strong conjugation can be expected as the thiolate group of the ssDNA can be integrated into the surface of the ZnS shell (crystal bound rather than surface bound)52; iii) the amount of required functional ssDNA can be
minimized. Briefly, the thiolated DNA single strands (molar ratio QD:ssDNAQD= 1:10) were
mixed with the Zn precursor solution and then added dropwise together with the S precursor solution (as in the case of standard ZnS shell growth) to the reaction mixture containing the core
QDs. The physicochemical parameters used during the synthesis including the salt concentration and the pH have been carefully adjusted to get the highest number of ssDNAQD grafted on the
csQDs. According to the optimal conditions reported by Sun and Gang,25 the pH was maintained
at 7 and the NaCl concentration did not exceed 0.02 M. We note that the purification of the resulting csQD-DNA from free DNA turned out to be a challenging step, which deserves particular attention. Precipitation as for standard csQDs did not work since free DNA also precipitates upon addition of isopropanol. Another widely used method for the purification of aqueous QDs after functionalization is size exclusion chromatography using gel columns. However, this method is not suitable neither to remove free DNA molecules due to their high molecular weight (> 30 kDa). On the other hand, gel extraction of conjugated QDs using electrophoresis often results in significant material loss. A few other purification methods reported in literature (ion exchange chromatography using diethylaminoethyl cellulose or ultracentrifugation) are better suited for maintaining the yield and the stability of the
bioconjugates, yet their application is tedious.53,54 Therefore, in the present work, the csQD-DNA
were purified using centrifugal filters with a 300 kDa molecular weight cut off. The csQD-DNA sample has been carefully purified until no more free DNA strands remain in the solution through absorption measurements (Fig. S4). Finally, the concentrate was redispersed in PBS buffer at pH 7.4.
The obtained csQD-DNA conjugates, which are stable in buffer solution for at least 3 months, exhibit a PL emission maximum of 704 nm and a PLQY of 42 % (Fig.5a). We attribute the relative reduction of the PLQY by 24 % as compared to csQDs without DNA to the less efficient passivation of the ZnS shell surface induced by the sterically demanding DNA molecules. In the UV-Vis spectra (Fig. 5b), two additional shoulders are observed at around 260 nm and 300 – 350
nm in comparison with standard csQDs. From the peak observed at 260 nm, the amount of ssDNAQD on the QD surface can be estimated. The absorption is determined at A260(1mm)= 0.77,
hence the concentration of ssDNAQD is 31 µM. The concentration of QDs is estimated to be 5-6
µM, i.e. there are around 5-6 DNA strands per QD (Fig. S5 and S6). This ratio is approximately a factor two lower than that added during the synthesis (QD:ssDNAQD = 1:10), confirming also
that unbound ssDNAQD was successfully removed during the purification process.
As an additional technique, agarose gel electrophoresis was used to characterize the DNA-conjugated QDs. In fact, this technique, particularly relevant for the separation and purification of biomolecules, is also applied for QDs as a routine technique to reveal the presence of DNA or other biomolecules before and after functionalization.26,31,55–57 For comparison, cQDs, csQDs,
and csQD-DNA conjugates were measured, taking the former two samples as control. Under an electric field of 120 V, all types of QDs migrated towards the anode, since DNA and GSH surface ligands are negatively charged (Fig. 5c). The electromigration is directly visible and can be monitored in real-time thanks to the luminescence of the QDs through the transilluminator light or through UV light. The mobility is slower for the csQDs than the cQDs while it is faster for csQD-DNA conjugates compared to the standard csQDs. The electrophoretic migration velocity is based on the hydrodynamic size and electric charge of the nanoparticles. For cQDs and csQDs, the difference is caused by the increased overall size of the QDs, while for the csQD-DNA conjugates and csQDs the difference is related to the overall charge on the QD surface: the contribution of DNA charge dominates the electrophoretic particle migration progress in
comparison with GSH ligands. The mass predominates the velocity according to the migration of cQDs with regard to csQD-DNA conjugates. Concluding, agarose gel electrophoresis strongly supports the successful conjugation of DNA molecules on the QD surface.
Biological activity of DNA anchored on the QD surface
Although the UV-vis absorption spectra and electrophoresis give strong evidence for the presence of ssDNA on the QDs surface, for further applications of the novel conjugates it is of prime importance to verify that the biological activity of the anchored DNA molecules remained intact. To achieve this, a biochip-based strategy was elaborated using SPRi as detection
technique.58–60 The sensing analysis was carried out on a multiplex biochip with an array of 4 x 6
spots (eight different samples with three replicas) as depicted in Figure 6a and 6b. Half of them included the complementary ssDNASPRcc to that grafted on the QDs (G1, G2, G5, G6) and the
others were arbitrary ssDNASPRcontrol (G3, G4, G7, G8) used as negative control, all prepared in
four different buffers. Here, several buffers as spotting solutions were used to optimize the conditions for the immobilization and stabilization of these thiolated DNA on the biochip in order to obtain optimal density with sufficient spacing (by electrostatic repulsion) and
appropriate orientation for an efficient hybridization afterwards. Furthermore, to minimize non-specific interactions, the free gold surface on the biochip was blocked with PEG-SH.
Three solutions were injected successively onto the biochip through the SPR micro-fluidic system: csQDs, ssDNAQD and csQD-DNA conjugates. First, the biochip was exposed to two
experiments using non-functionalized csQDs (100 nM) for negative control and free ssDNAQD
(0.12 µM) for positive control. As illustrated in Figure 6c, there is almost no signal (ΔR< 0.05 %) on all the spots for csQDs injection, showing that there is relatively weak nonspecific adsorption on the biochip. The injection of ssDNAQD (Figure 6d) gave no signal on the spots
responses on all the other spots thanks to hybridization with the respective complementary DNA strands. Simultaneously, all these complementary spots were illuminated over the gold surface (Fig. S7). Among these spots, the SPR signal assigned to G5 reached an equilibrium with a maximum of reflectivity variation (ΔR) of nearly 0.8 %. It demonstrated clearly that G5 allowed for the most efficient hybridization. Finally, the solution containing csQD-DNA conjugates at 100 nM was injected. The reflectivity variations increased for all the complementary DNA spots with a particularly high signal for spots obtained with G5 (Fig. 6e), in consistence with results obtained for the injection of ssDNAQD. For better comparison, the sensorgrams in Figure 7b
regroup the SPR kinetic curves obtained on the spots of G5 for the three injected samples ssDNAQD (red curve), csQDs (orange curve), csQD-DNA (blue curve) as well as on the spots of
G7 for the injection of csQD-DNA (green curve) as negative control. The SPR response is largely enhanced upon the injection of csQD-DNA compared to free ssDNAQD with an
amplification factor of 3 (ΔR> 2.5%). Such an enhancement effect on the optical signal was expected since the SPR is a surface sensitive technique. The addition of linked csQD-DNA produced much higher refractive index changes on the SPR surface. In contrast, the negative control spots of arbitrary ssDNA (green curve) did not give reliable response in presence of csQD-DNA. In addition, for illustration, the SPRi differential image obtained after the injection of csQD-DNA was given (cf. Figure 7b), showing three bright spots corresponding to G5.
Summarizing, the csQD-DNA conjugates are clearly hybridized to the complementary strands on the biochip. The functionalization step of the QDs was effective and the anchored DNA ligands are still accessible and biologically active. It should be noted that csQD-DNA are stable in buffer solution and that the SPR measurements have been performed 3 months after the QDs
CONCLUSION
Aqueous synthesis using the hot-injection approach led to the successful preparation of uniform, spherical and highly luminescent chalcopyrite-type AIS/ZnS core/shell QDs. We showed that the intermediate AIS core QDs prepared by fast hot-injection resulted in small (3.0 nm) Ag-deficient cQDs of the composition Ag0.53InS2 showing an elevated PLQY (36%). The slow hot-injection,
in turn, led under otherwise identical conditions to much larger QDs (5.2 nm) of lower size distribution and close to stoichiometric composition (Ag1.1InS2.1), albeit lower PLQY (8%).
Coating the former cQDs with a three-monolayer thick ZnS shell yielded a PLQY of 55% at around 700 nm. Compared to the photophysical properties of AIS QDs produced with reported synthetic techniques, the obtained samples are of particular interest due to their strong PL emission in the NIR-I region and their long PL decay time over 900 ns, which can be highly relevant for diverse applications. The applied shell growth procedure can be easily adapted for achieving surface conjugation with ssDNA. The successful formation of csQD-DNA conjugates was evidenced by means of the SPRi detection technique. The SPRi response displayed an amplification factor of 3 for csQD-DNA with respect to free DNA, confirming that the DNA strands bound to the AIS/ZnS core/shell QDs maintain their biological activity. The expected non-toxicity, long-term stability and biocompatibility of the newly developed csQD-DNA conjugates represent strong assets for biomedical applications. As such, the obtained csQD-DNA have a high potential as fluorescent probes applicable for live cell imaging or as building blocks for nanosensors. Furthermore, they can be coupled with other functional buildings blocks in which DNA mediates the assembly, to give FRET nanoprobes or plasmonic nano-antennas for bioimaging and biosensing.
FIGURES
Graphical Abstract.
Scheme 1. Schematic representation of the aqueous synthetic strategy of the AgInS2/ZnS
Figure 1. TEM images of AgInS2 core QDs obtained from (a)-(d) “slow injection” and from
Figure 2. (a) Schematic representation of AgInS2 core QDs synthesis following either “slow” or
“fast” injection technique. (b) X-rays diffractograms with AgInS2 orthorhombic and chalcopyrite
reference patterns, (c) normalized PL spectra, (d) Normalized absorption spectra and (e) PL decay curves associated to AgInS2 core QDs obtained from “slow injection” (blue) or “fast
injection” (black) route.
Figure 3. (a) TEM images of AgInS2/ZnS QDs with the corresponding size distribution
histogram and (b) X-rays diffractograms of AgInS2 core QDs (black) and AgInS2/ZnS core/shell
Figure 4. (a) Absorption and (b) PL spectra of the AgInS2/ZnS QDs formation during the shell
growth process starting from AgInS2 core QDs (black). (c) Normalized PL decay curves and (d)
the enlarged view at shorter times of AgInS2 core QDs (black) and AgInS2/ZnS core/shell QDs
Figure 5. (a) PL and (b) Absorption spectra of AgInS2 core QDs (black), AgInS2/ZnS core/shell
QDs (red) and AgInS2/ZnS core/shell conjugated with DNA (blue). (c) Pictures of agarose gel
electrophoresis migration. The different samples are: cQDs (C= 5 µM); csQDs (C= 5 µM); and csQD-DNA (C= 5 µM).
Figure 6. (a) Picture of the biochip array spotted on the SPR prism. (b) Schematic representation of the experimental biochip array composed of samples containing the complementary DNA (ssDNASPRcc) in blue (G1, G2, G5, G6) and the DNA control (ssDNASPRcontrol) in green (G3, G4,
G7, G8). Sensorgrams during the injection of (c) csQDs (100 nM), (d) ssDNAQD (0.12 µM) and
Figure 7. (a) Schematic illustration of the hybridization process, (b) Sensorgrams obtained with the injection of the csQD-DNA (blue curve) compared with ssDNAQD (red curve), csQDs
(orange curve), and csQD-DNA control (green curve). The SPRi differential image of the biochip after the injection of the csQD-DNA conjugates (100 nM).
Table 1. Time-resolved PL data of the core and core/shell samples. Sample χ² A1 (%) τ1 (ns) A2 (%) τ2 (ns) A3 (%) τ3 (ns) Ag1.1InS2.1 cQDs “slow injection” 1.2 1 % 15 ns 13 % 160 ns 86 % 813 ns Ag0.53InS2 cQDs “fast injection” 1.2 1 % 26 ns 22 % 317 ns 77 % 994 ns Ag0.34Zn0.59InS2/(ZnS)1.69 csQDs 1.3 - - 24 % 290 ns 76 % 936 ns Table 2. Steady-state PL data of the core and core/shell samples.
Sample FWHM (nm) λem,max (nm) PLQY (%)
Ag0.53InS2 (core) 128 nm 710 nm 36 % Intermediate Shell1 133 nm 707 nm 43 % Intermediate Shell2 136 nm 702 nm 50 % Ag0.34Zn0.59InS2/(ZnS)1.69 136 nm 696 nm 55 % ASSOCIATED CONTENT Supporting Information.
The following files are available free of charge.
Figure S1: PL decay curves of cQDs obtained from fast- and slow- injection fitted with two and three exponentials; Table S1: The associated time-resolved PL data of cQDs; Figure S2:
Absorption and PL spectra of cQDs and csQDs obtained from “slow injection”; Figure S3: PL decay curves at short times of csQDs fitted with two and three exponentials; Table S2: The associated time-resolved PL data of csQDs; Figure S4: Absorption spectra of non-purified csQD-DNA (black), purified csQD-csQD-DNA (blue) and the different supernatant after each centrifugation;
Figure S5: Estimation of the cQDs and csQD-DNA concentration; Figure S6: Estimation of the ssDNAQD concentration; Figure S7: SPRi differential images for the biochip exposed to csQDs
and ssDNAQD.
AUTHOR INFORMATION Corresponding Authors
K. Kheng - Univ. Grenoble Alpes, CEA, CNRS, IRIG, PHELIQS, F-38000 Grenoble, France; Email: kuntheak.kheng@cea.fr
P. Reiss - Univ. Grenoble Alpes, CEA, CNRS, IRIG, SyMMES, UMR5819, F-38000 Grenoble, France; Email: peter.reiss@cea.fr
Author Contributions
K.K. and Y.H. initiated the research project. K.K. Y.H. and P.R. supervised the study. A.D. performed most experiments and wrote the draft of the manuscript. D.M. contributed to QD synthesis. C.H. contributed to SPRi experiments. W.L.L. performed TEM and made the analysis. C.S.P. and D.G. designed electrophoresis experiments and performed the analysis. G.N.
contributed to photophysical characterization. All authors have contributed to the revision of the manuscript and have given approval to the final version of the manuscript.
Funding Sources
DRF Impulsion financially supported this research. Notes
ACKNOWLEDGMENT
The authors thank DRF Impulsion for the financial support for the postdoc of Annette Delices. SyMMES laboratory is part of Labex Arcane program (ANR-12-LABX-003) and Labex LANEF program (ANR-10-LABX-51-01), both funded by the French National Research Agency. Peter Reiss acknowledges financial support from the French National Research Agency ANR (grants NEUTRINOS, ANR-16-CE09-0015-03 and FLUO, ANR-18-CE09-0039-01). The authors also express their gratitude to Yann Genuist, Daniel Imbert, Stéphanie Pouget and Raphaël Mathey for their fruitful discussions and their contribution related to this project. This work used the platforms of the Grenoble Instruct-ERIC Centre (ISBG; UMS 3518 CNRS-CEA-UGA-EMBL) with support from FRISBI (ANR-10-INSB-05-02) and GRAL (ANR-10-LABX-49-01) within the Grenoble Partnership for Structural Biology (PSB). The IBS electron microscope facility is supported by the Auvergne-Rhône-Alpes Region, the Fonds FEDER, the Fondation Recherche Médicale (FRM), and the GIS-Infrastructures en Biologie Santé et Agronomie (IBISA). IBS acknowledges integration into the Interdisciplinary Research Institute of Grenoble (IRIG, CEA)
REFERENCES
(1) Park, J.; Jiang, Q.; Feng, D.; Mao, L.; Zhou, H.-C. Size-Controlled Synthesis of Porphyrinic Metal–Organic Framework and Functionalization for Targeted Photodynamic Therapy. J. Am. Chem. Soc. 2016, 138 (10), 3518–3525. https://doi.org/10.1021/jacs.6b00007.
(2) Iverson, N. M.; Barone, P. W.; Shandell, M.; Trudel, L. J.; Sen, S.; Sen, F.; Ivanov, V.; Atolia, E.; Farias, E.; McNicholas, T. P.; Reuel, N.; Parry, N. M. A.; Wogan, G. N.; Strano, M. S. In Vivo Biosensing via Tissue-Localizable near-Infrared-Fluorescent Single-Walled Carbon Nanotubes. Nat. Nanotechnol. 2013, 8 (11), 873–880. https://doi.org/10.1038/nnano.2013.222.
(3) Jiang, K.; Sun, S.; Zhang, L.; Lu, Y.; Wu, A.; Cai, C.; Lin, H. Red, Green, and Blue Luminescence by Carbon Dots: Full-Color Emission Tuning and Multicolor Cellular Imaging. Angew. Chem. Int. Ed. 2015, 54 (18), 5360–5363. https://doi.org/10.1002/anie.201501193.
(4) Lv, G.; Guo, W.; Zhang, W.; Zhang, T.; Li, S.; Chen, S.; Eltahan, A. S.; Wang, D.; Wang, Y.; Zhang, J.; Wang, P. C.; Chang, J.; Liang, X.-J. Near-Infrared Emission CuInS/ZnS Quantum Dots: All-in-One Theranostic Nanomedicines with Intrinsic Fluorescence/Photoacoustic Imaging for Tumor Phototherapy. ACS Nano 2016, 10 (10), 9637–9645. https://doi.org/10.1021/acsnano.6b05419.
(5) Kovalenko, M. V.; Manna, L.; Cabot, A.; Hens, Z.; Talapin, D. V.; Kagan, C. R.; Klimov, V. I.; Rogach, A. L.; Reiss, P.; Milliron, D. J.; Guyot-Sionnnest, P.; Konstantatos, G.; Parak, W. J.; Hyeon, T.; Korgel, B. A.; Murray, C. B.; Heiss, W. Prospects of Nanoscience with Nanocrystals. ACS Nano 2015, 9 (2), 1012–1057. https://doi.org/10.1021/nn506223h. (6) Zhao, P.; Xu, Q.; Tao, J.; Jin, Z.; Pan, Y.; Yu, C.; Yu, Z. Near Infrared Quantum Dots in
Biomedical Applications: Current Status and Future Perspective: Near Infrared Quantum Dots in Biomedical Applications. Wiley Interdiscip. Rev. Nanomed. Nanobiotechnol. 2018, 10 (3), e1483. https://doi.org/10.1002/wnan.1483.
(7) Reiss, P.; Carrière, M.; Lincheneau, C.; Vaure, L.; Tamang, S. Synthesis of Semiconductor Nanocrystals, Focusing on Nontoxic and Earth-Abundant Materials. Chem. Rev. 2016, 116 (18), 10731–10819. https://doi.org/10.1021/acs.chemrev.6b00116.
(8) Zhang, H.; Hu, N.; Zeng, Z.; Lin, Q.; Zhang, F.; Tang, A.; Jia, Y.; Li, L. S.; Shen, H.; Teng, F.; Du, Z. High‐Efficiency Green InP Quantum Dot‐Based Electroluminescent Device Comprising Thick‐Shell Quantum Dots. Adv. Opt. Mater. 2019, 7 (7), 1801602. https://doi.org/10.1002/adom.201801602.
(9) Bai, Z.; Ji, W.; Han, D.; Chen, L.; Chen, B.; Shen, H.; Zou, B.; Zhong, H. Hydroxyl-Terminated CuInS 2 Based Quantum Dots: Toward Efficient and Bright Light Emitting
Diodes. Chem. Mater. 2016, 28 (4), 1085–1091. https://doi.org/10.1021/acs.chemmater.5b04480.
(10) Tsolekile, N.; Nahle, S.; Zikalala, N.; Parani, S.; Sakho, E. H. M.; Joubert, O.; Matoetoe, M. C.; Songca, S. P.; Oluwafemi, O. S. Cytotoxicity, Fluorescence Tagging and Gene-Expression Study of CuInS/ZnS QDS - Meso (Hydroxyphenyl) Porphyrin Conjugate against Human Monocytic Leukemia Cells. Sci. Rep. 2020, 10 (1), 4936. https://doi.org/10.1038/s41598-020-61881-8.
(11) Zeng, Y.; Pan, L.; Wang, J.; Fan, Y.; Shu, Y.; Pang, D.; Zhang, Z. Interfacial Synthesis of Ag 2 S/ZnS Core/Shell Quantum Dots in a Droplet Microreactor. ChemistrySelect 2020, 5
(12) Aldakov, D.; Lefrançois, A.; Reiss, P. Ternary and Quaternary Metal Chalcogenide Nanocrystals: Synthesis, Properties and Applications. J. Mater. Chem. C 2013, 1 (24), 3756. https://doi.org/10.1039/c3tc30273c.
(13) Zhong, H.; Bai, Z.; Zou, B. Tuning the Luminescence Properties of Colloidal I–III–VI Semiconductor Nanocrystals for Optoelectronics and Biotechnology Applications. J. Phys. Chem. Lett. 2012, 3 (21), 3167–3175. https://doi.org/10.1021/jz301345x.
(14) Girma, W. M.; Fahmi, M. Z.; Permadi, A.; Abate, M. A.; Chang, J.-Y. Synthetic Strategies and Biomedical Applications of I–III–VI Ternary Quantum Dots. J. Mater. Chem. B 2017, 5 (31), 6193–6216. https://doi.org/10.1039/C7TB01156C.
(15) Ko, M.; Yoon, H. C.; Yoo, H.; Oh, J. H.; Yang, H.; Do, Y. R. Highly Efficient Green Zn-Ag-In-S/Zn-In-S/ZnS QDs by a Strong Exothermic Reaction for Down-Converted Green and Tripackage White LEDs. Adv. Funct. Mater. 2017, 27 (4), 1602638. https://doi.org/10.1002/adfm.201602638.
(16) Li, L.; Daou, T. J.; Texier, I.; Kim Chi, T. T.; Liem, N. Q.; Reiss, P. Highly Luminescent CuInS 2 /ZnS Core/Shell Nanocrystals: Cadmium-Free Quantum Dots for In Vivo Imaging.
Chem. Mater. 2009, 21 (12), 2422–2429. https://doi.org/10.1021/cm900103b.
(17) Moodelly, D.; Kowalik, P.; Bujak, P.; Pron, A.; Reiss, P. Synthesis, Photophysical Properties and Surface Chemistry of Chalcopyrite-Type Semiconductor Nanocrystals. J. Mater. Chem. C 2019, 7 (38), 11665–11709. https://doi.org/10.1039/C9TC03875B.
(18) Jain, S.; Bharti, S.; Bhullar, G. K.; Tripathi, S. K. I-III-VI Core/Shell QDs: Synthesis, Characterizations and Applications. J. Lumin. 2020, 219, 116912. https://doi.org/10.1016/j.jlumin.2019.116912.
(19) Stroyuk, O.; Raevskaya, A.; Spranger, F.; Selyshchev, O.; Dzhagan, V.; Schulze, S.; Zahn, D. R. T.; Eychmüller, A. Origin and Dynamics of Highly Efficient Broadband Photoluminescence of Aqueous Glutathione-Capped Size-Selected Ag–In–S Quantum Dots. J. Phys. Chem. C 2018, 122 (25), 13648–13658. https://doi.org/10.1021/acs.jpcc.8b00106.
(20) Mrad, M.; Ben Chaabane, T.; Rinnert, H.; Lavinia, B.; Jasniewski, J.; Medjahdi, G.; Schneider, R. Aqueous Synthesis for Highly Emissive 3-Mercaptopropionic Acid-Capped AIZS Quantum Dots. Inorg. Chem. 2020, 59 (9), 6220–6231. https://doi.org/10.1021/acs.inorgchem.0c00347.
(21) Martynenko, I. V.; Baimuratov, A. S.; Weigert, F.; Soares, J. X.; Dhamo, L.; Nickl, P.; Doerfel, I.; Pauli, J.; Rukhlenko, I. D.; Baranov, A. V.; Resch-Genger, U. Photoluminescence of Ag-In-S/ZnS Quantum Dots: Excitation Energy Dependence and Low-Energy Electronic Structure. Nano Res. 2019, 12 (7), 1595–1603. https://doi.org/10.1007/s12274-019-2398-4.
(22) Bruchez Jr., M. Semiconductor Nanocrystals as Fluorescent Biological Labels. Science 1998, 281 (5385), 2013–2016. https://doi.org/10.1126/science.281.5385.2013.
(23) Chan, W. C. Quantum Dot Bioconjugates for Ultrasensitive Nonisotopic Detection. Science 1998, 281 (5385), 2016–2018. https://doi.org/10.1126/science.281.5385.2016.
(24) Mitchell, G. P.; Mirkin, C. A.; Letsinger, R. L. Programmed Assembly of DNA Functionalized Quantum Dots. J. Am. Chem. Soc. 1999, 121 (35), 8122–8123. https://doi.org/10.1021/ja991662v.
(25) Sun, D.; Gang, O. DNA-Functionalized Quantum Dots: Fabrication, Structural, and Physicochemical Properties. Langmuir 2013, 29 (23), 7038–7046. https://doi.org/10.1021/la4000186.
(26) Banerjee, A.; Grazon, C.; Nadal, B.; Pons, T.; Krishnan, Y.; Dubertret, B. Fast, Efficient, and Stable Conjugation of Multiple DNA Strands on Colloidal Quantum Dots. Bioconjug. Chem. 2015, 26 (8), 1582–1589. https://doi.org/10.1021/acs.bioconjchem.5b00221.
(27) Wang, Q.; Liu, Y.; Ke, Y.; Yan, H. Quantum Dot Bioconjugation during Core–Shell Synthesis. Angew. Chem. Int. Ed. 2008, 47 (2), 316–319. https://doi.org/10.1002/anie.200703648.
(28) Samanta, A.; Deng, Z.; Liu, Y. Infrared Emitting Quantum Dots: DNA Conjugation and DNA Origami Directed Self-Assembly. Nanoscale 2014, 6 (9), 4486–4490. https://doi.org/10.1039/C3NR06578B.
(29) Deng, Z.; Samanta, A.; Nangreave, J.; Yan, H.; Liu, Y. Robust DNA-Functionalized Core/Shell Quantum Dots with Fluorescent Emission Spanning from UV–Vis to Near-IR and Compatible with DNA-Directed Self-Assembly. J. Am. Chem. Soc. 2012, 134 (42), 17424–17427. https://doi.org/10.1021/ja3081023.
(30) Tikhomirov, G.; Hoogland, S.; Lee, P. E.; Fischer, A.; Sargent, E. H.; Kelley, S. O. DNA-Based Programming of Quantum Dot Valency, Self-Assembly and Luminescence. Nat. Nanotechnol. 2011, 6 (8), 485–490. https://doi.org/10.1038/nnano.2011.100.
(31) Zhang, T.; Liedl, T. DNA-Based Assembly of Quantum Dots into Dimers and Helices. Nanomaterials 2019, 9 (3), 339. https://doi.org/10.3390/nano9030339.
(32) Murray, C. B.; Norris, D. J.; Bawendi, M. G. Synthesis and Characterization of Nearly Monodisperse CdE (E = Sulfur, Selenium, Tellurium) Semiconductor Nanocrystallites. J. Am. Chem. Soc. 1993, 115 (19), 8706–8715. https://doi.org/10.1021/ja00072a025.
(33) Peng, X.; Wickham, J.; Alivisatos, A. P. Kinetics of II-VI and III-V Colloidal Semiconductor Nanocrystal Growth: “Focusing” of Size Distributions. J. Am. Chem. Soc. 1998, 120 (21), 5343–5344. https://doi.org/10.1021/ja9805425.
(34) Luo, Z.; Zhang, H.; Huang, J.; Zhong, X. One-Step Synthesis of Water-Soluble AgInS2 and ZnS–AgInS2 Composite Nanocrystals and Their Photocatalytic Activities. J. Colloid Interface Sci. 2012, 377 (1), 27–33. https://doi.org/10.1016/j.jcis.2012.03.074.
(35) Pearson, R. G. Hard and Soft Acids and Bases. J. Am. Chem. Soc. 1963, 85 (22), 3533– 3539. https://doi.org/10.1021/ja00905a001.
(36) Bell, R. A.; Kramer, J. R. Structural Chemistry and Geochemistry of Silver-Sulfur Compounds: Critical Review. Environ. Toxicol. Chem. 1999, 18 (1), 9–22. https://doi.org/10.1002/etc.5620180103.
(37) Leung, B. O.; Jalilehvand, F.; Mah, V.; Parvez, M.; Wu, Q. Silver(I) Complex Formation with Cysteine, Penicillamine, and Glutathione. Inorg. Chem. 2013, 52 (8), 4593–4602. https://doi.org/10.1021/ic400192c.
(38) Song, J.; Ma, C.; Zhang, W.; Li, X.; Zhang, W.; Wu, R.; Cheng, X.; Ali, A.; Yang, M.; Zhu, L.; Xia, R.; Xu, X. Bandgap and Structure Engineering via Cation Exchange: From Binary Ag 2 S to Ternary AgInS 2 , Quaternary AgZnInS Alloy and AgZnInS/ZnS
Core/Shell Fluorescent Nanocrystals for Bioimaging. ACS Appl. Mater. Interfaces 2016, 8 (37), 24826–24836. https://doi.org/10.1021/acsami.6b07768.
(39) Berends, A. C.; Mangnus, M. J. J.; Xia, C.; Rabouw, F. T.; de Mello Donega, C. Optoelectronic Properties of Ternary I–III–VI 2 Semiconductor Nanocrystals: Bright
Prospects with Elusive Origins. J. Phys. Chem. Lett. 2019, 10 (7), 1600–1616. https://doi.org/10.1021/acs.jpclett.8b03653.
(40) Sun, J.; Ikezawa, M.; Wang, X.; Jing, P.; Li, H.; Zhao, J.; Masumoto, Y. Photocarrier Recombination Dynamics in Ternary Chalcogenide CuInS 2 Quantum Dots. Phys. Chem.
Chem. Phys. 2015, 17 (18), 11981–11989. https://doi.org/10.1039/C5CP00034C.
(41) Park, Y. J.; Oh, J. H.; Han, N. S.; Yoon, H. C.; Park, S. M.; Do, Y. R.; Song, J. K. Photoluminescence of Band Gap States in AgInS 2 Nanoparticles. J. Phys. Chem. C 2014,
118 (44), 25677–25683. https://doi.org/10.1021/jp5102253.
(42) Berends, A. C.; Rabouw, F. T.; Spoor, F. C. M.; Bladt, E.; Grozema, F. C.; Houtepen, A. J.; Siebbeles, L. D. A.; de Mello Donegá, C. Radiative and Nonradiative Recombination in CuInS 2 Nanocrystals and CuInS 2 -Based Core/Shell Nanocrystals. J. Phys. Chem. Lett.
2016, 7 (17), 3503–3509. https://doi.org/10.1021/acs.jpclett.6b01668.
(43) Zhong, H.; Zhou, Y.; Ye, M.; He, Y.; Ye, J.; He, C.; Yang, C.; Li, Y. Controlled Synthesis and Optical Properties of Colloidal Ternary Chalcogenide CuInS 2 Nanocrystals. Chem.
Mater. 2008, 20 (20), 6434–6443. https://doi.org/10.1021/cm8006827.
(44) Li, L.; Pandey, A.; Werder, D. J.; Khanal, B. P.; Pietryga, J. M.; Klimov, V. I. Efficient Synthesis of Highly Luminescent Copper Indium Sulfide-Based Core/Shell Nanocrystals with Surprisingly Long-Lived Emission. J. Am. Chem. Soc. 2011, 133 (5), 1176–1179. https://doi.org/10.1021/ja108261h.
(45) Mir, I. A.; Radhakrishanan, V. S.; Rawat, K.; Prasad, T.; Bohidar, H. B. Bandgap Tunable AgInS Based Quantum Dots for High Contrast Cell Imaging with Enhanced Photodynamic and Antifungal Applications. Sci. Rep. 2018, 8 (1), 9322. https://doi.org/10.1038/s41598-018-27246-y.
(46) Chevallier, T.; Le Blevennec, G.; Chandezon, F. Photoluminescence Properties of AgInS 2
–ZnS Nanocrystals: The Critical Role of the Surface. Nanoscale 2016, 8 (14), 7612–7620. https://doi.org/10.1039/C5NR07082A.
(47) Raevskaya, A.; Lesnyak, V.; Haubold, D.; Dzhagan, V.; Stroyuk, O.; Gaponik, N.; Zahn, D. R. T.; Eychmüller, A. A Fine Size Selection of Brightly Luminescent Water-Soluble Ag– In–S and Ag–In–S/ZnS Quantum Dots. J. Phys. Chem. C 2017, 121 (16), 9032–9042. https://doi.org/10.1021/acs.jpcc.7b00849.
(48) Podgurska, I.; Rachkov, A.; Borkovska, L. Effect of Pb 2+ Ions on Photoluminescence of
ZnS-Coated AgInS 2 Nanocrystals. Phys. Status Solidi A 2018, 215 (3), 1700450.
https://doi.org/10.1002/pssa.201700450.
(49) Mansur, A. A. P.; Mansur, H. S.; Tabare, C.; Paiva, A.; Capanema, N. S. V. Eco-Friendly AgInS2/ZnS Quantum Dot Nanohybrids with Tunable Luminescent Properties Modulated by PH-Sensitive Biopolymer for Potential Solar Energy Harvesting Applications. J. Mater. Sci. Mater. Electron. 2019, 30 (18), 16702–16717. https://doi.org/10.1007/s10854-019-00719-0.
(50) Mir, I. A.; Bhat, M. A.; Muhammad, Z.; Rehman, S. U.; Hafeez, M.; Khan, Q.; Zhu, L. Differential and Comparative Sensing Modes of AIS and AIS@ZnS Core-Shell Quantum Dots towards Bioanalytes. J. Alloys Compd. 2019, 811, 151688. https://doi.org/10.1016/j.jallcom.2019.151688.
(51) Song, J.; Jiang, T.; Guo, T.; Liu, L.; Wang, H.; Xia, T.; Zhang, W.; Ye, X.; Yang, M.; Zhu, L.; Xia, R.; Xu, X. Facile Synthesis of Water-Soluble Zn-Doped AgIn 5 S 8 /ZnS Core/Shell
Fluorescent Nanocrystals and Their Biological Application. Inorg. Chem. 2015, 54 (4), 1627–1633. https://doi.org/10.1021/ic502600u.
(52) Turo, M. J.; Macdonald, J. E. Crystal-Bound vs Surface-Bound Thiols on Nanocrystals. ACS Nano 2014, 8 (10), 10205–10213. https://doi.org/10.1021/nn5032164.
(53) Srinivasan, C.; Lee, J.; Papadimitrakopoulos, F.; Silbart, L. K.; Zhao, M.; Burgess, D. J. Labeling and Intracellular Tracking of Functionally Active Plasmid DNA with Semiconductor Quantum Dots. Mol. Ther. 2006, 14 (2), 192–201. https://doi.org/10.1016/j.ymthe.2006.03.010.
(54) Banerjee, A.; Pons, T.; Lequeux, N.; Dubertret, B. Quantum Dots–DNA Bioconjugates: Synthesis to Applications. Interface Focus 2016, 6 (6), 20160064. https://doi.org/10.1098/rsfs.2016.0064.
(55) Carstairs, H. M. J.; Lymperopoulos, K.; Kapanidis, A. N.; Bath, J.; Turberfield, A. J. DNA Monofunctionalization of Quantum Dots. ChemBioChem 2009, 10 (11), 1781–1783. https://doi.org/10.1002/cbic.200900300.
(56) Kim, H.; Jeen, T.; Tran, M. V.; Algar, W. R. Polyacrylamide Gel Electrophoresis of Semiconductor Quantum Dots and Their Bioconjugates: Materials Characterization and Physical Insights from Spectrofluorimetric Detection. The Analyst 2018, 143 (5), 1104– 1116. https://doi.org/10.1039/C7AN01581J.
(57) Hu, S.; Zeng, S.; Zhang, B.; Yang, C.; Song, P.; Hang Danny, T. J.; Lin, G.; Wang, Y.; Anderson, T.; Coquet, P.; Liu, L.; Zhang, X.; Yong, K.-T. Preparation of Biofunctionalized Quantum Dots Using Microfluidic Chips for Bioimaging. The Analyst 2014, 139 (18), 4681–4690. https://doi.org/10.1039/C4AN00773E.
(58) Anderson, G. P.; Glaven, R. H.; Algar, W. R.; Susumu, K.; Stewart, M. H.; Medintz, I. L.; Goldman, E. R. Single Domain Antibody–Quantum Dot Conjugates for Ricin Detection by Both Fluoroimmunoassay and Surface Plasmon Resonance. Anal. Chim. Acta 2013, 786, 132–138. https://doi.org/10.1016/j.aca.2013.05.010.
(59) Vance, S. A.; Sandros, M. G. Zeptomole Detection of C-Reactive Protein in Serum by a Nanoparticle Amplified Surface Plasmon Resonance Imaging Aptasensor. Sci. Rep. 2015, 4 (1), 5129. https://doi.org/10.1038/srep05129.
(60) Fernandez, M.; Urvoas, A.; Even-Hernandez, P.; Burel, A.; Mériadec, C.; Artzner, F.; Bouceba, T.; Minard, P.; Dujardin, E.; Marchi, V. Hybrid Gold Nanoparticle–Quantum Dot Self-Assembled Nanostructures Driven by Complementary Artificial Proteins. Nanoscale 2020, 12 (7), 4612–4621. https://doi.org/10.1039/C9NR09987E.