HAL Id: hal-02566056
https://hal.archives-ouvertes.fr/hal-02566056
Submitted on 12 Nov 2020HAL is a multi-disciplinary open access archive for the deposit and dissemination of sci-entific research documents, whether they are pub-lished or not. The documents may come from teaching and research institutions in France or abroad, or from public or private research centers.
L’archive ouverte pluridisciplinaire HAL, est destinée au dépôt et à la diffusion de documents scientifiques de niveau recherche, publiés ou non, émanant des établissements d’enseignement et de recherche français ou étrangers, des laboratoires publics ou privés.
Modelling energy deposition in TR image plate
detectors for various ion types
V. Lelasseux, J. Fuchs
To cite this version:
V. Lelasseux, J. Fuchs. Modelling energy deposition in TR image plate detectors for various ion types. Journal of Instrumentation, IOP Publishing, 2020, 15 (04), pp.P04002-P04002. �10.1088/1748-0221/15/04/P04002�. �hal-02566056�
Journal of Instrumentation
OPEN ACCESS
Modelling energy deposition in TR image plate
detectors for various ion types
To cite this article: V. Lelasseux and J. Fuchs 2020 JINST 15 P04002
View the article online for updates and enhancements.
Recent citations
Ion species discrimination method by linear energy transfer measurement in Fujifilm BAS-SR imaging plate
M. Nishiuchi et al
2020 JINST 15 P04002
Published by IOP Publishing for Sissa MedialabReceived: October 9, 2019 Revised: January 15, 2020 Accepted: January 16, 2020 Published: April 2, 2020
Modelling energy deposition in TR image plate detectors
for various ion types
V. Lelasseux1and J. Fuchs
LULI — CNRS, CEA, UPMC Univ Paris 06: Sorbonne Université, Ecole Polytechnique, Institut Polytechnique de Paris,
F-91128 Palaiseau cedex, France
E-mail: vincent.lelasseux@polytechnique.edu,julien.fuchs@polytechnique.edu
Abstract: This paper presents an empirical model for the response of Fuji BAS-TR image plate (IP) for various type of energetic ions. This model has been obtained using the works of Bonnet et al. [Rev. Sci. Instrum. 84 (2013) 103510] and Birks [Proc. Phys. Soc. A 64 (1951) 874] and has been confronted to several experimental sets of data, showing its validity and its limits for high Z ions.
Keywords: Detector modelling and simulations I (interaction of radiation with matter, interaction of photons with matter, interaction of hadrons with matter, etc); Solid state detectors
1Corresponding author.
c
2020 The Author(s). Published by IOP Publishing Ltd on behalf of Sissa Medialab. Original content from this work may be used under the terms of theCreative Commons Attribution 3.0 licence. Any further distribution of this work must maintain attribution to the author(s) and the title of the work, journal citation and DOI.
2020 JINST 15 P04002
Contents
1 Introduction 1
2 Background and rationale for the empirical approach 1
3 Results 2
4 Conclusion 6
1 Introduction
Several types of detectors [1] exist in order to diagnose energetic ions. Solid state detectors such as CR-39, radiochromic films (RCF), scintillators or image plates (IP) [2], belong to one type. Passiveness and immunity to electromagnetic pulses are particularly interesting features of such detectors. Among these solid state detectors, IPs use phosphorescent properties to store energy left by energetic particles going through them. Then, this energy can be retrieved with scanners which will stimulate the induced metastable excited states, using photons with a suitable wavelength. Those devices developed by Fujifilm in the early 1980’s have since been quite popular in medicine and physics due to some of their useful features. Indeed, IP can be reused after a 15 min erasing sequence induced by an intense visible light source. Besides, an IP has a high dynamic range (up to 5 order of magnitude) and a very good spatial resolution (down to 10 µm) usually limited by the scanner properties [2]. This dynamic range can even be enhanced using advanced scanning techniques [3].
At the end of the scanning process, the result is an image of quantum levels (QL) which can then be used to calculate photostimulated luminescence (PSL) values which is a function of the incident particles energy [4]. However, there is still no theoretical formula to get the relation between PSL and the energy incident in the detector for any type of ion. Then, a calibration is needed if one wants to retrieve quantitative data from the recorded PSL [2,5–9]. In order to avoid such time-consuming calibrations, this paper will try to find an empirical formula for this problem using Bonnet work [5] and Birks’ formula [10]. Besides, this work will use calibration datasets [2, 5–9, 11, 12] from previous experiments to gauge the adequacy of the method. We will here focus on one type of IPs in particular, the BAS TR ones from Fuji, which main composition is detailed in table1[6].
2 Background and rationale for the empirical approach
Between the IPs irradiation and their scanning, there is always a time lag, allowing for some recombinations to happen. As a consequence, the detectable signal is a time-dependent function
2020 JINST 15 P04002
Table 1. The BAS TR IPs are composed of three different layers as show in this table [2,6]. Layer Width (µm) Composition Density (g.cm−1)
Phosphor 50 BaFBr0.85I0.15 2.85
Support 250 C2H2O 1.66
Magnetic 160 ZnMn2Fe5NO40H15C10 2.77
which is characterized by the fading of the signal in the IP [6]. Bonnet finds that the original signal must be multiplied by the following function to get the detectable signal [6]:
f (t)= 2 Õ i=1 Bie −t βi (2.1)
Those parameters do not seem to depend on the ion type nor their incident energy. However, those parameters depend on the temperature and the scanner used. Using the FLA-7000 scanner at ambient temperature and IPs irradiated by protons of 1.5 MeV, Bonnet finds for the protons:
B1= 0.49, β1= 17.9 min, B2= 0.51, β2= 1482 min
According to Bonnet [5], after multiplying by the fading factor, the IP response is given by:
R(E)= Ai ∫ W 0 dEdep dz (E, z)e −z Ldz (2.2)
where R(E) is the PSL signal for a proton with an initial energy E, W the width of the active layer, Edepthe deposited energy, Aia parameter a priori depending on the ion and the IP type and L is the
absorption length of the scanning photons (2–3 eV).
In order to remove the dependence of eq. (2.2) on a particular ion, we can use the work of Birks [10] that models the specific fluorescence of an organic crystal following its irradiation. Adapting it to model the response of the IP would yield the following empirical formula, independent from the ion:
R(E)=Õ i A ∫ Ci dEdep dz (E, z) 1+ B|dEdzdep| e−zLdz (2.3)
where R(E) is the PSL signal, A a parameter only dependent of the IP, L is the absorption length of the scanning photons (2–3 eV), Cithe route of one ion and B a saturation coefficient.
3 Results
We will now attempt to confront eq. (2.3) to measured calibration data. Using SRIM [13], a compilation of large experimental datasets related to ion energy deposition in matter, it is possible to get the energy deposited as a function of depth (dE/dz), for any ion type and any energy. As shown in table1, the TR IPs are characterized by a 50 µm thick sensitive layer with the composition BaFBr0.85I0.15[6]. From those deposited energies, we can use the following function to calculate a
PSL quantity: R(E)= A ∫ W 0 dEdep dz (E, z) 1+ B|dEdzdep| e−Lzdz (3.1) – 2 –
2020 JINST 15 P04002
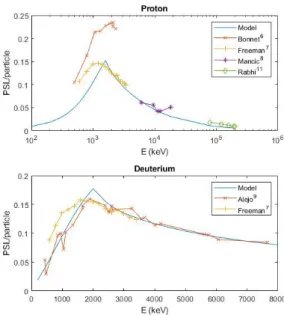
Figure 1. The panels show the PSL response of the TR image plate as measured experimentally by various
groups or calculated (see text). For the calculations, the model uses A = 3.0 × 10⁻⁴ PSL.keV−1 and B= 0.15 µm.eV−1.
From the work of Bonnet [6], we get that L = 44 µm. Using datasets from Bonnet et al. [5,6], Freeman et al. [7], Mancic et al. [8], Doria et al. [2], Alejo et al. [9] and Rabhi et al. [11], we have been able to find parameters for which this model fits pretty well these experimental data. The results for A= 3.0 × 10⁻⁴PSL.keV−1and B= 0.15 µm.eV−1are shown in figure1and figure2.
Aside from the proton calibration data of Bonnet [6], which are not in total agreement with the Freeman dataset [7], we observe in figure1and figure2that the model of eq. (3.1) corresponds quite well to the measured calibrations of the TR IP for proton, deuterium, alpha and carbon ions. The recent work of Strehlow [12] giving calibration data relative to Ti ions, allows to check extending the validity of eq. (3.1) to heavier ions. In this case, as evidenced by figure3, there is however a significant departure between the model and the data.
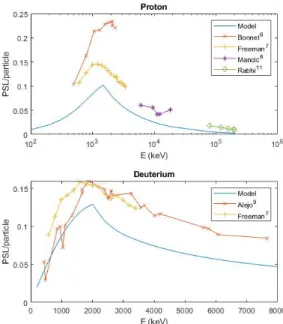
Trying to find parameters, which could fit all the data for the light and heavy ions simultaneously, results in a mediocre compromise as shown in figure4, figure5and figure6. Indeed, we see on those figures that although a good fit can be obtained for the Ti data, this set of parameters underestimates the PSL calibration for very light nuclei (proton and deuterium) and overestimates it for light nuclei (alpha and carbon).
One could wonder about the influence of a component of the phosphor layer which we neglected till now. Indeed, the BaFBr0.85I0.15crystals are embedded in a urethane resin. It’s hard to find the
precise mixture of the crystal and the resin but using the BAS-MS composition [14] and the density of the MS and TR IP’s phosphor layer, we can estimate a 8:1 BaFBr0.85I0.15:urethane mix. Besides,
it’s not possible in SRIM to get the different energy deposited in those two different part of the mix. More complicated Geant4 simulations would then be needed to get more precise results. However, as it can be seen on figure7with proton and Ti ions, the total energy deposition doesn’t change that much when taking or not into account the resin in the mixture. Thus, the presence of the resin is
2020 JINST 15 P04002
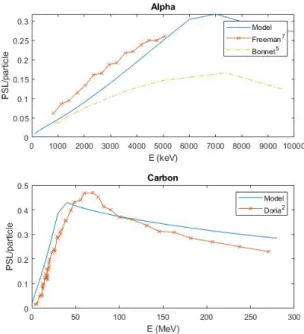
Figure 2. The panels show the PSL response, per incident ion, of the TR image plate as measured experimentally by various groups or calculated (see text). For the calculations, the model uses A= 3.0 × 10⁻⁴PSL.keV−1and B= 0.15 µm.eV−1.
Figure 3. PSL response of TR image plate for Ti measured experimentally and calculated for A= 3.0 ×
10−4PSL.keV−1and B= 0.15 µm.eV−1.
not the factor that can explain the inability of the model to fit both the light and heavy ions energy deposition.
Besides, as can be observed from the case of the carbon curve of figure2and for titanium in figure6, it seems that the PSL response for low energies are always overestimated even if when the fit seems nice. As a consequence, we can wonder if, in general, the models which links deposited energy with the PSL response are still totally accurate for nuclei heavier than helium. Indeed, Doria’s data [2] seems to show that the energy where the PSL response is maximum is higher than the one modelled as can be seen in figure2. One important aspect of the present modeling is that we assumed that there is a one-to-one relation between the energy deposited by the ion in the IP, which is well-known, and the energy stored in the Eu ions metastable states. The difficulty we observe in fitting the model with the data would suggest that the energy transferred by heavy ions to the excited Eu ions in the IP takes other, more efficient, channels than when the energy deposited is low, as for light ions.
2020 JINST 15 P04002
Figure 4. The panels show the PSL response of the TR image plate as measured experimentally by various
groups or calculated (see text). For the calculations, the model uses A = 1.5 × 10⁻⁴ PSL.keV−1 and B= 0.02 µm.eV−1.
Figure 5. The panels show the PSL response of the TR image plate as measured experimentally by various
groups or calculated (see text). For the calculations, the model uses A = 1.5 × 10⁻⁴ PSL.keV−1 and B= 0.02 µm.eV−1.
2020 JINST 15 P04002
Figure 6. PSL response of TR image plate for Ti ions measured experimentally and calculated for A =
1.5 × 10⁻⁴PSL.keV−1and B= 0.02 µm.eV−1.
Figure 7. PSL response of TR image plate for protons and Ti ions measured experimentally and calculated
for A= 3.0 × 10⁻⁴PSL.keV−1and B= 0.15 µm.eV−1and composition with and without urethane resin.
4 Conclusion
Using Birks’ formula [10] and Bonnet’s work [6], we found an empirical formula to estimate the calibration for a type of image plate, the BAS-TR one. Hence, the requisite calibration in order to get quantitative results using image plates can now be avoided for ions with a low Z (e.g. Li). Nevertheless, it seems that this formula doesn’t work with higher Z. Obviously, further investigations are needed to understand the process by which energy is stored in image plates for higher Z ions, especially at energies around where the deposited energy is maximal, to check if the link between PSL and deposited energy needs to be modified.
2020 JINST 15 P04002
Acknowledgments
We acknowledge fruitful discussions with D. Doria (ELI-NP).
This project has received funding from the European Union’s Horizon 2020 research and innovation program under grant agreement no 654148 Laserlab-Europe and from the European Research Council (ERC) (grant agreement No 787539). It was also supported by Grant ANR-17-CE30-0026-Pinnacle from Agence Nationale de la Recherche.
References
[1] P. Bolton, et al., Instrumentation for diagnostics and control of laser-accelerated proton (ion) beams,
Phys. Med. 30(2014) 255.
[2] D. Doria et al., Calibration of BAS-TR image plate response to high energy (3–300 MeV) carbon ions,
Rev. Sci. Instrum. 86(2015) 123302.
[3] M. Thoms, The dynamic range of X-ray imaging with image plates,Nucl. Instrum. Meth. A 389 (1997) 437.
[4] S. Tosaki et al., Evaluation of laser-driven ion energies for fusion fast-ignition research,Prog. Theor. Exp. Phys. 2017(2017) 103J01.
[5] T. Bonnet et al., Response functions of imaging plates to photons, electrons and4He particles,Rev. Sci. Instrum. 84(2013) 103510.
[6] T. Bonnet et al., Response functions of Fuji imaging plates to monoenergetic protons in the energy
range 0.6–3.2 MeV,Rev. Sci. Instrum. 84(2013) 013508.
[7] C. G. Freeman et al., Calibration of a Thomson parabola ion spectrometer and Fujifilm imaging plate
detectors for protons, deuterons, and alpha particles,Rev. Sci. Instrum. 82(2011) 073301.
[8] A. Mančić et al., Absolute calibration of photostimulable image plate detectors used as (0.5–20 MeV)
high-energy proton detectors,Rev. Sci. Instrum. 79(2008) 073301.
[9] A. Alejo et al., Characterisation of deuterium spectra from laser driven multi-species sources by
employing differentially filtered image plate detectors in Thomson spectrometers,Rev. Sci. Instrum. 85 (2014) 093303[arXiv:1408.2978].
[10] J.B. Birks, Scintillations from organic crystals: specific fluorescence and relative response to different
radiations,Proc. Phys. Soc. A 64(1951) 874.
[11] N. Rabhi et al., Calibration of imaging plate detectors to mono-energetic protons in the range 1–200
MeV,Rev. Sci. Instrum. 88(2017) 113301.
[12] J. Strehlow et al., The response function of Fujifilm BAS-TR imaging plates to laser-accelerated
titanium ions,Rev. Sci. Instrum. 90(2019) 083302.
[13] M.D. Z. J.F. Ziegler and J.P. Biersack, SRIM: the stopping and range of ions in matter, Cadence Design Systems, 2008.
[14] M. Stoeckl and A.A. Solodov, Readout models for BaFBr0.85I0.15:Eu image plates,Rev. Sci. Instrum.
89 (2018) 063101.
![Table 1. The BAS TR IPs are composed of three different layers as show in this table [2, 6].](https://thumb-eu.123doks.com/thumbv2/123doknet/13433155.409058/5.892.224.668.164.261/table-bas-tr-ips-composed-different-layers-table.webp)