HAL Id: hal-01006663
https://hal.archives-ouvertes.fr/hal-01006663
Submitted on 16 Jun 2014Development of new test instruments and protocols for
the diagnostic of fuel cell stacks
Sébastien Wasterlain, Denis Candusso, Fabien Harel, Daniel Hissel, Xavier
Francois
To cite this version:
Sébastien Wasterlain, Denis Candusso, Fabien Harel, Daniel Hissel, Xavier Francois. Development of new test instruments and protocols for the diagnostic of fuel cell stacks. Journal of Power Sources, Elsevier, 2011, 196 (12), pp. 5325-5333. �10.1016/j.jpowsour.2010.08.029�. �hal-01006663�
• S. Wasterlain, D. Candusso, F. Harel, X. François, D. Hissel. Development of test instruments and
protocols for the diagnostic of fuel cell stacks. Accepté dans Journal of Power Sources suite à 12th
Ulm ElectroChemical Talks (12th UECT), Neu-Ulm (Allemagne).
Development of new test instruments and protocols
for the diagnostic of fuel cell stacks
Sébastien Wasterlain 1,2, Denis Candusso 1,3,*, Fabien Harel 1,3, Daniel Hissel 1,2, Xavier François 1,4
1
FC LAB, Techn’Hom, rue Thierry Mieg, 90010 BELFORT Cedex, FRANCE
2
FEMTO-ST (UMR CNRS 6174), ENISYS department, University of Franche-Comté
3
INRETS, the French National Institute for Transport and Safety Research
4
UTBM, University of technology Belfort Montbéliard * Corresponding author.
Tel.: +33 3 84 58 36 33; Fax: +33 3 84 58 36 36 E-mail addresses:
sebastien.wasterlain@utbm.fr (Sébastien Wasterlain), denis.candusso@inrets.fr (Denis Candusso),
fabien.harel@inrets.fr (Fabien Harel),
daniel.hissel@univ-fcomte.fr (Daniel Hissel), xavier.françois@utbm.fr.
Abstract
In the area of fuel cell research, most of the experimental techniques and equipments are still devoted to the analysis of single cells or very short stacks. However, the diagnosis of fuel cell stacks providing significant power levels is a critical aspect to be considered for the integration of fuel cell systems into real applications such as vehicles or stationary gensets. In this article, a new instrument developed in-lab is proposed in order to satisfy the requirements of electrochemical impedance studies to be led on large FC generators made of numerous individual cells. Moreover, new voltammetry protocols dedicated to PEMFC stack analysis are described. They enable for instance the study of membrane permeability and loss of platinum activity inside complete PEMFC assemblies.
Keywords: PEMFC; Stack; Characterization; Electrochemical Impedance Spectroscopy; Cyclic Voltammetry; Linear Sweep Voltammetry
1. Introduction
Some important research programs are currently launched to develop new Fuel Cell (FC) generators which can fulfill the durability and reliability requirements of vehicle and stationary applications. For cars and buses, lifetimes over 6000 and 20000 operating hours respectively are expected. In the case of distributed power generation systems, operating lifetimes may exceed 40000 hours. To reach these targets, a considerable research effort is made first to understand the physical and chemical phenomena involved in these new electrochemical components through the development of relevant diagnostic methodologies, second to develop preventive maintenance procedures which would allow detecting at which moment the FC elements must be changed.
FC characterization and diagnostic can be done using numerous experimental methods. These methods can be classified for instance following their capability to obtain valuable and accurate information about the FC system state of health, their performances in terms of time acquisitions, and cost. In this context, electroanalytical methods like Electrochemical Impedance Spectroscopy (EIS), Linear Sweep Voltammetry (LSV) and Cyclic Voltammetry (CV) are considered as efficient and suitable solutions.
EIS has been extensively applied in the field of PEMFC research (study of ageing [1], oxygen reduction reaction [2], diagnostic [3,4]). However, EIS studies usually focus on single cells or short cell assemblies (stacks composed of less than 10 cells) because of the technological limits of the classical impedancemeters. Sometimes, EIS may also appear as an incomplete diagnostic tool since it cannot provide direct and sufficient accurate information about the FC membrane structure and the catalyst activity in the electrodes. The rise of the membrane permeability (inducing a higher crossover of reactants through the electrolyte) and the loss of platinum activity (leading to a decrease of the active area in the electrodes) are nevertheless considered as the main possible causes of FC stack failures [5]. The fuel crossover rate and the true electrochemical active area are generally determined using well-suited electroanalytical methods such as LSV and CV [6,7]. But so far, LSV and CV were also reserved to the study of single cells.
(composed of 60 cells) varies from 0 to 0.8 V during freeze starts experiments [8]. This large cell voltage distribution results from differences in water content, state of degradation or gas flowing conditions in the stack. In their work, Van Nguyen et al. studied a management strategy of liquid water for PEMFC stacks [9]. An important voltage gap between the different individual cell polarization curves was observed on short cell stacks (two and three cell stacks). Yuan et al investigated a PEMFC stack composed of six cells using the EIS method [4]. Some variations in ohmic resistance and charge transfer values depending of the cell tested were observed. Yuan et al. conclude that among the six cells of the stack, the center cells have lower ohmic resistances due to higher temperatures in the middle of the stack. In a recent work, Finsterwalder used a statistical approach to analyze stack reliability issues [10]. The conclusions of the work were the following ones:
- The larger the stack is, the shorter the lifetime (due to early failure of individual cells). - Lifetime becomes more predictable for larger stacks (since maintenance can be better scheduled).
Furthermore, in many theoretical studies, FC stacks are modeled as a single “mean” cell, assuming that all the individual cells have identical behaviors [11,12]. This hypothesis can obviously be done for short stacks and safe FC assemblies operated close to their nominal conditions. However, when dealing with the issues of diagnostic (i.e. with cell failures, with operations in severe conditions) and large stacks dedicated to embedded or autonomous generators, the “mean” cell models are usually not sufficient to satisfy diagnosis purposes. For instance, in the case of a multi-cell generator, most of these models cannot explain some large distributions of the individual cell voltages possibly caused by the gas supply design (e.g. arrangement of the channels in FC bipolar plates) and the cooling system configuration. However, a more limited number of few stack models try to take into account some parameter variation (e.g. cell temperature) in the geometry of FC generators. As an example, the work of Shan et al. can be mentioned. In their study, the authors consider the effect of the cell temperature distribution on the cell voltages [13].
As already suggested, in the FC experimental domain, most of the measurement techniques / equipments are devoted to single cell or very short stack investigations. The need of high-voltage acquisition systems for the EIS characterization of FC power generators led us to develop a new instrument adapted to the analysis of large FC stacks. In section 2 of this paper, we describe a new electrochemical impedance acquisition system based on a novel architecture specially dedicated to the characterization and diagnosis of FC stacks operated in galvanostatic mode. The FC voltage and current acquisitions can be done up to 700 Vrms and 450 A respectively, which enables the test of large FCs with significant power levels for vehicle and stationnary applications. In section 3, we intend to propose new LSV and CV protocols to characterize multi-cell generators (cells and stacks).
2. Home-made impedance spectrometer 2.1. Architecture of the spectrometer
The new impedance spectrometer has been designed using National Instruments materials and Labview® software [14] [15] (Fig. 1). A 1000B PXI chassis is used to implement the different measurement cards. Two types of trigger lines are included in the chassis backplane, which leads to a high precision for the synchronization between the different cards. The synchronization of all digital multimeters (DMM) cards PXI-4071 is guaranteed by a 28.8 MHz internal reference clock. The trigger signal of PXI-4071 cards is produced by a function generator (PXI-5406). An arbitrary function generator (PXI-5406) is connected to the control circuit of the electronic loadbank. The waveform generator can generate five different types of signals (sinus, square, ramp, triangle, and arbitrary) in the voltage range 0-10 V. The electronic load transforms the actuating signal into a regulated load current with DC and AC
component parts (galvanostatic operation). To measure and control the current level, a high accuracy LEM current sensor ITB-300S is used. The current measured by the sensor is changed into voltage by a high precision resistance (5 Ω, 0.2%). The voltage converted by the resistance is measured by a DMM. The stack voltage is measured directly at the “boundaries” of the assembly. At the same time, the voltages of the cells are acquired indirectly using a multiplexer card (PXI-2527). In the current configuration of the system, the multiplexer card can switch up to 31 channels (individual cells or groups of cells). Adding two PXI-2527 cards can permit to perform impedance tests on 93 modules with a maximum compliance voltage of 500 V and a common mode potential of 700 V.
Fig. 1. Scheme of the experimental EIS measurement system developed in-lab. 2.2. Hardware specifications
As summarized in Table 1, the new high voltage impedance spectrometer exhibits strong capabilities for the characterization and diagnostic of multi-cell PEMFC stacks. With regard to its high compliance voltage and common mode potential, the impedancemeter allows investigating the behavior of FC stacks including more than 100 elementary cells [14]. However, the frequency bandwidth is limited in comparison with other commercial solutions (Zahner IM6 and Solartron Modulab [16]). Nevertheless, the frequency bandwidth exhibited by our system matches well with the classical frequency bandwidth of PEMFC generators. Obviously, dimensions, weight and cost were also taken in consideration during the design stage of the instrument.
Table 1 General specifications of the new impedancemeter. Parameters Values 7⋅10-3 < i~ ≤ 450 AC component (i~) I + i~ ≤ 450 i~/2 < I ≤ 450 Current range (A)
DC component (I)
I + i~ ≤ 450
Compliance voltage ±700
Voltage range (Vrms)
Common mode potential ±500
Theoretical frequency bandwidth (Hz) 6.7⋅10-3 - 36⋅10+3
Voltage acquisition channels 31
Dimensions [height, width, depth] (mm) 178 × 270 × 379
Weight (kg) 15
Cost (k€) 19.5
2.3. Software development
A specific Human – Machine Interface (HMI) dedicated to the instrument control and acquisition of impedance spectra has been developed under Labview Real-Time (Fig. 2). The choice of developing the software on a Real-Time target was done with the goal to optimize the synchronization between the acquisition cards (to reduce the errors on complex impedances) but also to control acquisition time (deterministic task). Some subroutines have been created to automatically perform impedance measurements on the cells to be tested. Figure 2 shows a FC test bench and the impedancemeter during the characterization of a PEMFC stack.
2.4. Validation on a twenty cell stack
EIS experiments have been conducted with a twenty cell PEMFC stack, made of graphite bipolar plates, commercial MEAs (Membrane Electrodes Assemblies) and electrode surface areas equal to 100 cm². The tests have been performed using a 2 kW test bench developed in-lab and described in detail in [17]. With this test stand, many physical parameters involved in the stack can be controlled and measured in order to master the FC operating conditions as accurately as possible. Stack temperature, gas flows, and hygrometry rates can be set. Inlet and outlet flows, pressures, temperatures, single cell voltages and load current can be monitored. The principle used for the humidification of reactants is to bubble the gases through deionized water tanks. The dew points are controlled by the water temperatures (temperature sensors: thermocouples K-type). The resulting temperatures and humidity rates are measured at the FC inlets by humidity sensors. At the outlets of the gas bubblers, separators eliminate the liquid phases. The levels in the water tanks are measured by level meters that control the deionized water flows. The humidified gases are supplied to the FC by heating hoses to avoid condensation. The temperatures of water and heating hoses are controlled by PID controllers. At the FC outlets, condensers supplied with cold water lower the gas dew points to about 12 °C. A flow diagram of the test bench and humidification units can be found in [17].
The EIS tests presented in this article were performed in the framework of the French DIAPASON project, which aim is to propose diagnosis strategies for PEMFCs. Diagnostic tools based both on experimental investigations and data analysis solutions have been proposed to detect and classify failures or faulty operation modes so as to prevent or limit FC degradation. The EIS work done in our lab has focused on water management issues and different flooding / drying states, which are usually reversible and quite easy to control, were induced in the FC generator. In the project, all the experimental data were recorded according to a fractional experimental design [18] including 5 operating factors (FC temperature, anode and cathode stoichiometry rates, relative humidity rates at anode and cathode) with 2 levels each. In total, sixteen EIS experiments were led on the twenty cell stack. Different shapes of stack impedance spectrum were recorded following the experiment considered and the levels of the investigated operating parameters.
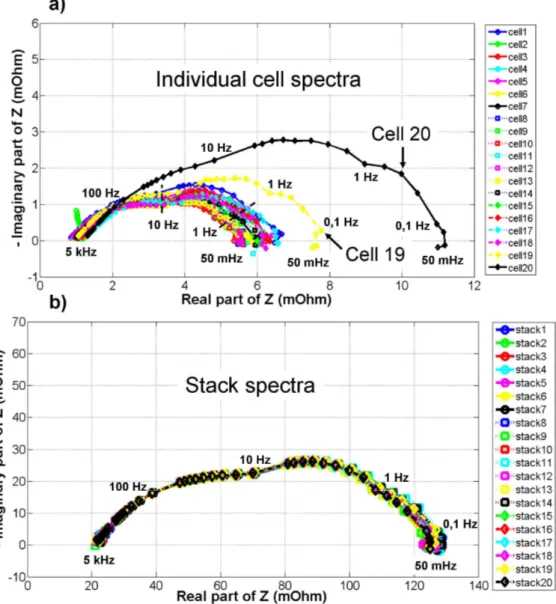
A first example of impedance results, for individual cells and stack respectively, are displayed in Fig. 3(a) and 3(b). The test conditions are the following ones. The polarization current is 50 A (0.5 A/cm²). The FC is fed with humidified hydrogen and air. The anodic and cathodic relative humidities are equal to 75%. The anodic and cathodic stoichiometry rates are set to 1.8 and 3 respectively. The anodic and cathodic inlet pressures are controlled at 1.5 bar, and the FC temperature at 80°C. This particular parameter setting is intended to induce a minor flooding in the FC cathode compartment. The purpose is to highlight a performance variability of the individual cells in the FC assembly through EIS measurements while keeping a stationary polarization state during the complete stack characterization. The frequency of the impedance spectrum is ranging from 50 mHz to 5 kHz. Ten frequencies by decade are used for the frequency bandwidth 5 kHz - 1 Hz, and five frequencies by decade for the frequency range 1 Hz - 50 mHz.
Fig. 3. Impedance results for individual cells (a) and stack (b). Stationary conditions. Note that “stack9” (for instance) is the spectrum recorded at the stack boundaries during the
spectrum acquisition on “cell9”.
In the EIS experiment performed, the impedance of the FC stack (shown in Fig. 3(b): “stack1” … “stack20”) is recorded during each elementary cell impedance analysis (“cell1” … “cell20”). By this way, it can be verified that no drift of the FC stack polarization point occurs during the complete acquisition sequence. According to Fig. 3(b), the behavior of the stack remains in a stationary state and it is slightly governed by oxygen diffusion phenomena at the cathode. The twenty cell stack impedance measurements have analogous shapes and thus, no evidence of drift operating conditions is indicated through the whole experiment. Some comparisons between the various cell impedance spectra are then possible. In Fig. 3(a), the cell impedance results highlight some specific behaviors mainly for two cells in the stack: Cell 19 and Cell 20. Moreover, these cells show the poorest performances with the largest diffusion loops. Their specific behaviors can be related to their positions in the stack. In Fig. 4, a scheme shows the distribution of the flow inlets and outlets on the terminal plates of the investigated FC stack. Problems of hydrogen diffusion may be detected since the two cells are located near the fuel outlet (H2 out in Fig. 4). The problems of hydrogen transport might be caused by an accumulation of water at this FC side. On the investigated stack, the location of
the fuel outlet fitting is upper than the fuel inlet position, which does not make easy the flushing of residual water droplets out of the stack.
Fig. 4. Scheme of the FC used during the EIS tests. Distribution of the flow inlets (in) and outlets (out) on the terminal plates of the stack.
If the stack design can be considered to make assumptions on the singular behaviors of individual cells, some other important factors may also impact the cell voltage distribution (e.g slight non-homogeneity in FC components due to manufacturing processes and stack assembly). In many papers, the authors investigate only the stack response and make the assumption of homogeneous cell responses [11,12,19]. As shown by Fig. 3(a), this strong hypothesis cannot always be verified for large PEMFC systems and it might not be relevant in the frame of diagnostic approaches. Clearly, the impedance spectrum record on each cell (or possibly on groups of cells) appears to be a key task when dealing with diagnostic issues of PEMFC. Diagnosis works lead to the setting of difficult operating conditions for the FC. Therefore, the polarization point may drift from its initial position, inducing a more complex analysis of the impedance results. Some authors propose to use mathematical tools to resolve the problem of systems with states that change with time [20]. Whereas some other authors recommend using multi-sine injection in order to limit the consequence of polarization point drift [21]. These approaches can be implemented in our acquisition system and we plan to integrate them in further development works. However, at this stage, we propose to check that no drift occurs during cell impedance spectrum acquisition.
Another example of EIS experiment is considered. The operating conditions of the previous test are applied (e.g. polarization current of 50 A), excepted for the stoichiometric rates (3 at anode side and 2 at cathode side) and the cathodic relative humidity (35%). Figures 5(a) and 5(b) show the impedance results of the cells and stack respectively. With the selected operating conditions, a good example of a PEMFC system drifting during a characterization procedure can be exhibited in Fig. 5. Similarly to Fig. 3(a), Fig. 5(a) shows specific behaviors for Cell 19 and Cell 20, and suggests non-optimal stack design, gas supply (e.g. arrangement of the channels in FC bipolar plates) and cooling system configuration. With regard to Fig. 5(b), a direct comparison between the individual cell impedance spectra is not possible due to
Fig. 5. Impedance results for individual cells (a) and stack (b). Non stationary conditions. Note that “stack9” (for instance) is the spectrum recorded at the stack boundaries during the
spectrum acquisition on “cell9”. 3. LSV and CV experimental protocols for FC stacks 3.1. Linear Sweep Voltammetry
PEMFC electrolyte permeability to reactants (hydrogen, oxygen) and electrons is considered as a critical factor which reduces FC performances and lifetime [6]. The gas permeability through the membrane has been widely studied [22-24]. The gas permeation phenomenon can occur only if there is a partial pressure gradient between the anode and cathode compartments. Although the gas permeation of both hydrogen and oxygen is possible, the oxygen permeation occurs at a rate well below the hydrogen one. In their work, Sakai et al. have observed that the oxygen permeation rate is twice smaller than the hydrogen one [25]. Some other works, like those of Ogumi et al. have confirmed these results [23]. The work of Yoshitake et al. noticed an oxygen permeation rate much lower (7 times less) [22]. As a matter of fact, the effects of oxygen permeation are neglected in many scientific works. Besides, the nitrogen content in the air at cathode can also cross the electrolyte. At anode side, the accumulation of nitrogen at the bipolar plate’s outlet reduces the concentration of hydrogen in this area, which may result in a local hydrogen starvation [6].
The first consequence of Hydrogen Oxidation Reaction (HOR) at cathode side is a decrease of the Open Circuit Voltage (OCV) [26]. It is also possible that hydrogen reacts directly with oxygen (combustion reaction) present in the membrane or at the cathode layer / membrane interface. This exothermic reaction destroys the MEA structure and leads to the formation of pinholes / holes in the membrane. Several factors may influence the gas permeability rate such as: chemical composition, thickness, microstructure of the membrane, and the operating parameters (gas relative humidity, inlet pressures, temperatures…).
LSV is a powerful tool allowing the estimation of hydrogen crossover and the detection of any internal electronic short between anode and cathode. LSV is an electro-analysis method based on the measurement of the electrons flow at the working electrode (at cathode), resulting from HOR at cathode side. The electrons flow at the working electrode is measured while the potential between the working electrode and a pseudo-reference electrode (at cathode) is swept linearly but slowly in time. Oxidation of hydrogen species is registered as a peak in the current signal for potential ranging from 50 to 400 mV. Generally, a scan rate between 1 and 4 mV⋅s-1 is adopted. In order to prevent platinum oxidation, the scan potential range is limited from 0 to 0.8 V [27]. In LSV experiments, the anode is usually fed with hydrogen while the cathode is supplied with nitrogen.
Faraday’s Law Eq. (1) can be used to estimate the hydrogen crossover flux NH2 (mole⋅s-1⋅cm -2 ): F n I NH2 × = (1)
Where I (A⋅cm-2) represents the electron flow per unit of area produced at the working electrode; n is the number of electrons required per reaction (HOR = 2), and F is the
Faraday’s constant (96485 C⋅mole-1).
The use of membranes with low thickness (~ 20 µm) enables to increase the FC performance by limiting the ohmic losses. However, these membranes may lead to electrons permeation through the electrolyte. The determination of its internal electronic resistance (the so-called short-circuit resistance) can possibly be used as a membrane state of health indicator. The presence of an internal short-circuit, caused by the passage of electrons through the membrane is represented by a positive slope for potentials above 0.4 V approximately [6]. The short-circuit resistance RSC (Ω⋅cm2) is defined by the Ohmic Law from 0.4 to 0.6 V (Eq. (2)).
I V RSC ∆ ∆ = (2)
Where, ∆V represents the voltage interval (V) used to determine the internal short-circuit
resistance and ∆I the associated current density (A⋅cm-2).
To date and as it was already mentioned, the studies dealing with fuel crossover issues have focused on single-cell generators. To our knowledge, no article deals with this type of
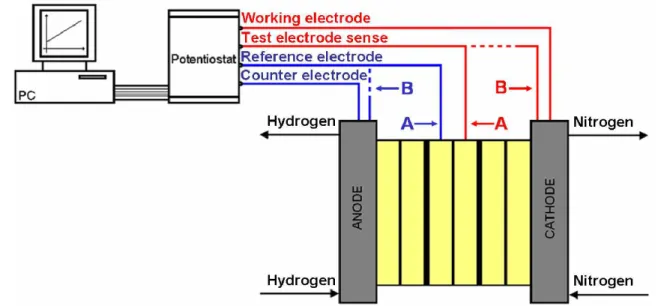
single cell located inside the FC stack, the working and counter electrodes (load current circuit) are connected respectively to the cathode and anode of the FC generator. The pseudo-reference electrode (voltage circuit) is connected to the FC anodic electrode that we aim to study, while the test electrode (voltage circuit) sense is connected to the FC cathodic electrode of the same cell.
Fig. 6. Potentiostatic assembly dedicated to the fuel crossover measurements for one individual cell in the FC stack (A) and for the whole FC generator (B).
For the characterization of one cell in the generator, the potential difference applied between the pseudo-reference electrode and the test electrode sense should not exceed 0.8 V in order to avoid any platinum nanoparticles oxidation. For the characterization of a FC stack, the potential difference (VDDP) in (V) to be applied between the pseudo-reference electrode and the test electrode sense depends on the number of cells which compose the FC assembly. It is defined by Eq. (3): cells of number 8 . 0 VDDP = × (3)
Similarly, the sweep rate depends on the selected value for one cell (for example 2 mV⋅s-1) and on the number of cells as well. Its value (VSC) in (V) can be defined by Eq. (4):
cells of number 2
Vsc = × (4)
To establish Eq. 3 and 4, we assume in a first approach that all the cells in the FC behave in a homogeneous way during the stack characterization. Therefore, we consider also that the sweep rates applied to the cells are fairly uniform. Our assumptions and protocols are at least valid for a FC generator that does not exhibit too much large heterogeneities in the behaviors of its individual cells.
An example of LSV record obtained at the boundaries of a three cell PEMFC stack is displayed in Fig. 7. The corresponding LSV test results are given in Table 2. Here, the measurements were done with a Zahner potentiostat (IM6 and PP240 module) [16]. The fuel crossover values measured for each cell and for the complete generator are displayed. The FC experiments were performed at atmospheric pressure, ambient temperature (25 °C), relative
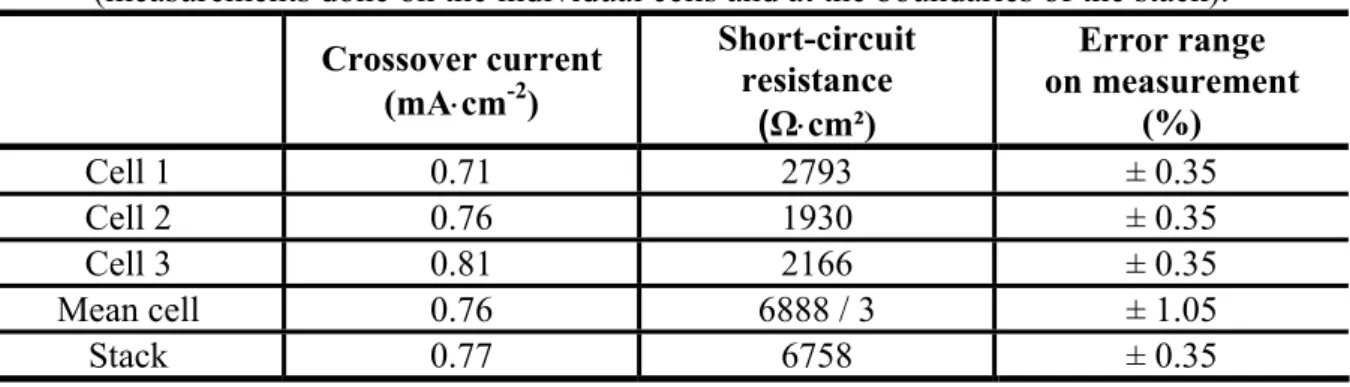
hygrometry of 30% at the anode and 90% at the cathode. In this case, the operating conditions were defined with the aim to validate the voltammetry measurement method and not to induce particular conditions leading to any FC performance degradation. Constant flows of hydrogen and nitrogen equal to 1.5 Nl⋅min-1 were applied. A scan rate of 2 mV⋅s-1 was selected. Finally, the voltage explored for a cell was ranging between 15 mV and 800 mV and the voltage varied from 50 mV to 2.4 V during the characterization of the complete generator. The fuel crossover currents measured for each cell show no membrane degradation. However, an inhomogeneity in the results can be observed (Table 2). The fuel crossover current increases linearly with the position of the cell in the generator (+14% between Cell 3 and Cell 1). This observation on the fuel crossover current can be attributed to the stack design (all fluidic inlets and outlets of this three cell stack are located on the same terminal plate), and explained by the distribution of the hydrogen partial pressure at anode [28]. The value measured on the complete generator fits well with the arithmetic average of the three cell values (1.32%), which let us suggest that the measure on the complete generator can give a good picture of its overall state of health. In Table 2, a significant change in the short-circuit resistance value can be observed (-31% from Cell 1 to Cell 2). A high value of the electrical short-circuit resistance is needed to obtain elevated FC performances. Generally, a value up to 1000 Ω⋅cm² is suggested. The good match between the sum of the individual cell resistances and the resistance measured at the boundaries of the generator shows that the different measurements are consistent (error of 1.93%).
The slight differences observed in Table 2 between the “Mean cell” and “Stack” values can be explained by considering the error intervals related with the measurement accuracies. Since crossover current level and short-circuit resistance are determined in the LSV diagram both from current and voltage information, a global error of ± 0.35% can be expected for one measurement, according to the manufacturer of the potentiostat used in these experiments (error on voltage of ± 0.1% cumulated with the error on current of ± 0.25%) [16]. The “Mean cell” values are computed from three measurements and thus, they are given with an accuracy of ± 1.05%.
The measurement errors allow explaining a large part of the small gaps observed between the values determined from the individual cells and the values measured at the boundaries of the stack. However, other additional explanations can be found. Indeed, it is also possible that the individual cells interact, leading to mutual leaking effects. However, at this stage of our work, this phenomenon seems to be difficult to be taken into account from an experimental point of view. Further investigations in terms of experimentation and possibly modeling phases are needed to clarify this issue.
Table 2 Fuel crossover currents and short-circuit resistances in a three cell stack (measurements done on the individual cells and at the boundaries of the stack).
Crossover current (mA⋅cm-2) Short-circuit resistance (Ω⋅cm²) Error range on measurement (%) Cell 1 0.71 2793 ± 0.35 Cell 2 0.76 1930 ± 0.35 Cell 3 0.81 2166 ± 0.35 Mean cell 0.76 6888 / 3 ± 1.05 Stack 0.77 6758 ± 0.35 3.2 Cyclic Voltammetry
Another well-suited tool to study the FC behavior is the CV. As for LSV experiments, the FC is fed with hydrogen at the working electrode (anode) and inert gas (nitrogen, helium) at the counter / pseudo-reference electrode (cathode), respectively. The electrocatalytic performances of the FC electrodes can be studied by ex situ or in situ voltammetry
experiments. In the case of ex situ experiments (also known as half-cell experiments), an
aqueous solution of acid can be used to simulate the proton conductivity and to determine the electrode properties. However, in situ experiments realized on a complete FC lead to a
two-electrode configuration in which one of the two-electrodes (typically the anode) serves both as pseudo-reference electrode and counter electrode. Most of the time, researchers analyze the electrochemical activity of the FC cathode because of the sluggish kinetics of the oxygen reduction reaction. Akin to LSV experiments, the voltage of the working electrode is swept to noble potentials and the hydrogen molecules that cross over the membrane are instantly oxidized. In contrast to LSV experiments, an additional reverse potential scan is performed during a CV experiment. In CV tests, the potential of the working electrode is swept first from low potentials to high potentials to oxidize the adsorbed hydrogen (Hads) at catalyst layer to H+ (Eq. (5)) in the potential region ranging from 0.4 to 0.05 V. Then, the potential is swept back (from high potentials to low potentials) to electrochemically reduce protons to adsorbed hydrogen molecules (Hads) (Eq. (6)) in the potential region 0.05 V - 0.4 V.
− + + +H e Pt H Pt- ads → (5) ads H Pt e H Pt+ + + − → - (6)
In comparison to LSV experiments, the sweep rate value in CV experiments is higher in order to increase the oxidation / reduction peak size. Nevertheless, a higher sweep rate induces more impedance losses in the porous electrodes [29] and may lead to a kinetic controlled system (irreversible system). Identically to LSV experiments, the oxidation or reduction reaction involves an electrons flow between the working electrode and the potentiostat. Some examples of typical cyclic voltammograms recorded on a five cell PEMFC stack are displayed in Fig. 8 and 9. The voltammograms exhibit multiple current peaks associated with both the oxidation and reduction reactions. The integration of these various peaks at low voltage range (shaded area in Fig. 8) provides some information about the electrochemical active area (ECA). The ECA available at the electrode can be determined by considering Eq. (7). The atomic hydrogen adsorption / desorption charge density (Q) can be estimated using the
L Q ECA × = Γ (7)
Where Q is the atomic hydrogen adsorption / desorption charge density (C⋅cm-2), Γ is the mean quantity of charge needed to reduce a monolayer of protons on platinum surface (210 µC⋅cm-2) and L represents the platinum loading in the electrode (g Pt⋅cm-2).
Fig. 8. Example of cyclic voltammograms recorded at the boundaries of a five cell stack (using the B configuration of the test scheme proposed in Fig. 6).
Fig. 9. Example of cyclic voltammograms recorded on each individual cell of a five cell stack (using the A configuration of the test scheme proposed in Fig. 6).
Additionally, the characteristics of the adsorption / desorption peaks can provide some information about the platinum crystal planes used for the adsorption / desorption of the hydrogen species (Fig. 9) [30]. One drawback of this technique for assessing supported electrocatalysts is that the carbon features interact with the hydrogen adsorption and desorption characteristics (double layer charging and redox behavior of surface active groups on carbon), leading to an underestimation / overestimation of ECA [31].
Until now, the study of the ECA in PEMFCs has been carried out on single-cell generators. To our knowledge, no paper deals with this kind of experiment conducted on multi-cell generators. The potentiostat scheme used to determine both ECA on complete generator and individual cells is identical to the one presented in Fig. 6. The electrode under investigation (generally the cathode) is supplied by an inert gas such as nitrogen while the other electrode is fed with hydrogen. Similarly to LSV experiments, the potential difference applied between the pseudo-reference electrode and the test electrode sense should not exceed 0.8 V per cell in order to avoid any platinum nanoparticles oxidation (Eq. (3)). Similarly, the sweep rate also depends on the number of cells. Its value (Vsc) is defined by Eq. (8), considering a scan rate of 40 mV⋅s-1 for one cell:
cells of number 40
Vsc = × (8)
Again, we assume in our approach that the cells in the stack behave in a homogeneous way and we consider that the sweep rates applied on the individual cells are uniform. Cyclic voltammograms recorded for the complete generator (five cell stack) and for each cell in the
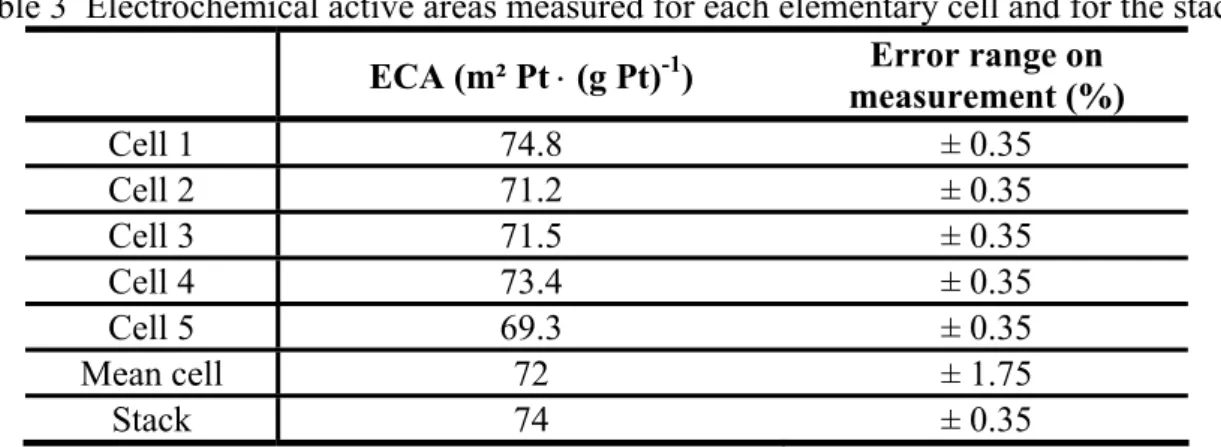
stack are shown in Fig. 8 and 9 respectively. The experiments were performed on a new FC at 80 °C, at atmospheric pressure, with relative hygrometry at anode and cathode equal to 45%. Some constant flows of hydrogen and nitrogen gas (1.5 Nl⋅min-1) were used. A scan rate of 40 mV⋅s-1 was applied. In this case, the ECA was determined considering hydrogen desorption. Finally, the voltage explored for a cell was ranging between 50 mV and 700 mV and the voltage varied from 50 mV to 3.5 V during the characterization of the complete generator. In Fig. 8, the cyclic voltammogram measured on the stack has similar shape / peaks to those recorded on the individual cells (Fig. 9). Figures 9 and Table 3 do not exhibit strong variation of ECA between individual cells, which is coherent with the expected behavior of a new FC. Moreover, the ECA value measured on the complete generator fits well with the arithmetic average of the ECA measured for the five cells (difference of 2.8%). Like for LSV, the small gap observed between the two values can be related to errors on current and voltage measurements done with the potentiostat [16]. The error ranges are given in Table 3 for the various measurements. Further explanations can be given by considering the work of Kumpulainen et al. In [32], a close relation between the duration at which humidified gases
are applied and the ECA value is observed. According to this study, the ECA evolves noticeably during the first hour following the FC supply with humidified gases. In our experiments, the various operating parameters have been set cautiously in order to obtain reproducible and meaningful measuring results. However, small differences in the gas flow and humidification time durations may also have impacted the test results.
Table 3 Electrochemical active areas measured for each elementary cell and for the stack. ECA (m² Pt ⋅ (g Pt)-1) Error range on
measurement (%) Cell 1 74.8 ± 0.35 Cell 2 71.2 ± 0.35 Cell 3 71.5 ± 0.35 Cell 4 73.4 ± 0.35 Cell 5 69.3 ± 0.35 Mean cell 72 ± 1.75 Stack 74 ± 0.35 4. Conclusions
This paper deals with new test instruments and protocols dedicated to the characterization and diagnostic of fuel cell stacks. EIS, LSV, and CV methods are concerned.
In a first part, a new electrochemical impedance spectrometer allowing the test of large FC stacks has been presented. In order to validate this acquisition system and to demonstrate some of its capabilities, some experiments were conducted on a twenty cell PEMFC stack. The instrument was used to highlight some singular physical behaviors and performances of individual cells located inside the FC assembly. The EIS results presented as examples in this article were obtained with a polarization current of 50A. However, EIS characterization can be done with polarization currents up to 450A (this value corresponds to the maximal value
impedancemeter could diagnose up to 93 channels. In order to limit impedance acquisition durations and possible effects of polarization point drifts, multi-sine injection and analysis have to be implemented on the new impedancemeter. This can be done without changing any hardware part of the apparatus.
In a second part, voltammetry experiments were conducted on short FC stacks with a Zahner commercial potentiostat. The fuel crossover phenomenon in a three cell PEMFC stack was analyzed using the LSV method. The crossover rates were determined for each individual cell inside the complete assembly and for the whole stack as well. A minor variability in the membrane permeability values was detected, but growing levels versus cell position along the investigated FC stack were also highlighted. The relevance of our measurement method was indicated by a strong similarity between the sum of the crossover rates measured on each cell and the permeability value recorded on the entire stack. Similarly, CV was applied successfully on a five cell stack. The results obtained, in terms of ECA determination (both for individual cells and stack), have also confirmed the suitability of our approach. In order to validate the voltammetry protocols on larger multi-cell stacks, well-suited potentiostats are needed.
Acknowledgement:
This Ph.D work is a contribution to the PAN-H ANR DIAPASON project (fuel cell diagnosis methods for vehicle and stationary applications without intrusive sensors).
References :
[1] S.J.C. Cleghorn, D.K. Mayfield, D.A. Moore, J.C. Moore, G. Rusch, T.W. Sherman, N.T. Sisofo, U. Beuscher, J. Power Sources. 158 (2006) 446-454.
[2] A. Parthasarathy, B. Dave, S. Srinivasan, AJ. Appleby, J Electrochem Soc. 139 (1992) 1634-1641.
[3] X. Yuan, J.C. Sun, M. Blanco, H. Wang, J. Zhang, D.P.Wilkinson, J Power Sources. 161 (2006) 920-928.
[4] X. Yuan, J.C. Sun, H. Wang, J. Zhang, D.P.Wilkinson, J Power Sources. 161 (2006) 929-937.
[5] J. Wu, X.Z. Yuan, J.J. Martin, H. Wang, J. Zhang, J. Shen, S. Wu, W. Merida, J. Power Sources. 184 (2008) 104-119.
[6] S.S. Kocha, J.D. Yang, J.S. Yi, AIChE J. 52 (2006) 1916-1925.
[7] S. Wasterlain, D. Candusso, D. Hissel, F. Harel, P. Bergman, P. Menard, M. Anwar, J. Power Sources. 195 (2010) 984-993.
[8] E. Schießwohl, T. von Unwerth, F. Seyfried, D. Brüggemann, J. Power Sources. 193 (2009) 107-115.
[9] T. Van Nguyen, M. W. Knobbe, J. Power Sources. 114 (2003) 70-79.
[10] F. Finsterwalder, PEFC Stack Durability in Automotive Applications, Oral Presentation at International workshop on degradation issues in fuel cells. Hersonessos, Greece, 2007. [11] J. Jia, Y. Wang, Q. Li, Y.T. Cham, M. Han, IEEE Trans. Energy Convers. 24 (2009) 283-291.
[12] M. Uzunoglu, M.S. Alam, IEEE Trans. Energy Convers. 21 (2006) 767-775. [13] Y. Shan, S.-Y. Choe, J. Power Sources. 158 (2006) 274-286.
[14] S. Wasterlain, F. Harel, D. Candusso, D. Hissel, X. François, Proc. Electromotion - EPE Joint Symposium, Chapter “Electric Drives”, Lille, France, 2009.
[15] S. Wasterlain, Experimental and probabilistic analysis for the diagnostic of PEM fuel cells, PhD Thesis (in French), Belfort – France, 2010, http://tel.archives-ouvertes.fr/tel-00474356/en/.
[16] Zahner - Elektrik GmbH & CoKG – Germany, http://www.zahner.de. [17] S. Begot, F. Harel, J.M. Kauffmann, M.C. Péra, Fuel cells (2008) 23-32.
[18] B. Wahdame, D. Candusso, X. François, F. Harel, J-M. Kauffmann, G. Coquery, Int. J. Hydrogen Energy. 34 (2009) 967-980.
[19] X. Yan, M. Hou, L. Sun, D. Liang, Q. Shen, H. Xu, P. Ming, B. Yi, Int. J. Hydrogen Energy. 32 (2007) 4358-4364.
[20] C.A. Schiller, F. Richter, E. Gülzow, N. Wagner, Phys Chem Chem Phys. 3 (2001) 374-378.
[22] M. Yoshitake, M. Tamura, N. Yoshida, T. Ishisaki, Denki Kagaku 64 (1996) 727- 736. [23] Z. Ogumi, Z. Takehara, S. Yoshizawa, J. Electrochem. Soc. 131 (1984) 769-773.
[24] M. Inaba, T. Kinumoto, M. Kiriake, R. Umebayashi, A. Tasaka, Z. Ogumi, Electrochim. Acta. 51 (2006) 5746-5753.
[25] Sakai, H. Takenaka, N. Wakabayashi, Y. Kawami and E. Torikai, Bull. Gov. Ind. Res. Inst. 36, Osaka, Japan, 1985.
[26] J. Zhang, Y. Tang, C. Song, J. Zhang, H. Wang, J. Power Sources. 163 (2006) 532-537. [27] V. Ramani, H.R. Kunz, J.M. Fenton, J Membr Sci. 232 (2004) 31-34.
[28] F.A. de Bruijn, V.A.T. Dam, G.J.M. Janssen, Fuel Cells 8 (2008) 3-22.
[29] E.A. Ticianelli, C.R. Derouin, S. Srinivasan, J Electroanal. Chem. 251 (1988) 275–295. [30] H.-T. Kim, K.-Y. Song, T. V. Reshetenko, S.-Il Han, T.-Y. Kim, S.-Y. Cho, M.-Ki Min, G.-S. Chai, S.-C. Shin, J. Power Sources. 193 (2009) 515-522.
[31] J. Wu, X.Z. Yuan, H. Wang, M. Blanco, J.J. Martin, J. Zhang, Int. J. Hydrogen Energy. 33 (2008) 1735-1746.
[32] H. Kumpulainen, T. Peltonen, U. Koponen, M. Bergelin, M. Valkiainen, In Situ Voltammetric Characterization of PEM Fuel Cell Catalyst Layers, (2002), VTT/RN-2137, ISBN-951-38-5887, Report available at http://www.vtt.fi/inf/pdf/tiedotteet/2002/T2137.pdf