The effect of long term weathering on hemp and rapeseed concrete
Sheridan, J., Sonebi, M., Taylor, S., & Amziane, S. (2020). The effect of long term weathering on hemp and rapeseed concrete. Cement and Concrete Research, 131, [106014].
https://doi.org/10.1016/j.cemconres.2020.106014
Published in:
Cement and Concrete Research
Document Version:
Publisher's PDF, also known as Version of record
Queen's University Belfast - Research Portal:
Link to publication record in Queen's University Belfast Research Portal
Publisher rights © 2020 Elsevier Ltd.
This manuscript is distributed under a Creative Commons Attribution-NonCommercial-NoDerivs License
(https://creativecommons.org/licenses/by-nc-nd/4.0/), which permits distribution and reproduction for non-commercial purposes, provided the author and source are cited.
General rights
Copyright for the publications made accessible via the Queen's University Belfast Research Portal is retained by the author(s) and / or other copyright owners and it is a condition of accessing these publications that users recognise and abide by the legal requirements associated with these rights.
Take down policy
The Research Portal is Queen's institutional repository that provides access to Queen's research output. Every effort has been made to ensure that content in the Research Portal does not infringe any person's rights, or applicable UK laws. If you discover content in the Research Portal that you believe breaches copyright or violates any law, please contact [email protected].
The effect of long term weathering on hemp and rapeseed concrete
1 2
Joseph Sheridan¹*, Mohammed Sonebi¹, Su Taylor¹, Sofiane Amziane² 3
4
¹Queen’s University Belfast, School of Natural and Built Environment, Belfast, BT7 1NN, UK 5
²Université Blaise Pascal, Institut Pascal, Polytech Clermont-Ferrand, 63174, Aubière, France 6
*Corresponding author; e-mail: [email protected] 7
8
Abstract
9
Two vegetal aggregate types are studied for their performance regarding immersion and 10
outdoor weathering. The most widely researched bio-aggregate to date is hemp shiv; which is used in 11
this study as well as chopped rapeseed straw which is an alternative bio-aggregate widely available in 12
the UK. In this study the binder used is Vicat prompt natural cement as well as a viscosity modifying 13
agent (VMA) admixture. It was found that the hemp aggregate produced the most durable concrete 14
when compared to rapeseed, and the addition of a VMA resulted in a much more durable material for 15
both aggregate types. Organic and inorganic leaching was also investigated, and it was found that the 16
binder and soluble organics were leaching from all of the concrete types. 17
18
Keywords
19
Hemp; rapeseed straw; VMA; weathering; leaching 20 21 22 23 24 25 26 27 28 29 30 31 32
Introduction
33
In recent decades subjects such as sustainability, carbon footprint and pollution are issues 34
that have become increasingly important and well known to people on a global scale. It is widely 35
recognised that the human race is required to revise its stance on these issues as industry, 36
construction, energy and transport cause degradation to the environment and the planet as a whole. 37
Thus, sustainability has a necessary focus in research across the globe. 38
Concrete is the second most consumed resource by the human race after water [1] and the 39
construction sector as a whole is an industry with a vast carbon footprint. Indeed, the production of 40
cement alone accounts for 5% of the entire world’s CO₂ output according to The Cement Sustainability 41
Initiative [2], or 7% according to Malhotra [3]. This prediction is based on the fact that 1 tonne of 42
cement produced results in 1 tonne of CO₂ released into the atmosphere [4]. The International Energy 43
Agency (IEA) reported that 4.1 Gt of cement was produced in 2017, resulting in 4.1 Gt of CO₂ emissions 44
and the consumption of 10.5 Ej of energy [5]. 45
The data presented in the previous paragraph, along with the additional fact that energy 46
consumption within the building sector needs to be reduced, has led to a focus in research on more 47
sustainable building materials. Energy use within buildings can be greatly reduced simply by better 48
insulation. It is reported by Eurostat [6] that 25.7% of all energy used in the European Union in 2013 49
was in households, slightly ahead of industry (25%) and behind only transport (33.2%). It is reported 50
by the UK Department of Energy & Climate Change that in the UK the amount of household energy 51
that is used in heating space amounted to 62% [7]. Based on these figures roughly 15.9% of all energy 52
used was in the heating of space. This is a number that has potential to be reduced by the use of new 53
and improved building materials that are both sustainable to produce and also provide excellent levels 54
of insulation. Both of these energy sectors need to be improved, and their carbon footprint reduced 55
if the EU is to attain its global emissions targets of a reduction in greenhouse gas emissions of 40% for 56
2030 and 80% for horizon 2050 compared to the 1990 level. 57
One such material type that has the potential to achieve both of these targets is vegetal 58
concretes. Considerable research has been conducted into bio-based building materials; however, the 59
long-term durability of vegetal concretes is something that still needs to be investigated in depth. 60
Several durability mechanisms have been studied thus far; from biological aging [8], [9], fire exposure 61
[10], wetting and drying with variable humidity cycles [9], [11], carbonation [12], [13], salt exposure 62
and freeze-thaw [14]. 63
Limited studies have also been conducted on immersion weathering [15]–[18] however, more 64
research is needed. Despite the mentioned investigations being a good start, the total experiment 65
length, as well as the actual cycle lengths are not long enough to adequately investigate the effect of 66
immersion weathering of vegetal concretes. 67
Leaching of vegetal aggregates is also investigated in this paper due to its obvious link to the 68
immersion weathering mechanism. It is known that particular constituent parts of a plant’s chemical 69
makeup are soluble, such as hemicellulose [19] and lignin [20]. It has also been highlighted by Sedan 70
et al. [21], [22] that pectin has the ability to be problematic in a cementitious matrix. This is because 71
they have an affinity for calcium ions and react with them to form a non-reactive gel. If pectin is 72
reacting with calcium ions then those ions are not available for hydration, leading to a retarding effect 73
in the concrete’s strength development. Thus, the leaching of pectin will be closely monitored in the 74
leaching experiment. 75
The aim of this paper is to investigate the long-term weathering resistance of hemp and 76
rapeseed concrete. This will be accomplished by firstly evaluating the resistance of the vegetal 77
concretes to full immersion weathering using changes in mass, cross-section and compressive strength 78
as testing parameters. Following this, the same parameters will be used to investigate the effect of 79
long-term outdoor weathering under natural conditions. Finally, the organic and inorganic leaching of 80
the vegetal concretes will be investigated by measuring the amount of organic material and calcium 81
content of the leaching experiment testing water. The mixes used in this investigation were developed 82
in a previous investigation by Sheridan et al. [23] and so a polyacrylic acid admixture is also used and 83
its resistance to long term immersion weathering will be studied. 84 85
Methodology
86Materials
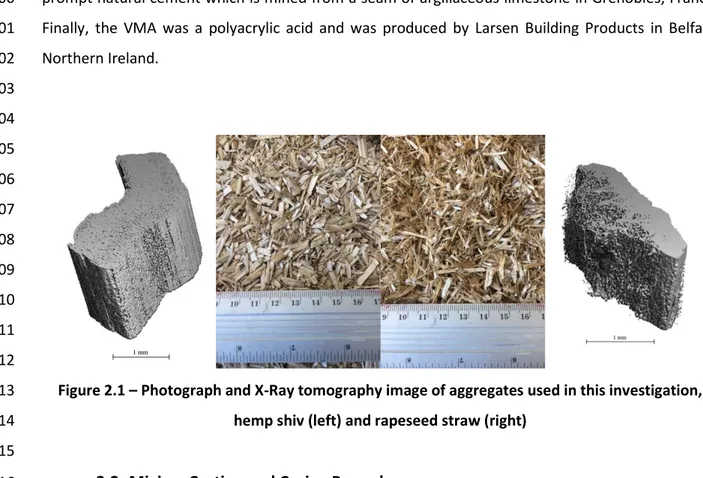
87The two aggregates that were used in this investigation were hemp shiv grown and packed in 88
Driffield, East Yorkshire in the UK, and chopped rapeseed straw that was chopped and packed in 89
County Kildare in Ireland (Figure 2.1). These aggregates were characterized in detail in an investigation 90
conducted by Sheridan et al. [23]and so will not be repeated here, however it was found that the 91
hemp aggregate used in this investigation was found to be larger, denser and more circular than the 92
rapeseed aggregate. The hemp aggregate also absorbed less water (around 40 % by mass after 24 93
hours of immersion). X-Ray tomography images are included in Figure 2.1 to illustrate the differences 94
in the makeup of the two aggregates. There are clear and large vertical pores on the top face of the 95
hemp stalk, and these are the pores that would carry water and nutrients further up the plant when 96
it was alive. The composition is slightly different with the rapeseed straw, as it can be seen that 97
although there are still vertical pores in the woody part of the straw, the main water absorption would 98
come from the pithy part of what would be the inside of the straw. The binder that was used was Vicat 99
prompt natural cement which is mined from a seam of argillaceous limestone in Grenobles, France. 100
Finally, the VMA was a polyacrylic acid and was produced by Larsen Building Products in Belfast, 101 Northern Ireland. 102 103 104 105 106 107 108 109 110 111 112
Figure 2.1 – Photograph and X-Ray tomography image of aggregates used in this investigation, 113
hemp shiv (left) and rapeseed straw (right) 114
115
Mixing, Casting and Curing Procedure
116
The mechanical properties of the mix were investigated, and the properties chosen were the 117
compressive strength and elastic modulus. The compressive strength of the samples was determined 118
using 50 mm cubes and an accurately calibrated static materials testing machine with a 100 kN load 119
cell. 120
All of the samples in this investigation used the same aggregate:binder:water ratio, which was 121
1:2:3 by mass and resulted in a dry mix. This composition was chosen as it is the “wall” formulation in 122
the professional regulations given by SEBTP [24], which published guidelines (in French. The samples 123
were all cast using the same procedure, which was to add the aggregate and 65% of the mixing water 124
to the mixing bowl first and mix for 2 minutes and 30 seconds. The binder was then added and mixed 125
for a further 30 seconds before the remaining 35% of the mixing water and the chemical admixture (if 126
one was used) was added. The amount of VMA added to the mixture was dictated by the amount of 127
water as the ratio of water to VMA was 10:1 by mass. Mixing was conducted for a further 2 minutes 128
to achieve homogeneity with a total mixing time of 5 minutes. The composition by mass of the mixes 129
used in this investigation can be found in Table 2.1. 130
131 132 133
Table 2.1 – Mixture composition of all mixes in this investigation by mass (%) 134
Hemp Rapeseed Vicat VMA Water
Hemp Untreated 17 - 33 - 50 Hemp VMA 16 - 32 5 47 Rapeseed Untreated - 16 33 - 50 Rapeseed VMA - 16 32 5 47 135
Experimental Procedure
136Compressive Strength
137Three 50 mm³ samples were again used for the purpose of repeatability and the method used 138
was as follows: 139
140
1. Weigh the sample and measure the height, width and thickness to be able to calculate the density. 141
2. Position the sample in the Zwick machine and lower the crosshead until the compression pad is in 142
contact with the top surface of the sample. 143
3. The loading rate was set to 0.6 N/s and the samples were tested up to 20% strain. The compressive 144
strength of the sample was also noted at 5% strain for the purposes of serviceability limits. 145
146
Immersion Weathering Testing
147
Cycle Lengths
148
In order to evaluate the immersion weathering resistance of hemp and rapeseed straw 149
concrete a test was devised to investigate this property in the long term. The proposed method was 150
an accelerated immersion weathering process which involved submerging the 100 mm cube samples 151
in water to fully saturate them, then to desaturate them and dry them completely. These two 152
processes formed a single cycle and these cycles were repeated numerous times in order to 153
investigate long term durability. It was understood that, given the application of this mix design as a 154
wall panel, this test could be considered extreme, and would only be observed in reality during cases 155
of flooding. However, flooding is an intermittent concern in the U.K. and so it was decided that the 156
most extreme case would be investigated. 157
Initially the saturation and desaturation times had to be established in order to form the cycle 158
lengths. To do this the samples were submerged in water and each day were weighed after being 159
placed on a steel grid for 30 mins to allow any free water to escape. If the mass of the sample was 160
within 0.1% of the previous days mass, then full saturation was assumed to have been reached and 161
the previous day was taken to be the length of that wetting cycle. Similarly, for drying, the samples 162
were placed in an oven at 50°C and were weighed daily until desaturation had been reached and the 163
length of the cycle found. This was carried out for each of the four mixes (untreated hemp, hemp 164
VMA, untreated rapeseed, rapeseed VMA), all using the Vicat binder. The cycle lengths were found to 165
be 11 days for both hemp and rapeseed untreated (5 days wetting and 6 days drying) and 13 days for 166
hemp and rapeseed VMA (7 days wetting and 6 days drying). It was decided that the test would be a 167
long-term test; 20 cycles were conducted meaning a total test time of 220 days for untreated samples 168
and 260 days for VMA samples. 169
170
Immersion Weathering Test
171
Large plastic boxes were used and filled with water to submerge the samples (Figure 3.1) and 172
the cycles were conducted in laboratory conditions according to the description given in section 3.2.1. 173 174 175 176 177 178 179 180 181
Figure 3.1 – Rapeseed VMA samples during an immersion weathering test 182
183
After each cycle had been completed the samples were weighed and measured for height, 184
width and depth using digital callipers. The width and depth measurements were then plotted and 185
analysed for sample swelling and shrinkage. This was done after the samples had been removed from 186
the oven as well as removed from the water in order to measure any effect of the 187
saturation/desaturation cycles, in particular swelling. Any changes in amount of water absorbed were 188
also noted by observing the differences in mass of the samples. In order to investigate the effect that 189
the submersion had caused after 5, 10, 15 and 20 cycles, samples were removed for compressive 190
strength testing as well as Fourier-transfer infrared spectroscopy (FTIR) on the fibres. 191
192
Outdoor samples
193
The final phase of the weathering testing was to assess the effect, if any, of leaving samples 194
outdoors to naturally weather for a year. Four samples of the same four mixes were left in an outdoor 195
exposed environment for a year and then subsequently tested. Over the course of the year the 196
samples were exposed to all kinds of weather systems including heavy rain, snow and heat and the 197
average weather statistics for Northern Ireland from the Met Office can be seen in Table 3.1. 198
199
Table 3.1 – Weather statistics for Northern Ireland during the outdoor testing [25] 200 Oct-17 Nov-17 Dec-17 Jan-18 Feb-18 Mar -18 Apr-18 May-18 Jun-18 Jul-18 Aug-18 Sep-18 Mean Temp (°C) 10.8 5.8 4.7 3.9 2.9 3.9 7.9 11.8 14.9 15.8 14.4 11.5 Rainfall (mm) 105.7 112.8 116.1 170.9 74 85.8 80.9 58.3 49.1 80.6 102 57 Raindays ≥ 1 mm 16.5 19.1 18.1 22.1 14.1 14.4 16.1 9.9 6.9 9.7 18.7 13.7 Days of Air Frost 0.3 3.4 9 8.3 13.3 11 3.8 0.6 0 0 0 0.4 201
The outdoor samples were placed, unfixed, on a simple platform adapted from a wooden 202
pallet, and partially protected from factors such as high winds using a polymer-based mesh (Figure 203
3.2). Holes were cut into the mesh around the samples to allow for maximum exposure to solid or 204
semi-solid systems such as snow. It should be noted that in a real-world application the material would 205
be fully exposed to the things such as wind, which the polymer mesh partially protected against. 206
However, this protection was only devised as a restraint, not a fixing, as the material was light enough 207
to be blown off the platform during the year of testing had the restraint not been there. The cutting 208
of the mesh was assumed to expose the material to any possible abrasion that would have been 209
caused by the wind. The pallet was then lifted on to a shipping container outside the rear door of the 210
laboratory to gain maximum exposure to the elements and also to avoid unwitting interference for 211
the duration of the year. 212 213 214 215 216 217 218 219 220
Figure 3.2 – Outdoor samples prior to testing 221
222
In order to evaluate the effect of the weathering conditions in Northern Ireland on the 223
samples they were tested for compressive strength as well as microstructure. The microstructure of 224
the samples was analysed using scanning electron microscopy (SEM) and finally the fibres themselves 225
were investigated using FTIR. 226
227
Scanning Electron Microscopy
228
In order to prepare the samples for SEM, they were first cut down to an appropriate size of 229
around 50 mm x 50 mm x 50 mm using the mini saw and then fully impregnated with resin. Then the 230
samples were allowed to cure for 48 hours before being polished with isopropanol and a 3 mm 231
diamond polisher followed by a 1-micron diamond polisher. This was done to produce an extremely 232
smooth surface to allow for clear and precise imaging under the electron microscope. The samples 233
were then investigated under an FEI Quanta Scanning Electron Microscope. 234
235
Fourier-transform infrared spectroscopy (FTIR)
236
FTIR was used in conjunction with attenuated total reflectance (ATR) in order to analyse and 237
quantify the constituent parts of the bio-aggregates before and after the experiments were 238
conducted. The analysis was completed using a Jasco FT/IR-4100 FTIR machine (Figure 3.3) and was 239
done by studying the vibratory sequences of the samples. The range of vibrations analysed was 650 – 240
4000 cm-1 using a 4 cm-1 scan resolution.
241 242 243 244 245 246
Figure 3.3 – Jasco FT/IR-4100 machine 247
248
Results and Discussion
249
Immersion Weathering
250
This section investigates the impact of the aggregate types and the addition of VMA and 251
compares the effects of the tests on the compressive strength of the bio-concretes and chemical 252
composition of the bio-aggregate. The swelling and the mass of the concrete samples were also 253
recorded after every cycle of immersion weathering and the impacts of the above-mentioned 254
variables on these parameters are discussed. 255
30 40 50 60 70 80 90 100 110 120 0 5 10 15 20 Pe rc en ta ge o f O rig in al M as s (W et Cy cl e O nl y) (% ) Cycle Number RU HU RV HV
Mass gain
257The immersion weathering test was conducted over a period of 9 months (depending on the 258
cycle lengths discussed in section 3.2.1). The changes in mass were recorded as the tests progressed 259
and the comparative results for the aggregate types are presented in Figure 4.1. It should be noted 260
that the mixes are denoted as follows: RU = rapeseed untreated, HU = hemp untreated, RV = rapeseed 261
VMA and HV = hemp VMA. 262
As can be seen for both cases (untreated and with the VMA additive) the results are very close. 263
As a percentage of the original mass recorded at the start of the test the hemp samples initially 264
seemed to gain the most mass however towards the end of the test the rapeseed samples began to 265
absorb similar amounts of water and indeed for the untreated samples gained more mass consistently 266
from roughly cycle 12 onwards. This can be explained using the scanning electron microscopy images 267
that were taken of the samples after the test had concluded at 20 cycles (Figure 4.2). 268 269 270 271 272 273 274 275 276 277 278 279
Figure 4.1 – The effect of aggregate type on mass change per cycle over time with 280
regards to immersion weathering 281
282
Figure 4.2 illustrates the differences in the microstructure of the two concrete types (hemp 283
untreated and rapeseed untreated). It can be seen that considerable damage has been caused to the 284
microstructure and a lot of the binder has been washed away in both cases, however this effect is 285
more severe for the rapeseed samples. At this stage the reason for this is unknown, and is something 286
that should be studied further. However, it could be because of the fact that the rapeseed aggregate 287
was smaller and more elongated when compared to the hemp aggregate [23]. The more elongated 288
the aggregate, the more likely it is that the particles will be cast in a perpendicular orientation to the 289
casting direction, creating anisotropy. If the aggregate is more circular (as the hemp was [23]), then 290
all of the particles are less likely to be cast in a uniform direction. And if the particles are all orientated 291
in different directions, then the matrix and the pore orientation would be messier and it would be 292
much more difficult to extract the binder particles from the matrix. 293 294 295 296 297 298 299 300 301 302 303
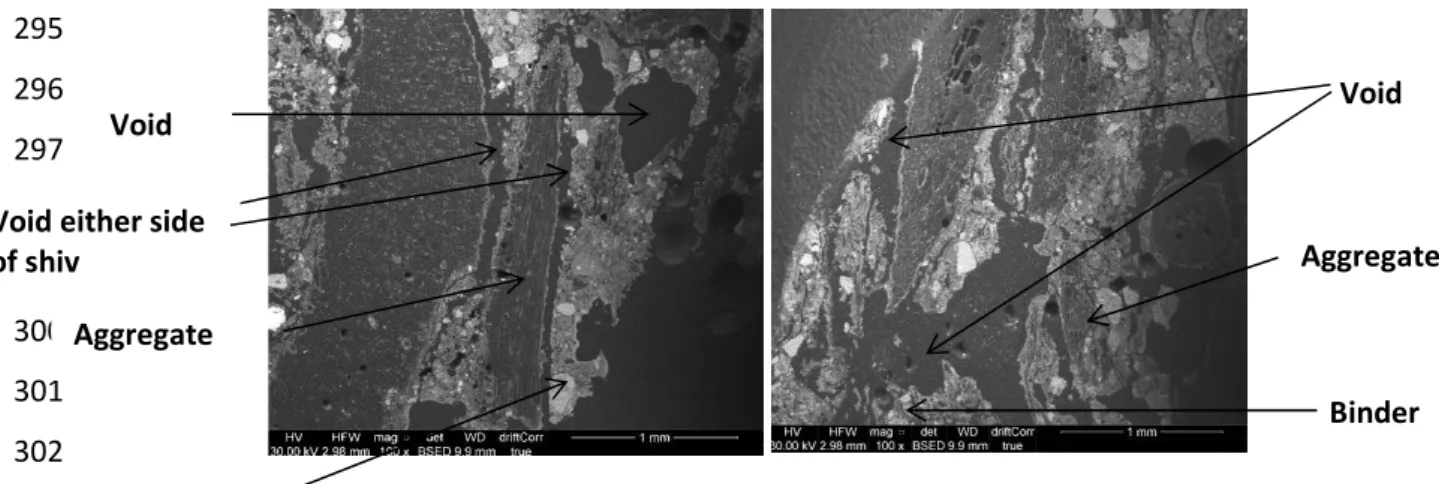
Figure 4.2 – SEM images of untreated hemp (left) and untreated rapeseed (right) samples 304
after the immersion weathering test had concluded 305
306
Figure 4.2 has been annotated to illustrate the different components that were studied. It can 307
be seen that the untreated hemp mix shows clear signs of damage with a large void in between the 308
two shiv particles and another considerable void along the other side of the smaller piece of hemp. 309
There are also voids exhibited within the mineral binder matrix in the image yet this loss of binder is 310
nowhere near as severe as in the rapeseed image. 311
In Figure 4.2 (rapeseed) there is again a large amount of evidence of voids appearing near the 312
aggregate; weakening the interfacial transition zone (ITZ). In addition to this a large amount of binder 313
appears to have been washed away in the bottom left corner of the image. 314
The evidence of these voids explains the larger relative rise in mass gained of the rapeseed 315
samples compared to the hemp samples. As the pores in the concrete matrix are widened due to 316
cracking or binder being washed away, the porosity increased which allowed more space to be filled 317
by water during the immersion weathering test. 318
The effect of the VMA on both of the aggregate types was also compared, comparing each 319
aggregate type both with and without the VMA. For both aggregate types it is clear that the use of a 320
VMA reduced the amount of mass gained. This is due to the VMA greatly increasing the density of 321
vegetal concretes and so reducing the porosity, as was reported by Sheridan et al. [23]. This reduction 322
in porosity would mean that there would be a reduced area of voids to be filled with water during the 323
saturation part of the immersion cycle (and so less water absorption. This reduction in water 324 Binder Void Aggregate Binder Aggregate Void Void either side
absorption is reflected in the mass gained data (Figure 4.1) as the mass of the VMA samples is 325
consistently lower than the untreated samples. However, it should be noted that in both cases the 326
VMA samples gained weight at a much faster rate than the untreated samples as the test progressed. 327
A conclusion that could be drawn is that the VMA samples are more susceptible to the pore widening 328
effect discussed in the previous paragraphs (binder washing away and void propagation), although the 329
precise reason for this is unclear and is something that should be studied further. This is supported by 330
the SEM imaging that was conducted on the samples. Figure 4.3 shows a comparison of all the mixes 331
after the immersion weathering testing had concluded with all of the 28-day control samples of the 332 mixes. 333 334 335 336 337 338 339 340 341 342 343 344 345 346 347 348
Figure 4.3 – SEM imaging of 28-day control samples (top line) and mixes after 20 cycles of the 349
immersion weathering test (bottom line) 350
351
Figure 4.3 illustrates that despite the fact that the untreated samples were heavily affected 352
by the immersion weathering test with clear evidence of loss of binder or “inorganic leaching”, crack 353
propagation and pore widening the VMA samples are affected more severely (voids denoted with 354
white arrows). This effect is probably observed because the initial strengthening and improvement in 355
the vegetal concrete’s ITZ [26] makes severe loss and damage possible. In the untreated sample the 356
ITZ is already of low quality and high porosity is observed (Figure 4.3), and the scope for further 357
damage is limited. However, sample failure is a more considerable threat and indeed was observed 358
-3 -2.5 -2 -1.5 -1 -0.5 0 0.5 1 0 5 10 15 20 Pe rc en ta ge o f O rg in al C ro ss -Se ct io n (% ) Cycle Number RU HU RV HV
towards the end of the experiment in some of the untreated samples (discussed in the next section). 359
Conversely the structure of the VMA samples by the end of the experiment was still sound, and is 360
analogous to the VMA samples degrading throughout the experiment to a similar state to that in which 361
the untreated samples started. That is to say the addition of the VMA reduced the porosity of the 362
material but also gave scope for degradation; throughout the VMA immersion weathering tests the 363
porosity of the samples slowly increased and returned to almost the initial levels of the untreated 364
samples. This is reflected in the mass gain results as initially the VMA samples absorbed much less 365
water than the untreated samples. However, during the duration of the experiment the amount of 366
water absorbed rises until the VMA samples are absorbing almost as much water as the untreated 367
samples. On the other hand, the amount of water the untreated samples absorb did not change as 368
much; absorbing lots at the beginning of the experiment and also lots at the end. 369
370
Sample swelling
371
In addition to noting the mass of each sample before every wetting and drying cycle, the 372
volume was measured. Presented are the results of the changes in cross-sectional area of the samples 373
as the test progressed. It should be noted the results in the z axis are not presented as the top of the 374
sample was not flat and it was the exposed face during casting. This made the height an unreliable 375
measurement as it varied slightly across the sample. Thus, the swelling was considered for the flat-376
edged cross-sectional area only. 377 378 379 380 381 382 383 384 385 386
Figure 4.4 – Effect of VMA and aggregate type on cross-sectional swelling of concrete samples 387
388
Figure 4.4 shows the cross-sectional changes due to immersion weathering over time. The 389
first thing to notice is that overall all the sample mixes lost area. Even if the changes were only small 390
(in the range of 0.25 – 2.5% which is equal to 25 – 250 mm²) for a 100 mm cube, when scaled up to a 391
real-life application of a house, a problem could arise. It is conceivable that an element of any of the 392
-0.2 0.3 0.8 1.3 1.8 0 5 10 15 20 Co m pr es si ve S tr en gt h (M Pa ) Number of Cycles RU HU RV HV
studied samples could be fixed or glued between two other elements and shrinking like this could 393
cause the build-up of internal stresses as the element shrinks and tries to pull away from its fixings. 394
This potential concern would be more considerable for the VMA samples compared to the untreated 395
samples, as the VMA samples’ area reduced more. Although it should be kept in mind that this 2.5% 396
loss of area was the end product of an extreme test over a long period of time with a high severity, 397
therefore the seriousness of this concern could potentially be studied further and adjusted 398
accordingly. 399
It can be seen that differences between the two aggregate types was relatively small, but the 400
rapeseed samples shrank less than the hemp samples in both the untreated and VMA mixes. Finally, 401
it can be seen that towards the end of the test the untreated samples started to become extremely 402
soft, which impacted the swelling measurements. From cycle 16 onwards the defined structure of 403
swelling during the wetting stage and shrinkage during the drying stage was lost, or at least was much 404
less defined. In contrast the swelling and contraction remained throughout the end of the test for the 405
VMA samples, also partially illustrating their partial resistance to immersion weathering. 406
407
Compressive strength degradation
408
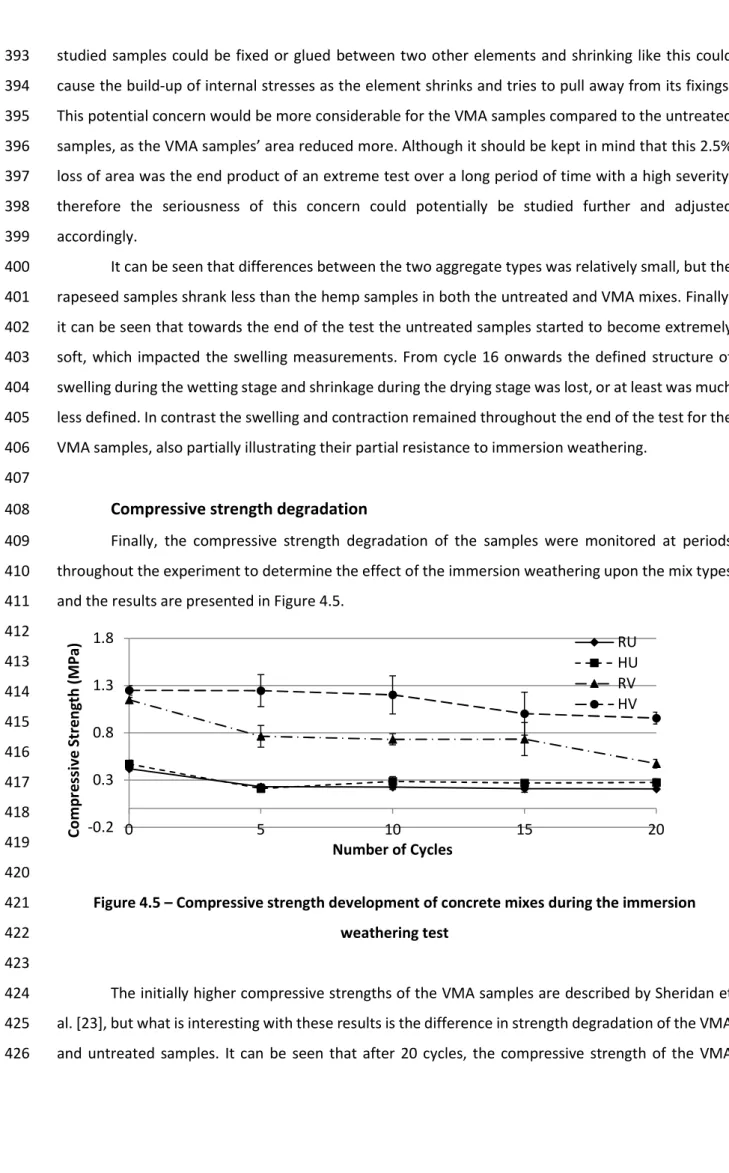
Finally, the compressive strength degradation of the samples were monitored at periods 409
throughout the experiment to determine the effect of the immersion weathering upon the mix types 410
and the results are presented in Figure 4.5. 411 412 413 414 415 416 417 418 419 420
Figure 4.5 – Compressive strength development of concrete mixes during the immersion 421
weathering test 422
423
The initially higher compressive strengths of the VMA samples are described by Sheridan et 424
al. [23], but what is interesting with these results is the difference in strength degradation of the VMA 425
and untreated samples. It can be seen that after 20 cycles, the compressive strength of the VMA 426
samples is significantly reduced compared to the untreated samples. This is reflective of the mass gain 427
results discussed in section 4.1.1 where the increase in mass gain of the untreated samples did not 428
significantly increase, however for the VMA samples the mass gain progressively increased throughout 429
the test. This is due to the weakening of the ITZ, propagation of cracks in the microstructure and 430
increase in the material porosity. 431
The SEM images presented in Figure 4.3 in the previous section lead to the same explanation 432
of the compressive strength degradation as the mass gain results. The washing away effect of the 433
samples and the pore widening was a phenomenon that more severely affected the VMA samples 434
because the ITZ of those samples had been improved so dramatically to start with. This meant that 435
there was a much higher scope for damage (not including sample failure) and this is reflected in the 436
compressive strength degradation results. It was observed that the VMA samples lost a larger amount 437
of compressive strength both as a raw number and as a percentage in comparison with the untreated 438
samples, yet ended up with a higher compressive strength (and better quality microstructure overall). 439
The standard deviation of the results is similar between all of the mixes; however, the results 440
appear to be much more variable for the VMA samples. In reality, this is not the case, as the 441
compressive strengths are also much higher when compared with the untreated samples. Hence, as a 442
percentage the standard deviations are similar. 443
444
Outdoor weathering
445
In addition to the indoor simulation of weathering, samples were also left outside in natural 446
conditions for a year and exposed to natural weathering. As stated in section 3.2 the testing was 447
conducted in Belfast, Northern Ireland and the weather conditions for the year are presented in Table 448
3.1. The statistics presented are from the Met Office, the UK’s national meteorological service, and is 449
available freely online. 450
An important heading in Table 3.1 is the raindays category. This category records on average 451
how many days of rainfall over 1 mm the weather stations around Belfast experienced. That is an 452
important distinction from average rainfall because the two do not necessarily linearly correlate. It 453
could be the case that in a given month every day could be considered a rainday, however only around 454
1 mm of rain falls per day, resulting in a total average rainfall for that month of 30 or 31 mm depending 455
on the month. This would be considered very low for Northern Ireland. It is therefore a slightly more 456
sophisticated view of the rainfall over a given month when viewed in conjunction with the average 457
rainfall as it describes the concentration of rain over how many days in a given month. For example, if 458
there is a high amount of rainfall but over only a few raindays the rain could be considered torrential 459
0 0.5 1 1.5 2 2.5 RU HU RV HV Co m pr es si ve S tr en gt h (M pa ) 28 Days Outdoor
while it is happening and thus potentially affect the exposed concrete samples differently to a lesser 460
but more constant amount of rainfall. 461
After the year of exposure, the samples were dried according to the relevant drying step cycle 462
length from the indoor weathering test and then were tested for compressive strength to see if the 463
outdoor weathering had had any effect. The average compressive strength results are presented in 464
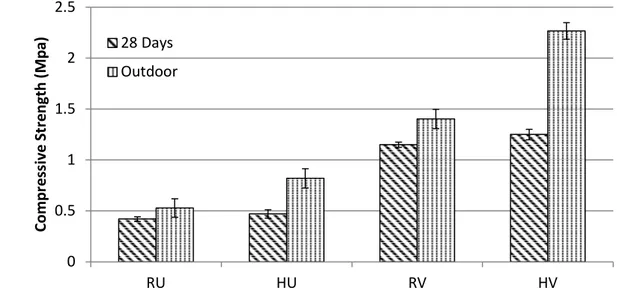
Figure 4.6 against the control results after 28 days. 465 466 467 468 469 470 471 472 473 474 475 476
Figure 4.6 – Strength results from the outdoor weathering samples against the 477
28-day control sample results 478
479
As can be seen, the effect of the outdoor weathering did not degrade or indeed even inhibit 480
the development of the compressive strength of the samples after a full year of exposure. This was 481
probably due to the fact that over the year the samples could also have been carbonating; something 482
that is being experimentally determined currently. 483 484
4.3. Leaching
485Introduction
486Leaching was studied in both the inorganic and organic phases. Results presented in section 487
4.1 lead to suspicions that cracks were propagating in the ITZ during the immersion weathering tests. 488
These cracks occurred for different reasons but the main one was a “washing away” effect. 489
Consequently, testing was conducted to conclude if this was the case. Because the bio-aggregates 490
were made up of organic materials, some of them soluble, an experiment to investigate the organic 491
leaching was also appropriate. The results of these experiments are presented in the following section. 492
0 0.04 0.08 0.12 0.16 0.2 0.24 Rapeseed Hemp Co nc en tr at io n of C al ci um in th e W at er (% ) Untreated VMA
Inorganic leaching
494Atomic absorption was used to identify calcium particles in the test water of the controlled 495
immersion test. The results of this test are presented in Figure 4.7. 496 497 498 499 500 501 502 503 504 505 506
Figure 4.7 – Inorganic leaching of vegetal concretes 507
508
For reference the concentration of calcium in the tap water in south Belfast was reported as 509
0.00438 % by Northern Ireland Water in 2018 [27]. Bearing in mind d that this test was conducted on 510
water that had been subjected to immersing samples for only 5 cycles; a much shorter test than the 511
immersion weathering tests earlier in this investigation, it can be seen that there is clear evidence of 512
mineral leaching. It can also be seen that the hemp samples suffered slightly greater mineral leaching 513
than the rapeseed samples (42.5 times the amount of calcium found in Northern Irish water). In 514
addition, it can be clearly seen that the addition of a VMA into the mix greatly reduced mineral 515 leaching. 516 517
Organic leaching
518Organic leaching was identified using FTIR which was conducted on samples of bio-aggregate 519
removed from the crushed cubes after the compressive strength testing. Identifying all of the peaks 520
on the spectra was a complicated process and the wavenumber values used to identify the peaks are 521
tabulated below in Table 4.1 for simplicity, and the FTIR spectra are presented in Figure 4.7. The three 522
28-day control samples are denoted in Figure 4.8 as CTRL 1, CTRL 2 and CTRL 3 and the samples that 523
were tested after 20 cycles in the immersion weathering test are denoted as WHU 1, WHU 2 and WHU 524
3. Again, for simplicity, the legend presented for the rapeseed untreated mix is the same for all other 525
mixes. 526
Table 4.1 – Description of main infrared absorption peaks for bio-aggregates 528
Wavenumber (cm-1)
Bonding Vibration Type Material Reference 3000 – 3600 O–H Symmetric and
antisymmetric stretching Polysaccharides [28] 2850 – 2920 C–H (CH₂) Antisymmetric stretching Waxes, Lipids and Fats [29], [30] 1630 – 1650 C=O Symmetric stretching Pectin [28] 1505 – 1510 C=C Symmetric stretching Lignin [28], [29] 1425 CO32+ Antisymmetric stretching Calcite [31] 1160 C–O–C Antisymmetric stretching Cellulose, hemicelluloses [28] 1030 C–O Symmetric stretching Cellulose,
hemicelluloses
[32] 875 CO32+ Symmetric bending Calcite
(Carbonate)
[31] 529
The first observation to notice in Figure 4.8 is that in all cases the peak from 3000 – 3600 cm
-530
1 in the weathered samples (denoted in black) has flattened out and is not as sharp as for the 28-day
531
control samples (denoted in grey). This shows that during the immersion weathering testing the 532
polysaccharides in the hemp and rapeseed aggregates were partially dissolved. In theory this makes 533
sense as sugars are soluble, however this was not definitely expected. 534
Calcite peaks are also evidenced on the spectra at 875 and 1425 cm-1 and for all of the mixes
535
are taller for the weathered samples in comparison with the control samples. This is to be expected 536
as the weathered samples would have had around 9 months to carbonate naturally. 537
The hemicellulose and cellulose peaks at 1030 and 1160 cm-1 are interesting for all of the
538
mixes aside from the hemp VMA mix. The peaks for the weathered hemp VMA mix have almost 539
completely disappeared as expected because hemicellulose is a soluble sugar. However, for the other 540
mixes the 1030 cm-1 peak consistently gets bigger and the 1160 cm-1 gets smaller. This can be simply
541
explained because the peaks in both cases represent both cellulose and hemicellulose; hemicellulose 542
is soluble however cellulose is insoluble. Thus, the peculiar change in peak shape was due to the 543
change in quantity of the two materials before and after testing. It is believed that the removal of the 544
hemicellulose caused the reduction in the peak and the minor increase in the 1030 cm-1 peak was due
545
to the resulting increased concentration of cellulose. 546
Changes in lignin quantity are relatively hard to observe for the mixes because the lignin peak 547
is so close to the large and asymmetric calcite peak. However, for all mixes it is still possible when 548
comparing the control spectra to the weathered spectra. In all cases aside from the third control 549
sample (CTRL 3) for the rapeseed untreated mix a shoulder is observed around 1505 cm-1, which is the
550
lignin peak. When looking at the weathered spectra the shoulder has disappeared. In some cases it is 551
harder to see because the calcite peak is asymmetric [31]. However, the shape of the peak is clearly 552
different when comparing the samples before and after the test. Thus, it can be concluded for all mixes 553
that immersion weathering also results in the dissolution of lignin. 554
The next peak along the spectra is the pectin peak at 1630 – 1650 cm-1. The changes in this
555
peak can be described as inconsistent, especially for the rapeseed aggregate. The peak was 556
consistently lowered for both of the hemp samples; however, it was not completely removed for 557
either. This is a positive result for the hemp mixes as pectin was the sugar that was identified as a 558
problematic constituent part due to its tendency of trapping calcium ions from the binder and 559
retarding long-term strength [21], [22]. Hence the removal of the pectin theoretically means better 560
long-term strength development. The results for the rapeseed samples are less consistent, with 561
evidence of a diminished pectin peak in some weathered samples, and no observed effect in others. 562
One explanation for this could be (as with the waxes in the next paragraph) that pectins are 563
predominantly found in the epidermis of the plant cell [33], so there does seem to be evidence of 564
pectin dissolution in the rapeseed sample results however the inconsistency is brought about by the 565
fact that the sugar is not omnipresent throughout the samples as a whole. 566
The last peak to be studied is the peak from 2850 – 2920 cm-1, which is representative of any
567
waxes, lipids and fats in the aggregate. This was the second discrepancy between the two aggregates 568
because the waxes and fats are dissolved once again in both of the hemp samples. In contrast, again 569
no effect was noted when looking at the rapeseed samples. It should be noted that the waxes and fats 570
peak on the hemp samples is only minor and is not consistently present. This, as with pectin, may 571
suggest an explanation as to why they are seemingly removed. It may be the case that they simply 572
were not present in the weathered samples as the waxes, lipids and fats are only found in the 573
epidermis of the straw anyway, whereas the other constituent parts are omnipresent throughout the 574
stem. The peaks are more clearly present for the rapeseed samples however; their lack of dissolution 575
could again be explained by their rarity in the cross-section of the stem. Alternatively, it could be the 576
case that the immersion weathering test had no effect in dissolving them. 577
calcite 500 750 1000 1250 1500 1750 2000 2250 2500 2750 3000 3250 3500 3750 4000
RU
CTRL28 1 CTRL28 2 CTRL28 3 WHU1 WHU2 WHU3 500 750 1000 1250 1500 1750 2000 2250 2500 2750 3000 3250 3500 3750 4000HV
500 750 1000 1250 1500 1750 2000 2250 2500 2750 3000 3250 3500 3750 4000RV
578 579 580 581 582 583 584 585 586 587 588 589 590 591 592 593 594 595 596 597 598Figure 4.8 – FTIR data for all mixes before and after the immersion weathering test 599
Hemicellulose/cellulose lignin
There are similar FTIR studies conducted on surface treatments of lignocellulosic aggregates 600
that demonstrate the effects of alkaline substances on the dissolution or removal of certain organic 601
constituent elements of the aggregates. Nozahic and Amziane and Chabannes et al. [34], [35] both 602
found that treating lignocellulosic aggregates with lime water (aqueous calcium hydroxide) resulted 603
in the removal of hemicelluloses, lignins, polysaccharides and to a certain extent, pectins, as did this 604
study. However, these studies were conducted with a purposeful treatment of the aggregates with an 605
alkaline solution; this study was with water only. 606
These results could have an impact on the real-world application of vegetal concretes, 607
especially exposed vegetal concretes as these sugars are known to inhibit strength development. Thus, 608
the removal of sugars with water can only be considered as a significant improvement for the 609
development of their long-term strength. However, caution must be taken with these results, as it 610
may be the case that it was a basic solution removing these organics due to the fact that, as has been 611
demonstrated in section 4.2.2, calcium was leaching into the test water as the experiment progressed. 612
This slow leaching of calcium could have increased the pH of the test water and been responsible for 613
the observed results, creating a similar test to the ones conducted by Nozahic and Amziane and 614
Chabannes et al. [34], [35]. 615
616
Outdoor organic leaching
617
To determine if the dissolution and removal of the organics for the full immersion test was a 618
consequence of the test water only or the test water and the added calcium from the inorganic 619
leaching, FTIR was conducted on the samples that were weathered under natural conditions outside. 620
Again, as with the immersion weathering FTIR results the control samples tested at 28 days are 621
denoted in grey and the weathered samples are denoted in black. For simplicity the legend presented 622
in the hemp VMA spectra is the same legend as was used for the rest of the mixes. 623
500 750 1000 1250 1500 1750 2000 2250 2500 2750 3000 3250 3500 3750 4000
HU
500 750 1000 1250 1500 1750 2000 2250 2500 2750 3000 3250 3500 3750 4000RU
500 750 1000 1250 1500 1750 2000 2250 2500 2750 3000 3250 3500 3750 4000HV
CTRL28 1 CTRL28 2 CTRL28 3 OUT1 OUT2 OUT3 500 750 1000 1250 1500 1750 2000 2250 2500 2750 3000 3250 3500 3750 4000RV
624 625 626 627 628 629 630 631 632 633 634 635 636 637 638 639 640 641 642 643 644Figure 4.9 – FTIR data for all outdoor mixes 645
22 The outdoor weathering samples follow much the same trends as found in the indoor 646
immersion weathering FTIR results and the literature [34], [35]; in all cases the naturally weathered 647
samples exhibit a partial removal of polysaccharides (3000 – 3600 cm-1, dissolution of hemicelluloses
648
and re-concentration of the insoluble cellulose (1030 and 1160 cm-1), the dissolution of lignin (around
649
1505 cm-1), the partial and inconsistent removal of pectin (1630 – 1650 cm-1) and waxes, fats and lipids
650
(1850 – 2920 cm-1).
651
The results are actually remarkably similar to those of the immersion weathering test; 652
implying that only a wet climate is needed to effect these changes and not an extreme test of full 653
immersion over the course of 9 months. This confirms the positive conclusion made in the previous 654
section that water only is needed to remove sugars in these bio-aggregates which, in the case of 655
pectin, is positive for vegetal concretes. 656
657
Conclusions
658
Overall, it can be concluded that hemp concretes are slightly more durable regarding 659
immersion weathering compared to rapeseed concretes. This was because over time and with 660
increased exposure to the immersion weathering it was observed that the rapeseed samples suffered 661
more damage to the binder matrix and so absorbed more mass by water. Although, both concrete 662
types can be described as being highly susceptible and both lost compressive strength as the 663
experiment progressed. Finally, the addition of a VMA increases the durability of both concrete types 664
regarding long term immersion weathering. Although again, with time the resistance of VMA 665
concretes to immersion weathering begins to break down. 666
Outdoor weathering was also conducted and no effect was imparted on the samples, indeed 667
the compressive strength increased. This was probably because the samples would have been 668
carbonating naturally in the outdoor environment (although this was not investigated and so at this 669
point is a hypothesis only), providing an increase in strength and the ability to overcome the negative 670
effect on compressive strength imparted by the weathering. 671
Clear evidence of both organic and inorganic leaching in vegetal concretes was observed. Even 672
over a condensed test compared to the immersion weathering test, large amounts of calcium were 673
found in the testing water after 5 weathering samples. The highest concentration was found in the 674
untreated hemp samples, the water of which averaged 0.186%, 42.5 times the calcium content of 675
water in South Belfast, Northern Ireland [27]. 676
Comparison between mixes with respect to inorganic leaching resulted in hemp inorganically 677
leaching more than the rapeseed samples for both the untreated and VMA samples, but this 678
difference was considered negligible. What was noticeable, however, was the effect of adding a VMA 679
23 into the mix, which greatly reduced the amount of inorganic leaching. This is a positive effect, as its 680
ability to restrict the leaching of calcium during immersion weathering could result in an overall 681
increase in long term strength development. 682
Organic leaching gave a strong indication that most of the soluble constituent parts in 683
lignocellulosic materials did indeed dissolve. FTIR results revealed that polysaccharides partially 684
dissolved for all hemp and rapeseed mixes, so too did hemicelluloses and lignin. Pectin also dissolved, 685
although not fully, and as this peak was identified as a retarding agent on the setting of cementitious 686
materials, future work is needed to identify a process to remove this material completely. 687
It was also observed that the results for pectin and lipids, fats and waxes were inconsistent 688
for all mixes, however this was due to the fact that these organics are not omnipresent throughout 689
the aggregates as a whole. Their presence was solely due to where the FTIR was conducted on the 690
aggregate sample. If the technique was conducted on the epidermis of an aggregate particle, evidence 691
was found of their dissolution; however, if the test was conducted anywhere else there was much less 692
evidence of their presence due to the reduced concentration of pectin in other parts of the stem. 693
694
Acknowledgements
695
The authors would like to acknowledge Vicat for supplying the binder in this investigation and 696
Larsen Building Products for supplying the VMA admixture. 697
698
References
699
[1] E. Fehling, M. Schmidt, and S. Sturwald, “Ultra High Performance Concrete (UHPC),” in Second 700
International Symposium on Ultra High Performance Concrete, 2008, p. 136. 701
[2] The Cement Sustainability Initiative, “The Cement Sustainability Initiative: 10 years of progress 702
- moving on to the next decade,” p. 32, 2012. 703
[3] V. M. Malhotra, “Sustainability and Concrete Technology,” 2004. 704
[4] J. Davidovits, “Global Warming Impact on the Cement and Aggregates Industries,” World 705
Resource Review, vol. 6, no. 2, pp. 263–278, 1994. 706
[5] International Energy Agency, “Cement: Tracking Clean Energy Progress,” 2018. [Online]. 707
Available: https://www.iea.org/tcep/industry/cement/. [Accessed: 11-Jan-2019]. 708
[6] Eurostat, “Energy statistics - an overview,” 2018. [Online]. Available: 709
https://ec.europa.eu/eurostat/statistics-explained/index.php?title=Energy_statistics_-710
_an_overview#Final_energy_consumption. [Accessed: 11-Jan-2019]. 711
[7] J. (DECC) Palmer and I. (DECC) Cooper, “Housing Energy Fact File,” Department of Energy & 712
Climate Change, p. 171, 2013. 713
24 [8] S. Marceau, P. Glé, M. Gueguen, E. Gourlay, S. Moscardelli, I. Nour, S. Amziane, and L. 714
Abdellaoui, “Assessment of the durability of bio-based insulating materials,” in First 715
International Conference on Bio-based Building Materials, 2015, pp. 198–202. 716
[9] P. Hellebois, S. Marceau, M. Gueguen, and S. Amziane, “Influence of wetting and drying cycles 717
on the properties of hemp concrete,” in 1st International RILEM Conference on Rheology and 718
Processing of Construction Materials, 2013. 719
[10] A. Grelat, “Using sustainable materials as walling for individual housing with wood structure - 720
Final report extracts Volume 2 – Laboratory experiments Site instrumentation,” 2004. 721
[11] G. Delannoy, S. Marceau, P. Glé, E. Gourlay, M. Gueguen-Minerbe, S. Amziane, and F. Farcas, 722
“Evolution of Hemp Concrete Properties Exposed to Different Types of Environments,” in 723
Synercrete’ 18 International Comnference on Interdisciplinary Approaches for Cement-based 724
Materials and Structural Concrete, 2018, pp. 505–510. 725
[12] M. Chabannes, E. Garcia-Diaz, L. Clerc, and J. C. Bénézet, “Studying the hardening and 726
mechanical performances of rice husk and hemp-based building materials cured under natural 727
and accelerated carbonation,” Construction and Building Materials, vol. 94, pp. 105–115, 2015. 728
[13] C. Sentenac, M. Sonebi, and S. Amziane, “Investigation on the Performance and Durability of 729
Treated hemp Concrete with Water Repellent,” in 2nd International Conference on Bio-based 730
Building Materials, 2017, pp. 489–497. 731
[14] R. Walker, S. Pavía, and R. Mitchell, “Mechanical properties and durability of hemp-lime 732
concretes,” Construction and Building Materials, vol. 61, pp. 340–348, 2014. 733
[15] P. Hellebois, “Etude de l’évolution des propriétés des bétons de chanvre pendant leur 734
vieillissement,” Polytech Clermont-Ferrand - Université Clermont Auvergne, 2013. 735
[16] M. Sonebi, S. Wana, S. Amziane, and J. Khatib, “Investigation of the mechanical performance 736
and weathering of hemp concrete,” in First International Conference on Bio-based Building 737
Materials, 2015, pp. 416–421. 738
[17] C. Yoann, S. Amziane, and M. Sonebi, “Investigation of Weathering Resistance of Hemp 739
Concrete,” in Proceedings of first Int. Conf. on Construction Materials for Sustainable Future, 740
2017. 741
[18] C. Sentenac, M. Sonebi, and S. Amziane, “Investigation on the Performance and Durability of 742
Treated Hemp Concrete with Linseed Oil,” in 2nd International Conference on Bio-based 743
Building Materials, 2017, pp. 343–351. 744
[19] C. Magniont and G. Escadeillas, “Chemical Composition of Bio-aggregates and Their 745
Interactions with Mineral Binders,” in Bio-aggregates Based Building Materials; State-of-the-746
Art Report of the RILEM Technical Committee 236-BBM, S. Amziane and F. Collet, Eds. Springer, 747
25 2017, pp. 1–38.
748
[20] Y. Diquélou, E. Gourlay, L. Arnaud, and B. Kurek, “Impact of hemp shiv on cement setting and 749
hardening: Influence of the extracted components from the aggregates and study of the 750
interfaces with the inorganic matrix,” Cement and Concrete Composites, vol. 55, pp. 112–121, 751
2015. 752
[21] D. Sedan, C. Pagnoux, T. Chotard, A. Smith, D. Lejolly, V. Gloaguen, and P. Krausz, “Effect of 753
calcium rich and alkaline solutions on the chemical behaviour of hemp fibres,” Journal of 754
Materials Science, vol. 42, no. 22, pp. 9336–9342, 2007. 755
[22] D. Sedan, C. Pagnoux, A. Smith, and T. Chotard, “Mechanical properties of hemp fibre 756
reinforced cement : Influence of the fibre / matrix interaction,” vol. 28, pp. 183–192, 2008. 757
[23] J. Sheridan, M. Sonebi, S. Taylor, and S. Amziane, “The effect of a polyacrylic acid viscosity 758
modifying agent on the mechanical, thermal and transport properties of hemp and rapeseed 759
straw concrete,” Construction and Building Materials, vol. 235, 2020. 760
[24] SEBTP, “Construire en Chanvre, règles professionnelles d’exécution de construction,” 2012. 761
[25] Met Office, “UK and regional series,” 2019. [Online]. Available: 762
https://www.metoffice.gov.uk/climate/uk/summaries/datasets#yearOrdered. [Accessed: 09-763
Jan-2019]. 764
[26] J. Sheridan, “The Long Term Durability Performance and Water Sensitivity of Vegetal 765
Concrete,” 2019. 766
[27] Northern Ireland Water, “About your water - Water Quality Results,” 2018. [Online]. Available: 767
https://www.niwater.com/water-quality-results.aspx. [Accessed: 23-Jan-2019]. 768
[28] M. Le Troëdec, C. Peyratout, T. Chotard, J. P. Bonnet, A. Smith, and R. Guinebretiere, “Physico-769
chemical modifications of the interactions between hemp fibres and a lime mineral matrix: 770
impacts on mechanical properties of mortars,” in 10th International Conference of the 771
European Ceramic Society, 2007, pp. 451–456. 772
[29] V. Tserki, P. Matzinos, and C. Panayiotou, “Novel biodegradable composites based on treated 773
lignocellulosic waste flour as filler Part II . Development of biodegradable composites using 774
treated and compatibilized waste flour,” Composites Part A: Applied Science and 775
Manufacturing, vol. 37, pp. 1231–1238, 2006. 776
[30] V. Nozahic, “Vers une nouvelle démarche de conception des bétons de végétaux 777
lignocellulosiques basée sur la compréhension et l ’ amélioration de l ’ interface liant / végétal : 778
application à des granulats de chenevotte et de tige de tournesol associés à un liant ponc,” 779
2012. 780
[31] D. A. Silva, H. R. Wenk, and P. J. M. Monteiro, “Comparative investigation of mortars from 781
26 Roman Colosseum and cistern,” Thermochimica Acta, vol. 438, pp. 35–40, 2005.
782
[32] W. Nakbanpote, B. A. Goodman, and P. Thiravetyan, “Copper adsorption on rice husk derived 783
materials studied by EPR and FTIR,” Colloids and Surfaces A: Physicochemical and Engineering 784
Aspects, vol. 304, no. 1–3, pp. 7–13, 2007. 785
[33] A. Jauneau, M. Quentin, A. Driouich, L. Parois, S. C. Universit, and E. Organismes, “Micro-786
heterogeneity of pectins and calcium distribution in the epidermal and cortical parenchyma 787
cell walls of flax hypocotyl,” Protoplasma, vol. 198, pp. 9–19, 1997. 788
[34] V. Nozahic and S. Amziane, “Influence of sunflower aggregates surface treatments on physical 789
properties and adhesion with a mineral binder,” Composites Part A: Applied Science and 790
Manufacturing, vol. 43, no. 11, pp. 1837–1849, 2012. 791
[35] M. Chabannes, E. Garcia-Diaz, L. Clerc, and J. C. Bénézet, “Effect of curing conditions and 792
Ca(OH)2-treated aggregates on mechanical properties of rice husk and hemp concretes using 793
a lime-based binder,” Construction and Building Materials, vol. 102, pp. 821–833, 2016. 794

![Table 3.1 – Weather statistics for Northern Ireland during the outdoor testing [25]](https://thumb-eu.123doks.com/thumbv2/123doknet/13986445.454659/8.892.59.790.223.420/table-weather-statistics-northern-ireland-outdoor-testing.webp)