// W-0142a
Massachusetts Institute of Technology
International
Motor Vehicle Program
Engine Plant Study
Working Paper
Title: Description Of Procedures In Automotive Engine Plants (ABSTRACT) Authors: Denis Artzner, Dr. Daniel Whitney
Date: October 1997
Contact address for comments or questions to the authors:
MIT Room E40-243
77 Massachusetts Avenue
Cambridge MA 02139
USA
ABSTRACT
1. Human resources
- For automakers, the total cost of paying average workers is around $40000 per year (mean value); the numbers range from $30000 to $60000 (except for a Central European facility where it is much lower). On average, direct pay is three times the amount of benefits. In general, worker qualification does not affect the benefits policy within an automobile engine plant.
- Overall, the average age of workers in engine plants is slightly above 40 years old. There is no difference by geographic region. In older engine plants, workers do tend to be older. Annual turnover rates are around 5%. Mean values for unionization levels are 7990 for hourly workers, 45% for salaried workers. It is common for production workers to be assigned different tasks; the engine plants where the union contract restricts the kind of activities are located in North America. - A majority of engine plants surveyed have work teams, and they are deployed in all departments. In most cases, work teams were introduced about five years ago. Sometimes, work team leaders are not elected. The average training received is 41 hours per employee per year. Fluctuations in the values are large. European facilities tend to have more training. Respondents felt that inspecting one’s work, being well trained, designing one’s workplace and having suggestions accepted are factors which can help workers make high quality engines. Workers and management interact via meetings and surveys. There are usually fewer than 2 suggestions per worker per year. The more training people get, the more likely they are to make suggestions.
2. Logistics
- Delivery of parts to the assembly department of engine plants: the Japanese-owned facilities get a much higher fraction of these components delivered more than once per shift, compared to other plants. There are more instances of “just-in-time” practice for castings and parts delivered to the
machining departments.
- Engine and vehicle assembly plants: for half of our sample, the average delivery pace of finished engines to the car assembly plant is once per shift or more frequently. Engine plants which deliver engines very frequently no matter how far their customer vehicle assembly plants are located. The average value of the average delivery size of finished engines is 273 units (the results are very variable, but in general, the more engines are produced per unit time, the larger the batch size). For one out of two engine plants, the average transit time to the customer vehicle assembly plant is less than half a day; however, there are many cases where finished engines are delivered to vehicle assembly plants located very far away.
3. Maintenance policies
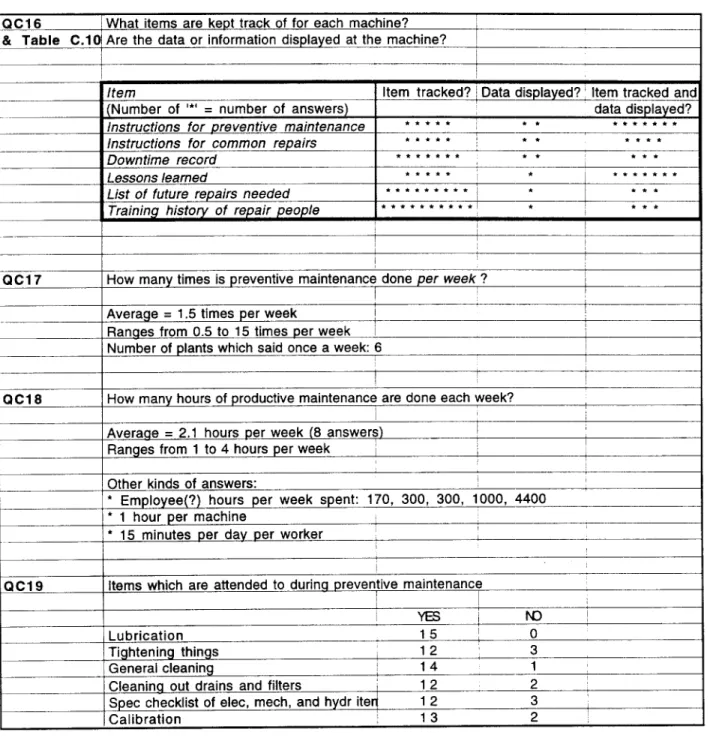
- Total Productive Maintenance (TPM) is in place in all of the plants surveyed, but this is quite recent (implementation started between 1990 and 1994). In two out of three cases, it is based on a centralized planning and information system. All of the key maintenance items mentioned in the questionnaire are taken care of by all engine plants; however, the frequency at which maintenance is done varies a lot from plant to plant (average: one and a half times per week).
- Throughout all departments of engine plants, breakdowns are caused on average mostly by mechanical problems and then by electrical problems although there is a lot of variation between plants. For those types of failures, there is no link with any downtime statistics. Hydraulic failures occur more frequently in those plants which are older.
4. Production technologies
- Several of the engine plants surveyed are currently undergoing major changes. For a new engine variant, most engine plants can deal with the adaptation by using much more than half of the existing machines. In engine plants, a “minor upgrade” can stop lines anywhere between less than 24 hours to more than a week. Currently, assembly lines in engine plants can handle more flexibility than machining lines. When different engines are built in sequence, the pattern used most often is 1-1- 1-2-2-2 (batch sizes range from 6 to 100’s of engines).
- Current and future design and acquisition processes for equipment do not differ. There is one policy for the whole plant. For a majority of engine plants, the methodology is as follows: the automobile company takes care of defining the requirements, it has a large influence (along with an affiliate or sister company sometimes) for the planning process, but the design and building of equipment is done by an outside equipment or system supplier. Two areas where answers differ a lot concern the system integration and the actual installation of equipment in engine plants: in some cases, the automobile company is in charge, while in other cases, an outside firm does the job.
5. Quality
- Engines made in European plants have more complaints per 1000 than the North American or Japanese ones (caution: we have rather few of these data points from non-European plants). Engine quality as measured by complaints per 1000 units after engines are delivered: 3-month quality data are quite good predictors of 12-month data.
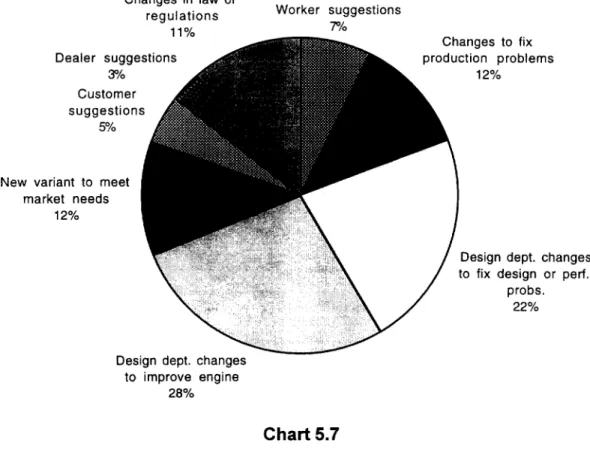
- In almost all engine plants, Statistical Process Control (SPC) data are collected and displayed at the line or work station. Engine plants also get back some engine performance and warranty data. - In most instances, communication of engine design information is done via fax or hardcopy. Sometimes, CAD systems (mostly 2-D) are used to exchange design dat~ however, whether CAD systems are used or not, is not a function of the age of the engine plant or of the lines. In a majority of cases, the exchange of information between the plant and the engine design department take place weekly, with actual design changes happening monthly. On average, half of the design changes are due to the engine engineering department, in order to improve the engine and to fix design or performance problems. Other causes for design changes are the meeting market needs, fixing production problems, and responding to the evolution of regulations.
- All plants conduct hot testing of engines; in two facilities, only some of the engines are hot-tested. The test can last from 45 seconds to 18 minutes. The (few) all-aluminum engines of our survey are among those which undergo longer periods of hot testing. Less than 7% of the engines fail the hot test the first time. By looking simultaneously at the engine quality data and at the hot testing results, we did not find any correlation: hot test duration does not uncover problems which cause quality complaints 3 or 12 months after the engines are delivered to customers.
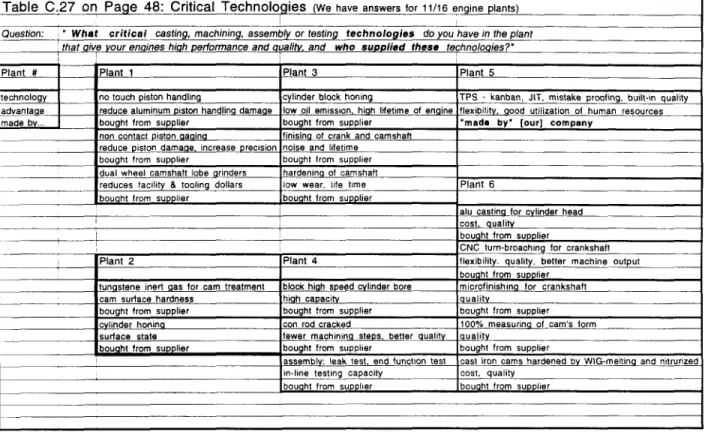
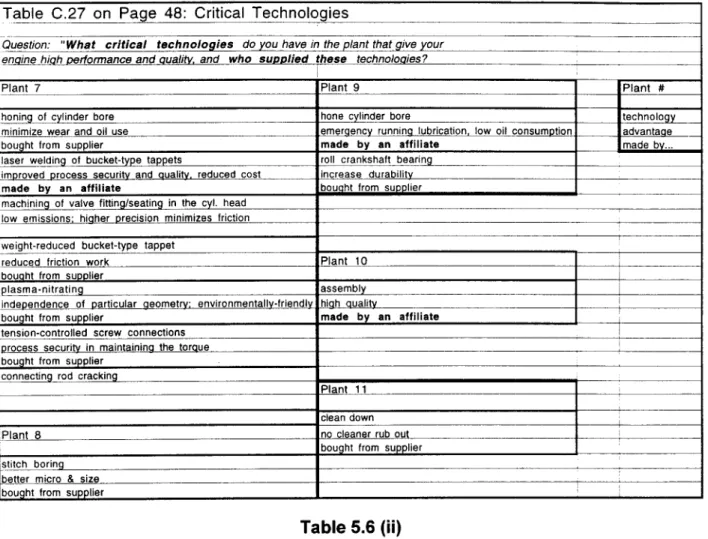
- According toourrespondents, production technologies thatcan becritical formanufacturing high quality automotive engines concern machining operations more than the sub-assembly and final dressing ofengines; interestingly, these technologies are most often supplied by outside vendors. In addition, organizational factors are seen as much more effective than automatization, in order to produce high-quality engines.
6. Information systems
- Information systems are in place in engine plants, and they are used quite extensively.
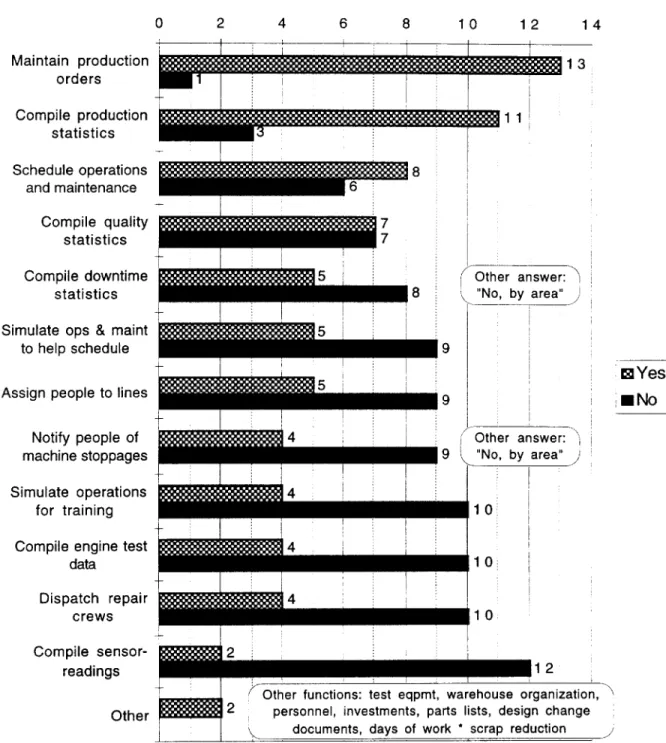
- While centralized systems tend to be used mainly for planning purposes, non-centralized computer systems can help compile some statistical data and tell about equipment problems. Rarely are information systems actually used to give work assignments to employees.
7. Accounting procedures and investment decisions
- For a series of recent major installations of equipment in engine plants, it took around two years between the approval of the plan and the moment when the first part was produced, and from there on, an extra three to six months for full production levels to be reached.
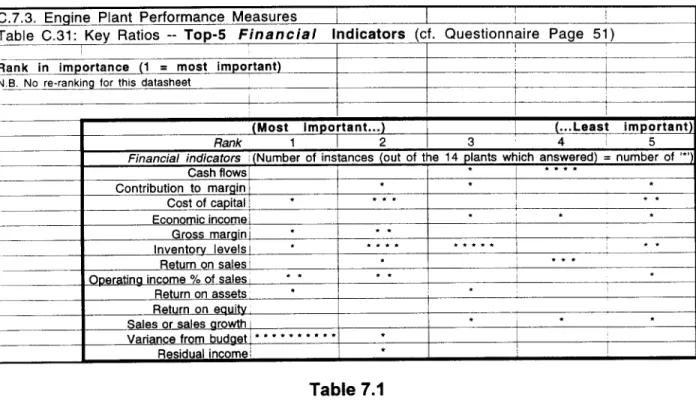
- The top financial indicator used by car firms for measuring the “performance” of engine plants is clearly variance from budget. Some financial ratios like return on equity or return on assets are not used at all. For non-financial indicators, the quality of engines is most important, followed by safety and environment concerns, logistical issues, and labor productivity.
- Product quality and internal rate of return are the two most important factors involved in engine plant investment decisions.
- Most common practice is that indirect cost allocation uses standard or actual labor hours.
- Activity-based costing systems were in place in 30% of the engine plants surveyed ( 1995 data).
8. Plant improvement efforts
- The persons surveyed do not think that more automation will be the key for progress in engine manufacturing. For the future, a strong desire is the ability to improve the flexibility of the factory, of the machines, and of the material flow. Interestingly, the respondents most interested by flexibility improvements are based in engine plants which currently deal with rather low levels of engine variety.
- On the list of factors which can help improve operations in engine plants, is the need to establish better contacts with people in the engine design department and with the suppliers of machinery. Also, being able to build more engines in less space is an important goal for several respondents; actually, those most interested by this issue are from engine plants where the utilization of space is already more efficient than on average.
This study was sponsored by the International Motor Vehicie Program. The authors gratejidly acknowledge its support.
Massachusetts Institute of Technology
International
Motor Vehicle Program
Engine Plant Study
Working Paper
Title: Description Of Procedures In Automotive Engine Plants
Authors: Denis Artzner, Dr. Daniel Whitney
Date: October 1997
Contact address for comments or questions to the authors: MIT Room E40-243
77 Massachusetts Avenue
Cambridge MA 02139
USA
Table of Contents
ABsTRAcT . . . ...4
INTRODUCTION . . . 7
1. HUMAN RESOURCES . . . 9
ANNUAL PAY OFWORKERs;DIRECTPAyvs. BENEmTs...9
AGE OFWORmRS.TURNOVER.AND UNIONIZATIONIN ENGI~PLANTS ...ll NON.PRODUCTIONJOBSPENOR~D BY PRODUCTIONWOR~RS'?...15
Description of tasks . . .. .. . .. .. .. . ... .. . ... .. . ... .. . .... . .. ... .. . ... .. .. ... . .. ... .. . ... . . .... . .. .. . .. ... . .. .. .. . ... . . ... . . ... . .. . .. . .. . . ... 15
Production workers . . .. ... . . ... .. . ... . .. ... . .. ... .. . .... . .. ... .. . .... . .. ... . .. ... . . .... . . ... .. .. .. .. . ... .. . ... . . ... . . ... . . ... . . .. . .. .. . .. .... 16
QUALITY CIRCLESIN ENGI~PLANTS ... 17
WORKmAMS IN ENGI~PLANTS ... 18
TRAININGHOURSIN ENGIm PLANTS... 20
FACTORSIN~~NCING QUALITY...24
METHODSUSEDBY MANAGEMENTTO UNDERSTANDTHENEEDSANDMOTIVATIONSOFWORKERS... 25
SUGGESTIONPOLICIES,INCENTIVEPROGRAMS,KINDOFINFORMATIONABOUTPERFORMANCEWHICHISAVAILABLE TOT= WOR=RS ... 26
IS T~RESO~LNK BETwENTRAINING ANDsuGGEsTIONPractices? ...28
2. LOGISTICS . . . 29
FRACTIONOFPARTSDELIVEREDMOREO~NTHAN ONCEPERSH~ ... 29
TRANSITTI~TOTW~AmST ANDFART=sT SuppL~RsOFENGI~PARTs ...33
l. Patisfor the MA CHINING departments (cfi Chati2.5) .. .. . ... .. . ... .. . ... . .. .. .. . ... .. . ... . .. .. .. . .. .. . .. .. . .. . .. .. . . .. ....34
2. Parts forthe ASSEMBLY department(cf Chart 2.6) . .... . .. ... . .. ... .. . ... . . ... .. . ... . .. ... . . ... . .. .. .. ... . .. .. . . ... . ... . . ...35
LEADTIMEBEMENTHE suppliers ANDT~ENGIm PLANTS...36
Analysis of the data . .. . .. ... . .. .. .. . ... .. . ... .. .. ... . .. ... .. . ... .. . .... . .. .. .. . ... .. . .... . . ... . .. .. .. . ... . .. ... . . ... . . ... . . ... . . .. . .. .. ... 38
FREQUENCYANDSIZEOFDELIVERYOFFINISHEDENGINESTOTHEVEHICLEASSEMBLYPLANTS... 39
Cha~2.9(number of answers) .. . .. .. .. ... . .. ... . .. ... . ... ... . .. ... .. . ... . .. .. .. .. ... . . ... .. . ... . .. .. .. . ... . .. .. . . ... . .. .. . . ... . . .. .. . ... 39
Cbti2.10 ad Chati2.11 .. ... .. . ... . .. ... .. . ... .. . ... .. . ... ... . ... .. . ... .. . ... . .. ... . .. ... . .. ... .. ... .. . .. .. . .. .. . ... . . ... . . .. . .. .. . . ... . 40
Chati2.12ati Chati2.13 .. ... . . ... .. . ... .. . ... .. .. ... . .. ... . .. ... .. .. ... . .. .. .. . .... . . ... .. . ... . .. .. .. . ... . . ... . .. .. . .. .. .. . .. . . .. .. . .. .. 42
TRANSITTI~BEmEN T= ENGINEPLANTANDT~VEHICLE ASSEMBLYPLANTS...44
Observations . . .. .. . ... . . ... . .. ... . . ... .. . ... .. . .... . . .... . . .... . .. ... .. . ... .. .. .. .. . ... .. . ... . .. ... . . ... .. . ... . .. .. . .. .. . .. ... . . .. . . ... . . .. .. . 44
Conclusions.. . .. . .. .. . .. .. .. . ... . .. ... . . .... . .. ... . .. ... .. . ... .. . ... .. .. ... . .. ... . .. ... . .. .. .. . ... . .. ... . . .... . .. .. . . ... . . ... . . .. . .. .. . .. .. . 45
LEADTIMEFORT= DELIvERyOFmNIs~DENGI~s TOvEHICLEAssEMBLypLANTs...47
3. MAINTENANCE POLICIES . . . .48
GENERALINFORMATION... ... ... .. ... .. .. . .. ... 48
PREVENTIVEMAIN~NANCE. BWAKDOwN ANDREPAIRpOLIcIEs...52
TYPESOFBREAKDOWNS(% DISTRIBUTION)... .. ... 53 4. PRODUCTION TECHNOLOGIES . . . 58 FLEXIBILITY... ... .. ... 58 EWJIPMENTDESIGNAND ACQUISITION... . ... .. .. .. ... . ... .. . ... .. .. .. .. . ... .. . ... .. . ... .. . ... . .. .. .. . ... . . ... . .. .. . . ... . . .. . .. .. . . ...65 Tables C.14and C.15 . . .. ... . .. .. .. . ... .. . ... .. . .... .. . ... .. .. .. .. . .... . .. ... .. . ... . .. ... . .. ... . . ... . . .... .. ... . .. .. . .. .. . .. . . ... . .. . 65 Table C.19 .. . .. . .. .. .. . .. . .. .... . . ... . .. ... . .. ... . .. ... . .. ... .. . ... .. . ... .. . ... . .. ... . .. ... . .. .. .. . ... . .. .. .. . ... . .. .. . . ... . .. .. . .. . . .. .. . .. .. 66 A) Machining.. . ... . . ... . . ... .. . ... . .. ... . .. ... . .. ... . .. ... .. .. .. .. .. ... .. . ... .. . ... .. . ... . .. ... . . ... .. . ... . . ... . . ... . .. .. . .. .. . . ... . . ... .. ... 66
Customer satisfaction index .. . .. ... . . ... .. . ... .. .. .... .. .... . .. ... .. . ... .. . ... .. .. ... . . .... . .. .. .. . ... .. . ... . .. .. . . ... . .. . 69
“Initial’’engineq uality...,... . .. ... .. . ... .. .. ... . .. ... . ... .. .. .. ... . .. ... . .. ... . .. ... .. . ... . . ... .. . .. .. . ... . . .. .. . .. . 69
Evolution ofengine quaiitydata .. .. . ... .. .. .. .. .. ... .. . ... .. .. ... . .. ... .. .. .. . ... .. .. . ... .. . ... . .. ... .. . ... . . ... . . ... .. . .. . . ... . . ... . ...70
Reliability of engines. .. .. .. . ... . .. ... . .. .. .. .. ... . .. ... .. . .... . . ... .. .. ... .. . ... .. .. ... . .. ... . .. .. . .. ... . 74
Long-termquality . . . .. .. .. . .. . ... .. . ... .. . ... .. . .... . . .... . .. ... . .. ... .. .. .. .. .. ... .. . ... .. . ... . .. ... .. . .. .. . 75
Comparison with J.D. Powerengine quali~ data . . .. .. .. . ... . .. ... . .. ... . .. ... .. .. .. .. . ... .. . ... . . ... . .. .. . .. .. . . .. . . .. . . .. .. . .. 75
QUALITY DATA COLLECTION... ... ... 76
DESIGN/MANUFACTURINGINTERACTION..,... 77
Reasons for design changes.. . ... . .. .. .. . ... .. . ... .. .. ... . .. ... .. . ... .. . ... .. .. .. .. . .... ... .. . .. ... . .. .. .. . ... . . .. .. . .. .. . ... . . .. . . ... . .. 78
TESTINGOFENGINESIN ENGINEPLANTS... ... ... ... ... 79
Hottesting .. . . ... . .. .. . . ... . . ... . .. ... . .. .. .. . .... . .. ... . .. ... .. . .. .. .. ... . .. ... . .. ... . .. ... . . ... .. . ... .. . ... . .. .. . .. .. . . ... . .. .. . . .. .. . .. . . . 79
Cold testing: . ... . . ... . . ... . .. .. .. . ... . .. ... . .. ... .. . ... .. . ... .. .. ... .. . .... . . .... . . .... . . ... .. . ... . .. .. .. . ... . .. .. .. . ... . . .. .. . .. . . ... 85
Other infomtion about testing: .. ... . .. ... .. . .... . .. .. .. .. ... . .. ... .. . .... . .. ... . . ... .. . ... .. . ... . .. .. .. . .. .. . .. .. . ... . . .. . .. .. . . .. .. . . 85
CRITICALTECHNOLOGIESANDTECHNICALFACTORSFORHIGHQUALITYPRODUCTION... 89
6. INFORMATION SYSTEMS . . . 92
CENTRALANDNON.CENTRALI~ORMATIONSYS~MS ... 92
ACCESSTOENGIWPLANTOPERATINGDATA... 96
7. ACCOUNTING PROCEDURES AND INVESTMENT DECISIONS . . . 97
EXAMPWOFA RE~NTMAJOR INSTALLATIONOFEQUIPMENT... 97
ENGIWPLANT PERFORMAN~~ASU~S ... 98
Fi~ncial idicators . .. . .. .. .. . ... . .. ... . .. ... . .. .. .. .. ... .. . ... .. . ... .. .. ... . .. ... . .. .. .. .. .. .. . ... . .. .. .. . ... .. . .. . .. .. . . ... . .. .. . . ... . . .... 98
Non.fimncial indicators ... .. ... .. . ... . .. ... .. . ... . .. .... . . ... .. .. ... . .. ... . .. ... . .. ... . . ... .. . .... .. ... . . ... .. . ... .. .. . .. .. .. . .. . . ... . . ...lOO INmSmTDECISIONS ...lOl INDImCT COSTWLOCATION...lO2 ACTIVITY.BASEDCOSmNGSYS~MS...l O3 8. PLANT IMPROVEMENT EFFORTS . . . .104
Comments on flexibiliQ . .. . ... . .. ... . .. .. .. .. ... . .. ... .. . ... . .. ... .. .. ... . . .... ... ... . . ... . .. ... . . ... . .. .. .. . ... . . ... . . .. .. . .. .. . .. . .. ..lO6 conclusion . . . .. . . ..lo9
ABSTRACT
1. Human resources
- For automakers, the total cost of paying average workers is around $40000 per year (mean value); the numbers range from $30000 to $60000 (except for a Central European facility where it is much lower). On average, direct pay is three times the amount of benefits. In general, worker qualification does not affect the benefits policy within an automobile engine plant.
- Overall, the average age of workers in engine plants is slightly above 40 years old. There is no difference by geographic region. In older engine plants, workers do tend to be older. Annual turnover rates are around 5%. Mean values for unionization levels are 79% for hourly workers, 45% for salaried workers. It is common for production workers to be assigned different tasks; the engine plants where the union contract restricts the kind of activities are located in North America. - A majority of engine plants surveyed have work teams, and they are deployed in all departments. In most cases, work teams were introduced about five years ago. Sometimes, work team leaders are not elected. The average training received is 41 hours per employee per year. Fluctuations in the values are large. European facilities tend to have more training. Respondents felt that inspecting one’s work, being well trained, designing one’s workplace and having suggestions accepted are factors which can help workers make high quality engines. Workers and management interact via meetings and surveys. There are usually fewer than 2 suggestions per worker per year. The more training people get, the more likely they are to make suggestions.
2. Logistics
- Delivery of parts to the assembly department of engine plants: the Japanese-owned facilities get a much higher fraction of these components delivered more than once per shift, compared to other plants. There are more instances of “just-in-time” practice for castings and parts delivered to the machining departments.
- Engine and vehicle assembly plants: for half of our sample, the average delivery pace of finished engines to the car assembly plant is once per shift or more frequently. Engine plants which deliver engines very frequently no matter how far their customer vehicle assembly plants are located. The average value of the average delivery size of finished engines is 273 units (the results are very variable, but in general, the more engines are produced per unit time, the larger the batch size). For one out of two engine plants, the average transit time to the customer vehicle assembly plant is less than half a day; however, there are many cases where finished engines are delivered to vehicle assembly plants located very far away.
3. Maintenance policies
- Total Productive Maintenance (TPM) is in place in all of the plants surveyed, but this is quite recent (implementation started between 1990 and 1994). In two out of three cases, it is based on a centralized planning and information system. All of the key maintenance items mentioned in the
- Throughout all departments of engine plants, breakdowns are caused on average mostly by
mechanical problems and then by electrical problems although there is a lot of variation between plants. For those types of failures, there is no link with any downtime statistics. Hydraulic failures occur more frequently in those plants which are older.
4. Production technologies
- Several of the engine plants surveyed are currently undergoing major changes. For a new engine variant, most engine plants can deal with the adaptation by using much more than half of the existing machines. In engine plants, a “minor upgrade” can stop lines anywhere between less than 24 hours to more than a week. Currently, assembly lines in engine plants can handle more flexibility than machining lines. When different engines are built in sequence, the pattern used most often is 1-1- 1-2-2-2 (batch sizes range from 6 to 100’s of engines).
- Current and future design and acquisition processes for equipment do not differ. There is one policy for the whole plant. For a majority of engine plants, the methodology is as follows: the automobile company takes care of defining the requirements, it has a large influence (along with an affiliate or sister company sometimes) for the planning process, but the design and building of equipment is done by an outside equipment or system supplier. Two areas where answers differ a lot concern the system integration and the actual installation of equipment in engine plants: in some cases, the automobile company is in charge, while in other cases, an outside firm does the job.
5. Quality
- Engines made in European plants have more complaints per 1000 than the North American or Japanese ones (caution: we have rather few of these data points from non-European plants). Engine quality as measured by complaints per 1000 units after engines are delivered: 3-month quality data are quite good predictors of 12-month data.
- In almost all engine plants, Statistical Process Control (SPC) data are collected and displayed at the line or work station. Engine plants also get back some engine performance and warranty data. - In most instances, communication of engine design information is done via fax or hardcopy. Sometimes, CAD systems (mostly 2-D) are used to exchange design data; however, whether CAD systems are used or not, is not a function of the age of the engine plant or of the lines. In a majority of cases, the exchange of information between the plant and the engine design department take place weekly, with actual design changes happening monthly. On average, half of the design changes are due to the engine engineering department, in order to improve the engine and to fix design or performance problems. Other causes for design changes are the meeting market needs, fixing production problems, and responding to the evolution of regulations.
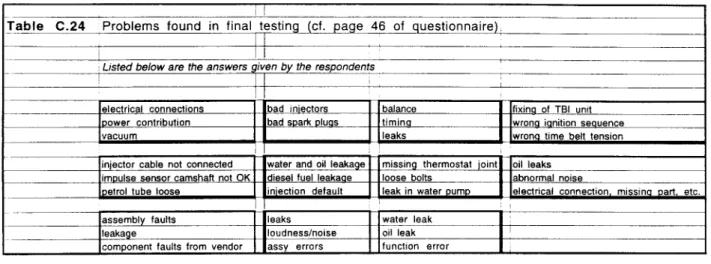
- All plants conduct hot testing of engines; in two facilities, only some of the engines are hot-tested. The test can last from 45 seconds to 18 minutes. The (few) all-aluminum engines of our survey are among those which undergo longer periods of hot testing. Less than 7% of the engines fail the hot test the first time. By looking simultaneously at the engine quality data and at the hot testing results, we did not find any correlation: hot test duration does not uncover problems which cause quality complaints 3 or 12 months after the engines are delivered to customers.
- According to our respondents, production technologies that can be critical for manufacturing high quality automotive engines concern machining operations more than the sub-assembly and final dressing of engines; interestingly, these technologies are most often supplied by outside vendors. In addition, organizational factors are seen as much more effective than automatization, in order to produce high-quality engines.
6. Information systems
- Information systems are in place in engine plants, and they are used quite extensively.
- While centralized systems tend to be used mainly for planning purposes, non-centralized computer systems can help compile some statistical data and tell about equipment problems. Rarely are information systems actually used to give work assignments to employees.
7. Accounting procedures and investment decisions
- For a series of recent major installations of equipment in engine plants, it took around two years between the approval of the plan and the moment when the first part was produced, and from there on, an extra three to six months for full production levels to be reached.
- The top financial indicator used by car firms for measuring the “performance” of engine plants is clearly variance from budget. Some financial ratios like return on equity or return on assets are not used at all. For non-financial indicators, the quality of engines is most important, followed by safety and environment concerns, logistical issues, and labor productivity.
- Product quality and internal rate of return are the two most important factors involved in engine plant investment decisions.
- Most common practice is that indirect cost allocation uses standard or actual labor hours.
- Activity-based costing systems were in place in 30% of the engine plants surveyed ( 1995 data),
8. Plant improvement efforts
- The persons surveyed do not think that more automation will be the key for progress in engine manufacturing. For the future, a strong desire is the ability to improve the flexibility of the factory, of the machines, and of the material flow. Interestingly, the respondents most interested by flexibility improvements are based in engine plants which currently deal with rather low levels of engine variety.
- On the list of factors which can help improve operations in engine plants, is the need to establish better contacts with people in the engine design department and with the suppliers of machinery. Also, being able to build more engines in less space is an important goal for several respondents; actually, those most interested by this issue are from engine plants where the utilization of space is already more efficient than on average.
This study was sponsored by the International Motor Vehicle Program. The authors gratejidly acknowledge its support.
Introduction
Comments Relative to the Analysis of Part C from the
IMVP Engine Plant Study Questionnaire.
Description
of Procedures
in Automotive
Engine Plants
The goal of this working paper is mainly to communicate the information contained in Part C of the
questionnaire about engine plants which had been filled out by the respondents of companies
participating in the IMVP International Automotive Engine Plant Survey of 1995.
The topics covered are the following:
1. Human resources 2. Logistics 3. Maintenance policies 4. Production technologies 5. Quality 6. Information systems
7. Accounting procedures and investment decisions 8. Plant improvement efforts
Also, we wish to answer to some of the sponsors’ strong desire to know what is happening in engine plants all over the world, in terms of plant procedures and organization. Obviously, the clients of this study who are operations people wonder what their competitors are doing, and this study can help them figure this out in some ways.
The abstract of this paper is a much shorter version of this document (it is like a 3-page “executive summary”), where the most striking findings are highlighted.
To those companies which have had some of their engine plants participate in the survey, we send along with this document a set of all the graphs and tables with the individual answers from the numerous charts which are inserted throughout this paper.
A few general remarks:
Please keep in mind that the information presented here is a “snapshot”, because it only corresponds to what has been indicated to us by engine plants about their situation around 1995. This survey tries to capture how a series of engine plants operate; most of them are located in Europe and in North America (including one Japanese transplant); two are in Japan. More than 20 very different families of engines are manufactured in the facilities for which we have answers.
The data presented in the graphs and described in the text below can deal with answers to questions which all respondents might not have understood or interpreted in the same manner (especially in this third section of the questionnaire).
You will notice that in some instances, there are more answers than in other instances; this is because a few portions of the questionnaires were not filled out by some of the plants participating in the survey.
Some of the data from Part C had already been analyzed and shown via viewgraphs at earlier occasions during presentations to the sponsors of this IMVP study. A few results had also been included in Guillenno Peschard’s Master’s thesis at MIT (June, 1996), titled: “Manufacturing Performance: a Comparative Study of Engine Plant Productivity in the Automotive Industry”.
1. Human
resources
Annual pay of workers; direct pay vs. benefits
Two graphs are used to describe the results contained in Table C. 1 of the questionnaire about the pay of workers in engine plants.
Chart 1.1 describes the companies’ total annual cost of paying an entry-level, average, and experienced worker. Most of data points fall in the range between just under $30000 per year and $45000 per year (in two cases, the results are quite higher than this range of values, while in one other plant, the pay is much less, as it is a Central European facility). The graph also indicates in which region of the world the engine plants are located (E = Europe, NA = North America). The three engine plants operated by Japanese companies did not answer to this question. As an exercise, we mention the effect of the rise of the U.S. $ between 1995 and 1997 (average of +22% against the currencies involved in our sample): assuming no pay change in the engine plants, the salaries in 1997 $‘s are plotted in the right columns. So, currency fluctuations and the resulting variations in the results plotted make it quite irrelevant to try to correlate pay numbers with other parameters or answers from the survey.
70000 60000 50000 40000 30000 20000 10000 0
Annual Pay For Workers In Engine Plants: Total Cost To Firm (cf. Table C.1 on Page 30 of Questionnaire)
GE”
‘ Mean Value = $38157 (’95)* Mean Value (without plant from Central Europe) = $40802 (’95)
m
r’
Y . I .n
1-1:1
“ The rise of the U~S. $’o(er other currencies between : these two Years is what causes the variations.
lcomanies answered to cwestionsabout worker Dav. I i
E E N4 E E E E M N4 E M E E
Engine Plants & Location
Chart 1.1
When the data were indicated by respondents (only 11 cases), we plotted on Chart 1.2 the relative distribution of direct pay versus benefits. On average, direct pay is three times as much as benefits (76% vs. 24%). We notice that the two engine plants where benefits (as a percentage)
are greatest are located in developing countries. On the other extreme of the chart, the four engine plants where benefits (as a percentage) are smallest are located in countries from Northern Europe. We also note that, within an engine plant, the relative distribution between direct pay and benefits basically does not change whether one looks at entry-level, average, or experienced workers: salary policy is plant- and country-dependent more than it is a function of worker qualification.
Relative Distribution Of Direct Pay And Benefits For Workers 100% -– 90% — 8070 -— i’o% — 60% — 50% +- 4070-30% 7 20% + 1070— o%
-In Automotive Engine Plants (cf. Table C.1 on Page 30 of Questionnaire)
rage workers)
ECT PAY: mean value = 76% averaae workers)
IFITS: mean value = 24% (fc
I I!ml IMii
m
Ii
P
* on the graph), there is 1 nefits to the overall lL=E— — — — — — — — —
m worker pay, but the data presented here just shows 1A . Average Workers the importance of direct pay re/ative to benefits. I 1X = Experienced Workers
-B ,M,MH BI,HH, ~!~~ ,~~a’ ,~, H, ~
LAX LAX LAX LAX LAX LAX LAX LAX LAX LAX LAX
These are the only 2 plants ** *. **
in developing countries Engine Plants (11 Answers)
Chart 1.2
Age of workers, turnover, and unionization in engine plants
All of these data from Table C.2 of the questionnaire are shown on Table 1. 1; they date from 1995 or just prior to that time. Since most of the engine plants from the survey are located in North America (NA) and in Europe, we have decided to give the specific numbers by region as well.
lTable C.2 (cf. ~aae 30 of questionnaire)
I
I
Miscellaneous information about workers in engine plants (1995 data)
1-
1 IAyeraqe aae of workars
1
I I
Hourly workers Salaried workers
Average Min Max Your plant Average Min Max Your plant
All 38 ~ 25 47 41 32 47
FJ4 39 ~ 25 46 ~ 44 43 45 :
Europe 37 ~ 29 47 41 34 47
L
1 I [Amrual turnover rate I
, I
! I
Hourly workers Salaried workers
Average I Min Max Your plant Average Min Max Your plant
_All 4.4% ~ 1,0% 8.870 4.3% 0.0% 12.4% I M 3.2~o 1 ,9% 5.O~o 6.2% 1 .5% 8.5% Europe 5.O~o 1 .0% 8.8?L0 4.2% 0.0% 12.4% ~ I I I I Percent in unions I
Hourlv workers Salaried workers
Averaae ~ Min Max Your Dlant Averaae Min Max Your plant
All 79% : 0?/0 10070 45Ya o % 100% 1
M 80% o % 100% 6 % o % 11% :
Eurooe 78% [ 33% 100% 63% o % 94% :
Table 1.1
Concerning the average age of workers (values vary around a mean of 40 years), there is no major difference between North American and European engine plants: the average, minimum and maximum values are quite comparable too. A question which then comes to mind is the following: does the age of workers have anything to do with how old the engine plant is? Chart 1.3 plots those two sets of values one against another, and from the statistical analysis, we can conclude that the age of engine plants and the average age of hourly workers are positively correlated. The same holds true (with slightly less statistical confidence) for saluried workers, as shown on Chart 1.4. So, the older the engine plant, the older its workers (on average).
50
45
40
20
Age Of HOURLY Workers vs. (cf. Table C.2 on Page 30 + ● ’ I I ,
Age Of Engine Plant of Questionnaire) & y = 0.4023x + 30,587 + ● t-stat = 2.99 I ● I I I I
4 Average value = 38 yeare (aa of 1995) ~I
I i
I
‘Turnover rate (hour/y workers): -- Min = 1.0%
- Averaae = 4.4% !- Max Z 8,8%
o 5 10 15 20 25
Engine Plant (as of 1995)
Chart 1.3
Age Of SALARIED Workers vs. Age Of Engine Plant (cf. Table C.2 on Page 30 of Questionnaire)
50 I I ““= 0.2023X+ 37513 + 45 –– ~ t-stat = 2.45 +, I* (D ● ,
~ Average value = 41 years (as of 1995) 40
+ +
30+++-’’’?”
‘
Turnover rate (sa/aried workers):
25
20
0 5 10 15 20 25 30 35 40
Age of Engine Plant (as of 1995)
Chart 1.4
Annual turnover rates arealmost always inferior to 10% -- typically, half of that. Table 1.1 enables to see the differences which exist between hourly and salaried workers, and between North America and Europe.
Hourly workers in engine plants are more unionized (average of 79%) than salaried workers (average of 45%). The details are indicated on Chart 1.5. There are some engine plants where all hourly workers belong to unions.
Percentage Of Automotive Engine Plant Workers In Unions (cf. Table C.2 on Page 31 of Questionnaire)
100%
%:-”
‘-’
“---.
100% -.—..—. — —. ‘.\ -- -+ 90% – ~. =.\ ..-. -. 90% ‘:\ 80Y. — ~Average =79% >—S~—x-- ‘“:~\ ‘ -- ... . 80% \\\- -. . .. . \ ‘ \ 70~o — \ . . * - 70% t\ ‘., x 60% \. 60% \’. .. ‘.. \ so% ‘- \\ x :50% { Average = 45% “I \ 40% – /, \ \ \ ~40% o\’\\
so% \ \ \ \ 30% ‘, ‘\.\ 20% \ ‘\ ‘\, 20% y.‘\.
1O’zo~ .10%. I 1 o% L m Hourly Workers jobs performed Chart 1.5 by production ‘4 !0% Salaried Workers workers ? Non-production Description of tasksIn Table 1.2, we present the answers from Table C.3 of the questionnaire. It indicates which duties can be performed by the different categories of employees within automotive engine plants.
1
~stion asked: who rx+’forms the following jobs?
Catecaw s of emDlovees Production Maintenance Other hourly SkWed trade Superwsor Enqineerinq staff Quality control staff
Duties (Number d ,- . “umber .1 answers) workers workers workers
.A@M machmes . . . . . . . . . . . .
Do rework or reoa$r to parts andfor to assemblies ....”...-...
. . .
. . ., . .
Make minor repairs to machmes . . . . . . . . . . . . .
.Set or adtust tools . . . . . . . . . . . . . . .
Sharoen tools . . . . . . . . . .
Pweventlve maintenance on nmchmes . . . . . . . . . . .=-. . . T.
Inspect wrxk, do qauq!n.aand measur!nq . . . . . . . . . ..
Record statistical Drccess data
. . . . . . . .
. . . . ..- . . .. . . .
.A@vzes statistical Drccess data
. . .
. . . . . . . . . .-. . . . . . . . . . . . . . .. .. . . .
Do material handhng inside a shcg . . . . . . . . .
Do material handlma between shoos . . . . . . . . ..— . .
Manaae inventory . . ..- . . . . . . . . . . . . . . . .
Repair machines . ...+ . . . . . . . . . . . . . . .
I
t I Note: it IS possible that several Cateqorles of emDloyees perform the same duty I
Table 1.2
Overall, one can notice that:
* Some categories of employees have job descriptions which seem to be well defined (e.g. maintenance workers, supervisors, and quality control staff people). For example, the quality staff will just be in charge of inspecting work, doing gauging and measuring, along with recording and analyzing statistical process data.
* On the contrary, production workers are often assigned to a series of many different tasks in engine plants. Also, other hourly workers and skilled trade people can
have several duties.
* Aside from analyzing statistical process data, the engineering staff if not involved very much in the activities listed in this table. Nevertheless, it is interesting to note that, out of 16 engine plants, the 3 belonging to Japanese companies account for almost 40% of the cases where engineering people are doing some of the jobs listed (aside from analyzing statistical process data). Thus, we can imagine that Japanese “methods” encourage engineers to get more involved on the factory floor. It may be that some of this is due to the fact that Japanese companies tend to have fewer levels of hierarchy than European or American automakers, hence increasing the variety of activities which the engineering staff has to deal with.
Production workers
Chart 1.6 indicates the date when production workers started performing mm-production jobs for the 12 engine plants where such things are possible. These 12 facilities comprise 11 engine plants where the union contract does not restrict the number of different types of work which hourly workers can perform, plus one plant which is not unionized and where it is OK for production workers to do non-production work occasionally.
Date When Production Workers Began Doing Non-Production Jobs (In 4 Cases Out Of 16, This Does Not Even Occur)
(cf. QC1 and QC2 on page 31 of the questionnaire) 1995 1990 1985 1980 c’ g 1975 1965 1960 1955 1950
ook to happen I– JIant opening ~
‘QC2:‘dDoes the union contract (if any) restrict the : —— number of different types of work which hourly t !workers can perform?”
1- YES= 3 (all located in FJotih America) ~ /- “NO” = 11
[. “N/Ai = 2 I
&
Engine Plants
Chart 1.6
The 3 engine plants where the union contract does restrict the kind of
which can be performed by production workers, are all located in North America.
activities
On the graph, we have also indicated the number of years it took between the opening of the plant and the time when “work flexibility” began. In half of the cases, it was immediate, but in the other half, it took a long period to happen.
Quality circles in engine plants
Analysis of the survey shows that there are problem-solving groups (such as quality circles, Kaisen groups...) in all but one of the participating engine plants.
However, the extent to which these groups are deployed varies a lot from plant to plant: anywhere between 6 and 38 groups (for a majority of facilities), around 100 (two instances) or even many more (400 groups) in one specific engine plant (which is very large indeed). Chart 1.7 shows this.
Number Of Formal Groups (e.g. Quality Circles) Which Meet
On A Regular Basis In Engine Plants l-q
(cf. QC3 and QC4 page 31)
~(LWej iylm~~ 110 --–
100 ‘
90 — QC3: “Does your plant have quality circles, employee
involvement groups, Kaisen groups, or other problem 80- solving activities ?“
70 -- “YES” = 13 (1ofwhich has no formal groups)
60- ~- “NO” = 1 :- “N/A” = 2 50 40 30 20 10 0 NA NA E NA E E NA E J NA E E
Engine Plants & Location
Chart 1.7
Work teams in engine plants
Among the engine plants which participate in this survey, only two had introduced work teams more than five years ago. The 10 others which do have work teams, have started this between 1991 and 1993. And when work teams were introduced in an engine plant, it was in all areas of the plant at the same time. Work teams within a department such as machining, subassembly or assembly and testing always have a team leader.
Number Of Work Teams In Engine Plants (By Plants) (cf. Table C.4 page 31)
100
WORK TEAMS
90
---Work teams have been introduced VERY RECENTLY (1991-1993), except m 2 engine plants (1982 and 1989).
-- +
Note: this (large) engine
80 – ,–, plants has 258 teams in _
TEAM LEADERS? I ARE THEY ELECTED? the machining departments
—.
[II - ———
,“
Arethere team leadere in MACHINING? Ifyes, are they elected? ~ ,“YES’= 12(electedi n5 cases) “NO” = 2 “N/A” = 2
60 \Aretheret eamleadersi nSUBASSEMBLY?l fyes,aret heyelected?
“YES”= 10(elected in4 cases) “NO” = 2 “N/A” = 4 ~ ;S Machining Are there team leaders in ASSEMBLY/lESTING? If yes, are they elected? ; ;- Subassembly 50 -
!,
“YES” = 12 (elected in 5 cases) “NO” = 2 ‘“N/A” = 2[d-qoL
Note: The decision to have team leaders elected (if any) depends on the ~ I engine plant. It is not a function of the department.m
20
10
0 30
Elect Elect Elect Elect Elect
Engine Plants
Chart 1.8
It isinteresting to observe, though, that these team leaders are only elected in about one third of the
cases. When team leaders are elected, they are elected no matter what part of the engine plant you consider. So, the decision about having work teams and electing team leaders depends on the engine plant, not on the departments within the plant.
Regarding the actual number of work teams existing in the various engine plants, these values are largely a function of the size and capacity of these facilities. For your information, we have plotted the raw data indicated to us by the engine plants. Do keep in mind, though, that the size of each work team can vary from one plant to another. We can conclude from Chart 1.8 and Chart 1.9 that there are almost always more work teams in machining than in other areas of engine plants like subassembly or assembly and testing. Some of this certainly has to do with the relative sizes of these departments.
100 90 80 70 60 50 40 30 20 10 0
Number Of Work Teams (cf. Table
In Engine Plants (By C.4 page 31)
Note: this (large) engine plants has 25~— teams in the machining departments
Dept.)
Machining Subassembly Assembly & Testing
Engine Plant Department
Chart 1.9
Training hours in engine plants
The average % values are given in a pie chart about training topics (cf. Chart 1. 10). The percentages correspond to the average of 14 plants’ respective distribution of time spent by topic.
Training Topics (% of Hours Spent: Average of 14 Plants) (cf. Table C.5 on Page 32 of Questionnaire)
others basic skills
7 % 5 % interpersonal skills o % machine effic 7% maint. scheduling 7 “/.. \ ient workplace design
2 % SPC fstat. orocess . \ assembly task F 10’? ~ machine adjustment o% ures Ition 3 -/0 7% Chart 1.10
The following table is included so that you can realize how much emphasis can be given to a certain training topic: listed below are the maximum % of training hours spent on each topic by a plant; note that it is only a percentage value. Besides, within a plant, one can imagine that the amount of training focused on one particular subject may change a lot from year to year.
lMaximum YO of training time spent on...
Basic skills: 440/o
lntc3p3130Md skills: 230/.
Assembly task procedures: 24% Machine operation: 19%
Machine adjustment: 407. Machine repair: 237. Use of info, systems: 15°/0
SPC (statistical process control): 20’70 Efficient workplace design: 120/. Machine maintenance scheduling: 31?4. Problem solving techniques: 20%
Safety: 40°/0 Others: 26”/.
For every topic (except for machine operation), there is always at least one plant telling that they spend none of their training hours on this topic. In other words, the minimum % of training
hours spent on any topic is 0% (except for machine operation, where it is 4%). Since there were many topics in the list, this is not surprising.
Chart 1.11 presents a much better picture of what is happening in terms of training in engine plants, because it indicates the actual number of hours of training an employee receives every year. For clarity purposes, we have divided the topics from the list into three major categories:
* “operations” correspond to tasks which are directly related to the production of engines along the machining and assembly lines (assembly task procedures, machine operations, machine adjustment, machine repair),
* “control” deals with topics which indirectly affect the manufacturing process (use of information systems, statistical process control, efficient workplace design, machine maintenance scheduling),
Number of Hours of Training per Year per Employee (cf. QC5, QC6 and Table C.5 on Page 32 of Questionnaire) 100 90 80 70 60 50 40 30 20 10 0 ,— EtWN4 EN4N4E N4 E E E E E
Engine Plants & Location (E = Europe, NA = North America)
E
Chart 1.11
The main findings from Chart 1.11 are the following:
* Among the 14 engine plants for which we have answers about training practices, the average time devoted to training is 41 hours per employee per year; this corresponds to a total of five days of work every year.
* The number of hours of training varies tremendously from plant to plant, ranging from 12 to 100 hours. Of course, these kinds of practices can very well change from one year to the next, so training should be a research subject which is investigated over a long period of time. * Those plants which spend the most time on training are based in Europe.
* Also, the way in which training hours are spent differs greatly from plant to plant, as shown by the relative importance of the three categories of training topics on the bars of the graph (“operations”, “control” and “others”).
* The training hours which employees get are always paid for by their company, except in one engine plant where most of the training hours are not paid.
Factors influencing quality
This relates to the answers in Table C.6 of the questionnaire. It is important to note that the respondents were asked to evaluate the relative importance which several factors had on the
workers, in order to obtain high quality engines.
lAnalysis Of Questionnaire (Part C): Table C.6 And Question QC7 (Pages 32-33) 1
I I
I
I
1 1 I -===s
I 1
Table C.6: Question asked: “In vour opinion, how important are the foliowinu to
J
the workers in helpinq them produce hiqh quality encrines ?‘
]FactorsInfluencing Quality
I I
Table 1.3
As shown by Table 1.3, for the people surveyed, those factors which are the most influential for workers to help them produce high quality engines are:
* inspecting one’s work * being well trained
* designing one’s workplace * having their suggestions accepted
Then, a second category of factors came up as being quite important too. They are: * team work
We got mixed feelings about unionization and its “impact” on quality. Do keep in mind that, except for one case, all the engine plants answering to these questions have a large proportion of unionized workers.
Regarding workplace design, a vast majority of respondents from the engine plants told that it is “veV impo~~t” or “important”that workers take part in “designing their workplace”. It is thus a
bit strange to see that in some of these same plants, the plant personnel is involved very late in the
sequence of events in engine and plant design (as indicated by the data from Table C. 17 which was
included in the presentation made in Paris in October of 1996). Maybe that some of this has to do
with the interpretation of the categories “taking part in designing the factory” and “taking part in
designing their workplace” for the effect on quality. Nevertheless, one of the numerous lessons
which came up from the study of lean production is that efficient use of work space can matter a lot
(for example by helping reduce the amount of time spent moving parts around).
Interestingly, according to our respondents, monetary incentives for workers which would be connected to the output, do not appear to have any expected payoff in terms of quality. Some reasons for this might be that:
1. Such methods have been experimented and they have not been too successful.
2. On an individual basis, one worker in a large plant has almost no impact on the overall output of engines.
Nevertheless, it would be interesting to have the opinion of the workers themselves about this issue !
There are factors which were not listed in the questionnaire and which some companies thought
had an important impact on quality; this is why we have indicated them at the bottom of the table of results under the category “others” (cf. Table 1.3).
Methods used by management to understand the needs and motivations
of workers
By going through the answers, it turns out that meetings with workers, and internal surveys
addressed to them, are common practice in automotive engine plants, in order for management to get an idea of what workers ‘ “feelings” are. These interactions appear to be organized more or less rigorously. Besides, workshops can also be a way of sharing information and requests, which is probably less formal than meetings and surveys. We can also note differences in the frequency at which those events are scheduled. For more details, refer to the list of methods on Table 1.3 about QC7.
Remark: one answer to question QC7 mentions a phoneline/hotline as a means of communication between management and workers. Very recently, Continental Airlines has been an example of a highly successful company turnaround. Among different ways to achieve a high level of employee motivation and participation in the success of their company, there are toll free phone numbers which anyone at Continental can call in order to send comments or suggestions, and in order to know the firm’s stock price or to get a weekly update from the CEO. Another practice learned during this transformation of the company and that was greatly emphasized by the CEO was that it is extremely wise to have people focus on a few key metrics of performance; the tough part is to determine which metrics to pick. It is known that people do pay attention to operating performance factors which are measured and tracked over time. One ought to keep in mind that, within large organizations like engine plants, all workers obviously do not react identically towards improvement, because they have a different opinion about the real benefits which the success of their firm can bring to them.
Suggestion policies, incentive programs, kind of information about
performance which is available to the workers
In all but one of the 15 plants for which we have answers, a formal suggestion program has been adopted, and performance is regularly evaluated (question QC8).
Answers to question QC9 show mixed results concerning outstanding work awards; however, in a vast majority of engine plants (12 out of 15), special recognition awards are in place as part of incentive programs for workers. Performance is evaluated on a regular basis in almost all plants.
GRAPH: Average Number Of Suggestions Per Worker Per Year
INFO: About Incentive Programs And Information Flows (cf. QC8, QC9 and QC1O on Page 33 of Questionnaire)
~
Answers to question QC8: “is there a formal ~ suggestion program in the engine plant?”: I . **y~s*~= 74
- “NO” = 1 - No answer = 1
■Rejected I
~QC9: Incentive programs in engine plants E!Acceptedl
—’- Formal suggestion program: 14 “YES” / 1 “NO” 1% - Outstanding work awards: 8 ‘“YES” I 7 “NO”
— - Special recognition awards: 12 “YES” / 3 “NO” - Regular performance evaluation: 14 “YES” / 1 “NO” —,
,= ~QC 10: /+0 w is information about quality and —i production disseminated among workers? ~
1-Posting of info for entire plant: 14 “YES” / 1 “NO”
—- Posting of info at each line, workstation: 15 “YES” / 1 “NO !
- Comrmterized trackin~ and displav for all: 7 “YES” / 8 “NO ~ m
m
Engine Plants
Chart 1.12
The average number of suggestions per worker made in a year ranges widely, from about O to as many as 12 suggestions. Actually, Chart 1.12 shows that there were three groups of engine plants, in terms of worker suggestion results:
1. For the vast majority of engine plants (more than two thirds of those which answered), the average number of suggestion per worker is less than 1.5 per year. The rate of acceptation ranges between one third and 10(Y70.
2. In two instances, workers make more than 10 suggestions per year, but in one case, very few are accepted while in the other case, almost all suggestions are accepted.
3. Two other engine plants yield answers where workers make, on average, between 2.5 and 5 suggestions per year. In these two plants, more than half of the suggestions are accepted.
Information about quality and production is systematically posted in the facilities, whether it is overall plant data, or information specific to a particular workstation or line within a department. However, less than ha~of the engine plants say that they have a computerized tracking and display system which can disseminate information about quality and production for all employees.
Is there some link between training and suggestion practices?
We have plotted on Chart 1.13 the number of suggestions versus the amount of training, in order to see if there is any correlation between these two factors (we skipped two data points where the average number of suggestions per employee per year is very high compared to the rest of the dataset). Statistically, we are confident that more suggestions goon a par with a greater amount of training received. In other words, results from our sample suggest that, in general, the more training hours employees get, the more suggestions they make. An explanation for this could be that in plants where more training takes place, the employees feel that their company cares more for them, and their awareness translates into a desire to improve operations, e.g. through the use of suggestion programs.
Possible Link Between Training And Suggestion Policies? (cf. QC5 on Page 32 and QC8 on Page 33 of Questionnaire)
4,5 4,0 ~ 2.0 0.5 0.0 , 9 I
~’l;
,
—: 2 data points are skipped i 4
1 I I w / ● ’ ! ( / ● I ● I I ! 10 , ~’ 0 10 20 30 40 50 60 70 80 90 100
Hours of Training per Enployee per Year
2. Logistics
This section deals with some aspects of logistics from Part C of the Engine Plant Study questionnaire which have not been communicated yet, such as transit times and lead times between engine plants, their suppliers, and the vehicle assembly plants. Inventory and work-in-progress data had been presented at earlier occasions such as meetings with IMVP sponsors.
Fractjon of parts deljvered more often than once per shjft
Fraction of parts which are delivered to the machining department more than once per shift:
average from our data = 39% (min. = O%, max. = 90%). This mean value is way higher than for parts delivered to the assembly department. Some obvious reasons are that castings which will be machined constitute bulky, heavy, and rather expensive parts, so they ought not to be stored too long inside engine plants; thus, they tend to be delivered at a quite frequent pace. We wondered if there is any kind of difference between engine plants operated by Japanese companies and those from Western firms (European and North American automakers), but Chart 2.1 suggests there is no differentiation in the results, unlike what follows in the paragraph about parts delivered to the assembly department.
Percentage Of Parts Delivered To The MACHINING Departments Of Engine Plants More Than Once Per Shift
(cf. Table C.8 on Page 34 of Questionnaire)
100% – 1 gt)~o 80% 70% 60% 50~o 40% 30% 2o% 1o% two
U70 Oun European or North American Companie
.— (13 answers) 7“0/ “.-( I I 5% ~ II
u
o% o% —o% o% IEngine Plaf’tkl (sorted by descending order within “regions”)
Chart 2.1
Fraction of parts which are delivered to the assembly department more than once per shift: average for the Japanese-owned engine plants which answered = 77%, while for all the others, it is only 3YO of parts, on average (min. = 09?0,max. = 10?ZO)!This is a huge difference between
Japanese firms and western
firms, in terms of delivery policy for those parts which aredelivered more often than once per shift to the assembly department of engine plants. Even though we have few data points from Japanese companies, the striking contrast had to be pointed out. The data are plotted on Chart 2.2.
Percentage Of Parts Delivered To The ASSEMBLY Department Of Engine Plants More Than Once Per Shift
(cf. Table C.8 on Page 34 of Questionnaire)
100% 1 90yo 80?!0 70~o 60% 50~o 4070 30~o 20?40 10% o% 89 %_F— Japanese \— Companies – (2 answers, irrc/. a U, S. transplant) I --”, >
-1
1
~.~( European or North American Companies
(13 answers)
5% 5% 5% 5%
3% 3%
ES! m o% o% o% o% o% o%
1
Engine plantS (sorted by descending order within “regions”)
Chart 2.2
With Chart 2.3 and Chart 2.4, we want to see if a company which delivers a higher fraction of parts more often than once per shift to the machining departments of an engine plant also does so for the assembly department? Our survey suggests that it is not the case: even after removing the two data points from Japanese firms (cf. Chart 2.4), statistical analysis does not yield a strong correlation at all. It might be that a there is no such thing as a uniform delivery policy for parts delivered to the machining and assembly departments of engine plants, because these are two very different types of components in terms of weight, packaging, price, batch size, etc...
100% 90% 80% 70% 60% 50% 40% 30% 20% 1o% vi!.
Percentage Of Parts Delivered More Often Than Once Per Shift To Automotive Engine Plants
(cf. Table C.8 on Page 34 of Questionnaire)
I I // Japanese ‘+ .~ Companies ~ i (2 answers, incl. ! I I 1! I I o% 1070 20% 3070 4070 50% 60% 70~o 80V0 90~o 100% (Machining Departments) Chart 2.3
Percentage Of Parts Delivered More Often Than Once Per Shift To Automotive Engine Plants: WESTERN FIRMS
(cf. Table C.8 on Page 34 of Questionnaire) — I I I , t I , I I [ I *m~ I * ■ I m
0% 10% 20% 30% 40~o 50~o 60% 7070 80% 90~o 10070
(Machining Departments)
Chart 2.4
Transit time to the nearest and farthest suppliers of engine parts
The transit time data presented in the charts are separated in two categories: on the one side, components like castings which are delivered to the machining departments of engine plants, and on the other side, parts which are needed in the assembly department.
In the questionnaire, a distinction is made between those suppliers which deliver more often than once per shift to the engine plant, and the others. The answers comprise 18 families of engines. Let us consider the suppliers which deliver more than once per shift to the engine plants. It is interesting to note that these suppliers “exist” in only 8 cases when it comes to delivering parts to the assembly department, while there are 10 engine families for which suppliers deliver more than once per shift to the machining department. Parts like castings which are delivered to the machining departments can be quite bulky and expensive compared to components which are delivered to the assembly department of engine plants, so it makes a lot of sense to put more emphasis on just-in-time delivery methods for the parts delivered to the machining department. Because they are bulky,