HAL Id: hal-03138406
https://hal.sorbonne-universite.fr/hal-03138406
Submitted on 11 Feb 2021HAL is a multi-disciplinary open access archive for the deposit and dissemination of sci-entific research documents, whether they are pub-lished or not. The documents may come from teaching and research institutions in France or
L’archive ouverte pluridisciplinaire HAL, est destinée au dépôt et à la diffusion de documents scientifiques de niveau recherche, publiés ou non, émanant des établissements d’enseignement et de recherche français ou étrangers, des laboratoires
Regulation of ALT-associated homology-directed repair
by polyADP-ribosylation
Song My Hoang, Nicole Kaminski, Ragini Bhargava, Jonathan
Barroso-González, Michelle Lynskey, Laura García-Expósito, Justin Roncaioli,
Anne Wondisford, Callen Wallace, Simon Watkins, et al.
To cite this version:
Song My Hoang, Nicole Kaminski, Ragini Bhargava, Jonathan Barroso-González, Michelle Lynskey, et al.. Regulation of ALT-associated homology-directed repair by polyADP-ribosylation. Nature Struc-tural and Molecular Biology, Nature Publishing Group, 2020, 27 (12), pp.1152-1164. �10.1038/s41594-020-0512-7�. �hal-03138406�
Regulation of ALT-associated homology-directed repair by
polyADP-ribosylation
Song My Hoang1, Nicole Kaminski1, Ragini Bhargava1, Jonathan Barroso-González1, Michelle L. Lynskey1, Laura García-Expósito1, Justin L. Roncaioli1, Anne R. Wondisford1, Callen T. Wallace2, Simon C. Watkins2, Dominic I. James3, Ian D. Waddell3, Donald Ogilvie3, Kate M. Smith3, Felipe da Veiga Leprevost4, Dattatreya Mellacharevu4, Alexey I.
Nesvizhskii4,5, Jianfeng Li6, Dominique Ray-Gallet7, Robert W. Sobol6, Genevieve Almouzni7, Roderick J. O’Sullivan1,✉
1Department of Pharmacology and Chemical Biology, UPMC Hillman Cancer Center, University of
Pittsburgh, Pittsburgh, PA, USA
2Department of Cell Biology, UPMC Hillman Cancer Center, University of Pittsburgh, Pittsburgh,
PA, USA
3Drug Discovery Unit, Cancer Research UK Manchester Institute, The University of Manchester,
Manchester, Macclesfield, UK
4Department of Pathology, University of Michigan, Ann Arbor, MI, USA
5Department of Computational Medicine and Bioinformatics, University of Michigan, Ann Arbor,
MI, USA
Reprints and permissions information is available at www.nature.com/reprints.
✉Correspondence and requests for materials should be addressed to R.J.O. osullivanr@upmc.edu.
Author contributions
R.J.O. conceived and designed the study; S.M.H. designed and conducted all experimentation; R.J.O. and S.M.H analyzed the data. N.K., R.B., M.L.L., J.L.R., J.B.G., L.G.-E., A.R.W. and R.J.O. assisted with experimentation and analyzed data. C.T.W. and S.C.W. assisted with optical-imaging experiment design, optimization and analyzes. D.I.J., I.D.W., K.M.S. and D.O. produced, validated and provided the PARG inhibitors. F.V.L., D.M. and A.I.N. generated and analyzed proteomic data. J.L. and R.W.S. provided essential reagents. D.R.-G. and G.A. provided essential reagents, assisted with experimental design and interpretation of results. S.M.H. and R.J.O. wrote the manuscript with input from coauthors.
Online content
Any methods, additional references, Nature Research reporting summaries, source data, extended data, supplementary information, acknowledgements, peer review information; details of author contributions and competing interests; and statements of data and code availability are available at https://doi.org/10.1038/s41594-020-0512-7.
Reporting Summary. Further information on experimental design is available in the Nature Research Reporting Summary linked to
this article. Data availability
Original immunofluorescence and colony-formation images are separately available in the Figshare data depository (https:// figshare.com/s/17f00c7faa765b329c22). Proteomics data has been deposited at ProteomeXchange Consortium via the PRIDE partner repository with the dataset identifier PXD020243. Source data are provided with this paper.
Competing interests
The authors declare no competing interests.
Extended data is available for this paper at https://doi.org/10.1038/s41594-020-0512-7.
Supplementary information is available for this paper at https://doi.org/10.1038/s41594-020-0512-7.
HHS Public Access
Author manuscript
Nat Struct Mol Biol
. Author manuscript; available in PMC 2021 January 15. Published in final edited form as:Nat Struct Mol Biol. 2020 December ; 27(12): 1152–1164. doi:10.1038/s41594-020-0512-7.
A
uthor Man
uscr
ipt
A
uthor Man
uscr
ipt
A
uthor Man
uscr
ipt
A
uthor Man
uscr
ipt
6Department of Pharmacology and the Mitchell Cancer Institute, University of South Alabama,
Mobile, AL, USA
7Institut Curie, PSL Research University, CNRS, Sorbonne Université, Nuclear Dynamics Unit,
Equipe Labellisée, Ligue contre le Cancer, Paris, France
Abstract
The synthesis of poly(ADP-ribose) (PAR) reconfigures the local chromatin environment and recruits DNA-repair complexes to damaged chromatin. PAR degradation by poly(ADP-ribose) glycohydrolase (PARG) is essential for progression and completion of DNA repair. Here, we show that inhibition of PARG disrupts homology-directed repair (HDR) mechanisms that underpin alternative lengthening of telomeres (ALT). Proteomic analyses uncover a new role for poly(ADP-ribosyl)ation (PARylation) in regulating the chromatin-assembly factor HIRA in ALT cancer cells. We show that HIRA is enriched at telomeres during the G2 phase and is required for histone H3.3 deposition and telomere DNA synthesis. Depletion of HIRA elicits systemic death of ALT cancer cells that is mitigated by re-expression of ATRX, a protein that is frequently inactivated in ALT tumors. We propose that PARylation enables HIRA to fulfill its essential role in the adaptive response to ATRX deficiency that pervades ALT cancers.
PARylation is an apical part of the DNA damage response (DDR)1. Poly(ADP-ribose) polymerases (PARPs) bind to exposed DNA ends and consume cellular nicotinamide adenine dinucleotide (NAD+) to undergo auto-ADP-ribosylation and modify additional protein targets1. The degradation of PAR chains is primarily mediated by PARG2 and salvages NAD+that is recycled to generate essential metabolites, including ATP.
Unhydrolyzed PAR sequesters cellular NAD+, leading to catastrophic energy failure3. PARG also maintains efficient replication by removing PAR that is synthesized by PARP1 between unligated Okazaki fragments4 and stabilizing stalled and regressed replication forks5. Thus, PARG is critical to sustain cellular energy supplies and to support stepwise transitions during DNA repair and replication.
Telomeres are natural substrates for PARP activity. Indeed, PARP1, PARP2 and tankyrase are constitutively present at telomeres6. TRF1 and TRF2, both core constituents of the shelterin complex, shield telomeres from unwarranted PARP activity7. Upon telomere dysfunction, PARP1 can promote telomere fusions by alternative end-joining (alt-EJ) when canonical end-joining is suppressed8. In contrast, double-strand breaks (DSBs) within telomeric repeats are most frequently repaired by PARP1-dependent alt-EJ9. ALT is a HDR-based telomere-elongation mechanism involving RAD51-dependent homologous
recombination (HR)10 and de novo synthesis of telomere DNA11. The latter, termed break-induced telomere DNA synthesis (BITS), is active in the G2/M cell-cycle phases and resembles break-induced replication (BIR)11,12. Here, one-ended DNA lesions stimulate the RAD52-dependent assembly of PCNA, RFC1-5 and DNA polymerase δ to extend
telomeres11.
Here, we demonstrate that inhibition of PARP1 or PARG elicits pro- or antirecombinogenic phenotypes at telomeres in ALT cells, respectively. Proteomic approaches reveal a network of PAR-regulated proteins at telomeric DSBs that are repaired by ALT-associated HDR and
A
uthor Man
uscr
ipt
A
uthor Man
uscr
ipt
A
uthor Man
uscr
ipt
A
uthor Man
uscr
ipt
uncover a role for PARylation in regulating HIRA-dependent chromatin-assembly complex at ALT telomeres. We show that PAR enables localization of HIRA to telomeres during the G2 phase to mediate histone H3.3 deposition and HDR. Loss of the functional ATRX (alpha-thalassemia/mental retardation, X-linked)–DAXX (also known as death domain associated protein) chromatin-remodeling and histone-deposition complex in ALT cells renders HIRA (histone regulator A) the sole histone-H3.3-specific chaperone available to manage telomeric chromatin. We further show that HIRA presents a synthetic lethal vulnerability in ATRX-deficient ALT cells. On the basis of these observations, we propose that PARylation has a critical role in regulating HIRA function in the adaptive response to loss of ATRX, and enables non-canonical HDR mechanisms that mediate telomere elongation specifically in ALT cancer cells.
Results
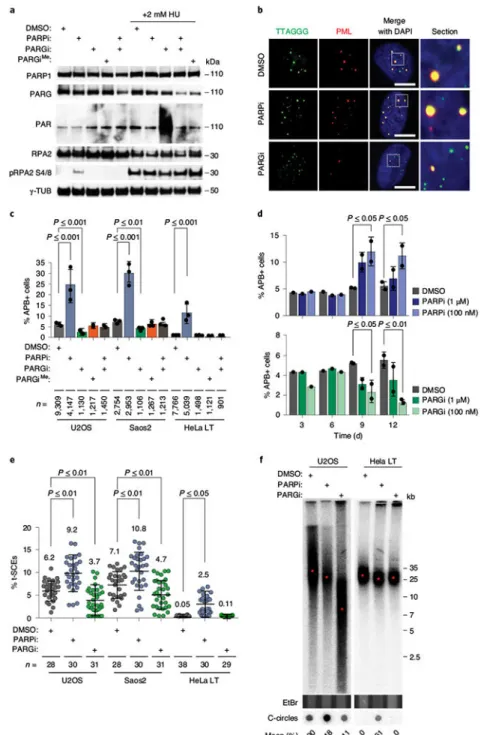
Perturbation of PAR metabolism alters recombinogenic activity at ALT telomeres. We sought to examine how PAR metabolism contributes to ALT telomere-length maintenance by pharmacological inhibition of PARP1 and PARP2 (PARP1/2) using the PARP inhibitor olaparib (from here on called PARPi), and of PARG with the PARG inhibitor PDD00017272 (PARGi)13. A characteristic PAR smear was observed in western blots upon the addition of PARGi to hydroxyurea (HU)-treated U2OS cells, but not with an
N-methylated inactive analog (PARGiMe)13 or when PARGi and PARPi were combined (Fig. 1a). ALT-positive (ALT+) cancer cells contain a subset of telomeres that localize to promyelocytic leukemia protein (PML) bodies, forming ALT-associated PML bodies (APBs)14. Quantification of APBs by immunofluorescence combined with fluorescence in situ hybridization (IF-FISH) is routinely used to measure ALT activity. While PARPi treatment (72 h, 5 μM) increased the frequency of APBs, PARGi addition (72 h, 5 μM) substantially decreased APB levels in U2OS and Saos2 cells (Fig. 1b,c). The inactive PARGiMe analog had no effect, and the combination of PARGi and PARPi mitigated the altered APB levels induced by the individual inhibitors (Fig. 1c). Prolonged treatment of U2OS cells with lower doses of PARPi (100 nM) or PARGi (100 nM) produced similar results (Fig. 1d). Moreover, depletion of PARP1 and PARG proteins in U2OS, Saos2 and HeLa LT reproduced changes in APB levels similar to those that followed treatment with the inhibitors (Extended Data Fig. 1a–c). Importantly, the changes to APBs due to PARP1 or PARG depletion were reversed with PARGi or PARPi treatment, respectively (Extended Data Fig. 1c), showing that the effects of the inhibitors on APBs were due to deregulated PARP1 and PARG activity.
Chromosome orientation FISH (COFISH) revealed that PARGi substantially reduced the frequency of telomere-sister chromatid exchanges (t-SCEs), which are markers of telomere recombination15 in U2OS and Saos2 ALT+ cells. In contrast, PARPi elevated t-SCEs in not only ALT+ cells, but also HeLa LT cells, where telomere recombination is normally restrained (Fig. 1e). The same trend was evident in PARP1-depleted cell lines (Extended Data Fig. 1d). The induction of APBs and t-SCEs with PARPi was reminiscent of prior reports that replicative stress provoked ALT phenotypes in human and mouse cells that do not rely on ALT telomere elongation9,16. This PARPi-induced increase in t-SCEs was
A
uthor Man
uscr
ipt
A
uthor Man
uscr
ipt
A
uthor Man
uscr
ipt
A
uthor Man
uscr
ipt
partially suppressed by depletion of RECQ1, a factor implicated in restarting regressed replication forks that is known to be regulated by PARP1 activity17 (Extended Data Fig. 1e). To exclude the possibility that the effects of PARG inhibition were due to altered cellular bioenergetics, we confirmed that a 12-d dose of 1 μM PARGi did not alter cell-cycle progression of either ALT+ U2OS or telomerase-expressing (TEL+) HeLa LT cells (Extended Data Fig. 1f). While treatment with 100 nM PARPi increased the proportion of cells in the S phase in each of these cell lines by ~15%, this result is in line with the
established role of PARP1 in controlling the progression, protection and restart of replication forks5,17. Furthermore, we found that at these doses and durations of PARGi treatment, the cellular ADP:ATP ratios in U2OS and HeLa LT cells were unchanged (Extended Data Fig. 1g). This indicated that the changes in ALT activity by PARPi and PARGi were specifically induced by pharmacological alterations in the metabolism of PAR, rather than other possible pleiotropic cellular effects.
The robust opposing effects of PARPi and PARGi that we observed raised the possibility that telomere length might be altered by chronic inhibition of PARP1 or PARG in ALT+ cells. We therefore treated ALT + U2OS and TEL+ HeLa LT cells with 100 nM PARPi or 1 μM PARGi for 20 d before analyzing telomere length by pulsed field gel electrophoresis (PFGE). PARPi did not overtly affect telomere length, in agreement with previous studies9. In contrast, PARGi clearly affected telomere length in ALT+ U2OS and VA13 cells, but not in TEL+ HeLa LT cells (Fig. 1f and Extended Data Fig. 1h). We found that PARPi increased the levels of ALT-associated extra-chromosomal single-stranded telomere DNA C-circles in U2OS cells and provoked their de novo formation in HeLa LT cells (Fig. 1f). In contrast, PARGi did not change C-circle levels in ALT+ cells, implying that the changes in telomere length were due to telomere shortening and not to accumulation of smaller
extra-chromosomal telomeric DNAs. Lastly, clonogenic survival assays revealed that ALT+ (U2OS, Saos2) and TEL+ (HOS, SJSA1) cell lines, as well as the matched ALT+LM216J and TEL+ LM216T cell lines, were equally sensitive to PARPi. This is likely owing to the multiple roles of PARP1 in DNA replication. However, ALT+ cell lines were slightly more sensitive to PARGi (Extended Data Fig. 1i). Interestingly, the proliferative defects due to PARPi and PARGi were partially rescued in U2OS cells by re-expression of ATRX (U2OSATRX), which has previously been shown to mitigate telomeric replicative stress18 (Extended Data Fig. 1j). Together, these findings demonstrate that the coordinated synthesis and removal of PAR dictates the recombinogenic potential of telomeres that sustains telomere-length homeostasis in ALT cancer cells.
PAR metabolism sustains key steps of the ALT mechanism.
To determine how perturbing PAR metabolism directly impacts ALT-associated HDR, we used the established TRF1–FokI experimental system, in which wild-type (WT) TRF1–FokI, but not the catalytically dead (DA) TRF1–FokI, cleaves telomeric DNA to stimulate HR and telomere DNA synthesis11,19. This allowed us to examine the effects of PARPi and PARGi within a 4-h window while avoiding potential cell-cycle or metabolic perturbations (Extended Data Fig. 2a). Upon induction of WT TRF–FokI, elevated PAR was detected in extracts prepared from PARGi-treated WT TRF1–FokI cells (Fig. 2a). As previously reported11, WT TRF1–FokI induced phosphorylation of histone H2AX and CHK2 in U2OS
A
uthor Man
uscr
ipt
A
uthor Man
uscr
ipt
A
uthor Man
uscr
ipt
A
uthor Man
uscr
ipt
cells (Fig. 2a). PARPi, but not PARGi, enhanced these DDR markers in WT TRF1–FokI cells and stimulated DDR signaling in DA TRF1–FokI (Fig. 2a). Notably, PAR was visible at telomeres through IF-FISH in WT TRF1–FokI cells treated with PARGi (Fig. 2b,c), and this localized enrichment was abolished upon combined PARGi and PARPi treatment but not following knockdown of tankyrase-1 in PARGi-treated cells, confirming dependency on PARP1 (Extended Data Fig. 2b). Green fluorescent protein (GFP)–PARP1 and GFP–PARG were also present at WT TRF1–FokI DSBs (Extended Data Fig. 2c,d). The localization of GFP–PARP1 was slightly reduced upon PARG inhibition (Extended Data Fig. 2c), consistent with the proposal that auto-modification dissociates PARP1 from chromatin1. Localization of GFP-PARG required both its PCNA interaction peptides (PIPs) and PARP1 activity, in agreement with previous studies20,21 (Extended Data Fig. 2d). Thus, PARP1 mediated PARylation and its hydrolysis by PARG directly respond to DSB formation at ALT telomeres.
Telomeric HR can be visualized as clusters of telomeres into larger foci11,19. This is reflected in IF assays as an increased size and reduced number of telomeres. Such a pattern of telomere clustering was observed in DMSO-treated WT-TRF1–FokI-induced cells (Fig. 2d). Clustering events in WT TRF1–FokI cells were largely unaffected by PARPi, even though PARPi induced telomere clustering in DA TRF1–FokI cells (Fig. 2d). Strikingly, when PARGi was added to WT TRF1–FokI cells, the number and size of individual telomeres remained close to levels observed in DA TRF1–FokI cells (Fig. 2d). The same pattern was observed in PARGi-treated VA13 ALT+ cells, but not in HeLa LT TEL+ cells (Extended Data Fig. 2e). Unlike normal and telomerase-positive cells, telomeres in ALT+ cells display motion that is consistent with homology search and pairing that takes place during HR19. We visualized, tracked and quantified the motion of enhanced GFP (eGFP)– TRF1 (a surrogate for telomeres) over 2 h in DMSO-, PARPi- and PARGi-treated U2OS cells (Extended Data Fig. 2f and Supplementary Videos 1–3). PARPi substantially increased the average cumulative mean squared displacement (MSD) of telomeres from ~8 μm to ~12.5 μm (Extended Data Fig. 2f and Supplementary Videos 1 and 2). In contrast, telomere motion was clearly constrained, exhibiting a MSD of ~6.9 μm by PARGi (Extended Data Fig. 2f and Supplementary Video 3). These experiments independently show that
PARylation influences the long-range mobility that impacts intertelomeric associations that are intrinsic to successful HDR.
PARG inhibition impairs HDR-associated telomere DNA synthesis at ALT telomeres. In addition to HR, ALT relies on synthesis of telomeric DNA from replication-fork intermediates or DNA breaks11. The latter can be stimulated from WT TRF1–FokI DSBs and quantified by bromodeoxyuridine (BrdU) immunoprecipitation (IP) and telomere Southern-blot detection11. Nascent telomere DNA synthesis was unaltered by PARPi, but was decreased by ~60% by PARGi treatment (Fig. 2e). Using a modified DNA-combing technique, we observed individually labeled chlorodeoxyuridine (CldU) and
iododeoxyuridine (IdU) telomere DNA fibers in DMSO-treated WT TRF1–FokI cells averaging 9.224 μm in length, from which a mean DNA-synthesis rate of 0.9 kilobases (kb) per min in DMSO-treated cells was calculated (Fig. 2f). Fibers from PARPi- and PARGi-treated cells averaged 11.13 μm and 7.228 μm in length, with average rates of DNA
A
uthor Man
uscr
ipt
A
uthor Man
uscr
ipt
A
uthor Man
uscr
ipt
A
uthor Man
uscr
ipt
synthesis of 1.1 kb min−1 and 0.7 kb min−1, respectively (Fig. 2f). We next determined the progression of DNA synthesis between pulses by comparing the relative IdU- and CldU-tract lengths. While those from DMSO-treated cells were nearly equivalent (Pearson coefficient r2 = 0.9524), those from PARPi (r2 = 0.4673)- and PARGi (r2 = 0.6451)-treated cells differed substantially, irrespective of the large differences in overall track length (Fig. 2g). Tract length and velocity were unaltered by the combined treatment with PARGi and PARPi (r2 = 0.9894) (Fig. 2g). Near-identical PARPi- and PARGi-induced changes to tract length, synthesis rates and colinearity of CldU–IdU fibers were observed in fibers prepared from WT TRF1–FokI cells that were synchronized with RO-3306 in the G2 phase (Extended Data Fig. 2g–h). To corroborate these effects in other ALT cell lines, an alternative assay in which BrdU incorporation at TRF1–FokI DSBs in G2-synchronized cells was used to determine levels of BITS11,22 (Extended Data Fig. 2i). This confirmed the outcomes of BrdU IP and DNA-fiber analysis in U2OS TRF1–FokI cells. PARPi modestly but consistently increased the relative percentage of BrdU-positive G2-arrested U2OS, LM216 and VA13 cells (Extended Data Fig. 2i). In contrast, PARGi diminished BrdU incorporation at telomeres in each of the cell lines tested (Extended Data Fig. 2i). These data provided evidence that skewing the equilibrium of PAR synthesis and hydrolysis perturbs telomere break-induced DNA synthesis, potentially by displacement of mediators of telomere DNA synthesis, as previously described23. Indeed, we found that accumulation of PCNA and POLD3 at WT-TRF1–FokI-induced DSBs was diminished with PARGi treatment (Extended Data Fig. 2j,k). While their localization was unaltered by PARPi alone, the combination of PARPi with PARGi was sufficient to restore PCNA and POLD3 localization to normal levels (Extended Data Fig. 2j,k). It appears that fine-tuned control of PAR catabolism by PARG maintains efficient HDR at ALT telomeres, implicating PAR-dependent processes in regulating ALT telomere HR and BITS.
Telomeric protein targets of PARylation.
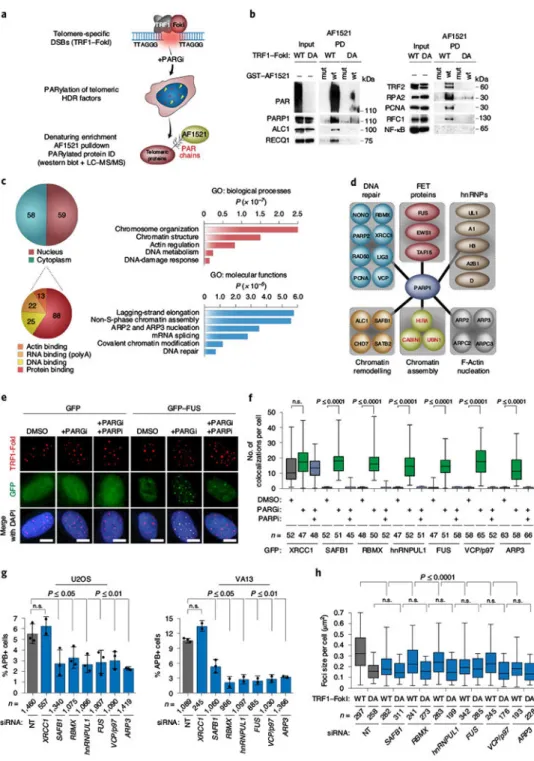
PARylation has wide-ranging effects on the DDR1. Proteomic strategies to define the relevant protein factors include non-denaturing enrichment and immunoprecipitation of PAR-binding proteins24,25, and denaturing enrichment to detect covalently PARylated proteins by affinity capture with the PAR-binding macrodomain, AF1521 (ref. 26). Af1521 recognizes both mono-ADP-Ribose and the terminal ADP-Ribose of PAR chains with nanomolar affinity27. Additional specificity is provided by a mutant AF1521 (AF1521-G42E) that cannot bind PAR. We employed AF1521 affinity capture to determine the PARylome induced by WT TRF1–FokI in U2OS cells. PARGi was added to cells to preserve PAR on modified target proteins. (Fig. 3a). PAR was detected in pulldowns from PARGi-treated WT TRF1–FokI U2OS cells using WT AF1521 but not AF1521-G42E. PARP1, ALC1 (ref. 28), RECQ117 and TRF2 (ref. 29) proteins, known to be regulated by PARP1, were enriched in the WT AF1521 samples. In addition, HDR factors RPA2, PCNA and the RFC1–RFC5 complex subunits that were identified in previous PARylation proteomics studies20,25,26 were also present. The p65 subunit of NF-κB that is not PARylated was used as a negative control26 (Fig. 3b). With these optimizations, we were confident in undertaking proteomic identification of the telomere-associated PARylome induced by TRF1–FokI DSBs.
A
uthor Man
uscr
ipt
A
uthor Man
uscr
ipt
A
uthor Man
uscr
ipt
A
uthor Man
uscr
ipt
Proteomic interrogation of the ALT-associated PARylome.
Samples from WT AF1521 and AF1521-G42E assays using WT and DA TRF1–FokI U2OS cells were subjected to liquid chromatography–mass spectrometry (LC–MS), as described in the Methods. The final dataset consisted of 117 proteins (Supplementary Table 1).
Functional annotation in DAVID revealed an equal representation of nuclear (59/117) and cytoplasmic proteins (58/117) (Fig. 3c) that included protein-binding (88/117), DNA-binding (25/117), polyA-RNA-DNA-binding (22/117) and several actin-DNA-binding (13/117) proteins (Fig. 3c). Gene ontology (GO) classification indicated that the protein hits were associated with chromatin structure modification, lagging-strand replication, DNA and RNA
metabolism and DNA repair, including PARP1’s obligate partner XRCC1 (ref. 30) and DNA ligase III (Fig. 3c) Chromatin regulators, ALC1 (ref. 28), SAFB1 (ref. 31) and VCP/p97 (ref.
32) mediate relaxation of DSB vicinal chromatin (Fig. 3d and Extended Data Fig. 3a).
Heterogeneous nuclear RNA-binding proteins hnRNPA1 (refs. 33,34), hnRNPUL1 (ref. 35) and RBMX36 have been linked with telomere integrity and DNA repair by HDR (Fig. 3d and Extended Data Fig. 3a). Other RNA-binding proteins included the FET (FUS; fused in liposarcoma/EWS; Ewing sarcoma/TAF15; TATA-box binding protein associated factor 15) proteins that establish sub-cellular DNA-repair compartments via liquid-phase
separation37,38 (Fig. 3d and Extended Data Fig. 3a). Intriguingly, factors involved in nuclear actin-dependent clustering of DSBs during HDR39, that is actin-related proteins 2 and 3 (ARP2 and ARP3), and ARP2/3 complex subunits 2 and 3 (ARPC2 and ARPC3), were also enriched (Fig. 3d and Extended Data Fig. 3a).
We examined whether any candidate factors localize to TRF1–FokI-induced DSBs in U2OS cells treated with PARGi alone or in combination with PARPi (Fig. 3e,f and Extended Data Fig. 3b). Like PARP1, eGFP-tagged XRCC1 was present at TRF1–FokI DSBs irrespective of inhibitor treatment. In contrast, no eGFP-tagged SAFB1, RBMX, hnRNPUL1, FUS, VCP/p97 or ARP3 localized to WT-TRF1–FokI-induced DSBs (Fig. 3e,f and Extended Data Fig. 3c). However, when treated with PARGi, these proteins accumulated at TRF1–FokI foci (Fig. 3e,f and Extended Data Fig. 3c). This pattern was abolished upon combined PARGi– PARPi treatment, highlighting the requirement for PAR in mediating their association with damage sites. AF1521 proteomics was validated by immunoprecipitation of eGFP-tagged RBMX, FUS and ARP3 from induced WT TRF1–FokI cells and PAR immunoblotting (Extended Data Fig. 3d). Strikingly, with the exception of XRCC1, depletion of SAFB1, RBMX, hnRNPUL1, VCP/p97, FUS and ARP2-3 reduced APBs by ≥50% in U2OS and VA13 cells, without altering the cell cycle (Fig. 3g and Extended Data Fig. 3e,f). Furthermore, their depletion impaired WT-TRF1–FokI-induced telomere clustering, with telomere sizes approximating those of DA TRF1–FokI cells (Fig. 3h). This demonstrated the capacity of the AF1521 proteomics strategy to identify functionally diverse regulators of ALT whose activities rely on the timely and efficient metabolism of PAR.
Regulation of chromatin and telomere HDR by the HIRA histone H3.3 chaperone complex. It was notable that the HIRA complex (composed of histone regulator A (HIRA),
calcineurin-binding protein 1 (CABIN1) and ubinuclein 1 (UBN1)) was identified in the AF1521 proteomic assays (Supplementary Table 1). HIRA mediates DNA-replication-independent assembly of histone-H 3.3-containing nucleosomes at promoters and
A
uthor Man
uscr
ipt
A
uthor Man
uscr
ipt
A
uthor Man
uscr
ipt
A
uthor Man
uscr
ipt
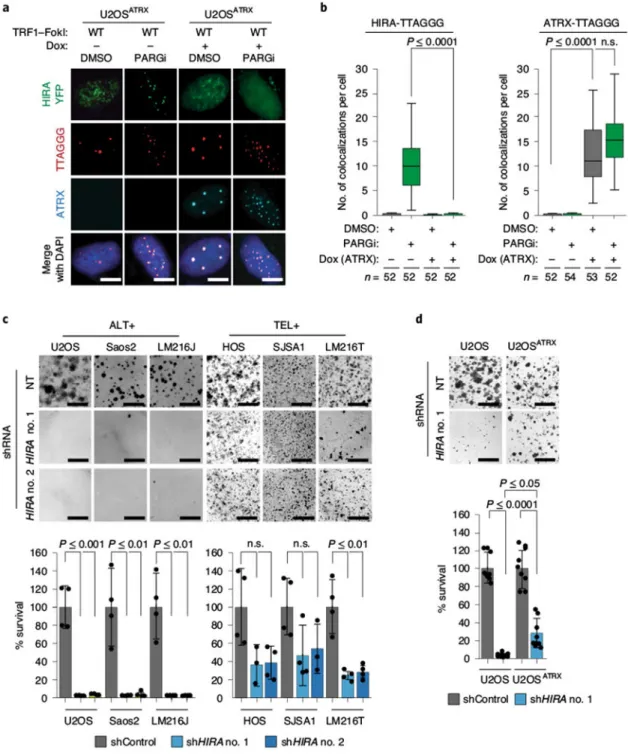
genes40–42, while moonlighting in nucleotide-excision repair43. Deposition of histone H3.3 is essential for telomere integrity and relies on the ATRX–DAXX chromatin-remodeling complex41,44, which is also linked to histone deposition during HDR45. As missense mutations or epigenetic silencing of ATRX and DAXX are frequent in ALT+ cancers46,47, it seemed likely that HIRA could contribute to HDR-associated activities at ALT telomeres. While localization of HIRA–yellow fluorescent protein (YFP) to telomeres was not readily apparent in asynchronous U2OS cells (Fig. 4a), HIRA–YFP was readily observed at telomeres in WT-TRF1–FokI-expressing G2-synchronized cells (Fig. 4a,b). Telomeric localization of HIRA–YFP was accentuated by addition of PARGi and diminished by PARPi (Fig. 4a,b). We also observed PAR-dependent accumulation of HIRA–YFP at telomeres in G2-synchronized ALT+ VA13 and LM216J cells, but not in TEL+ HOS or LM216T cell lines (Extended Data Fig. 4a). Thus, HIRA–YFP appeared to be specifically directed to telomeres in ALT cancer cells during the G2 phase of the cell cycle in a PAR-dependent manner (Fig. 4a,b). In agreement with prior findings, HIRA–YFP formed foci in U2OS cells shortly after irradiation with ultraviolet-C43 but was less prominent after ionizing radiation (γIR) (Extended Data Fig. 4b). In contrast to previous reports that RPA is necessary for HIRA localization to genes48, we found that PAR-dependent localization of HIRA–YFP at telomeres was unaffected by depletion of RPA1 (Extended Data Fig. 4c). Thus, the PAR-dependent mechanism of localization of HIRA to telomeres during G2 in ALT cells is distinct from its recruitment through RPA, which guides HIRA to gene bodies.
We next assessed whether HIRA contributes to ALT activity and HDR. Knockdown of HIRA reduces CABIN1 and UBN1 protein levels49 (Extended Data Fig. 4d). Depletion of HIRA, CABIN1 or UBN1 significantly reduced APB levels (Fig. 4c) and diminished WT-TRF1–FokI-induced telomere clustering in both U2OS and VA13 cells (Fig. 4c). Moreover, t-SCEs were reduced by ~70%, and the frequency of signal-free ends (that is, chromatids without detectable telomere FISH signals) doubled (2.5% to 4.1%) (Fig. 4d). C-circle levels were unaltered by HIRA depletion (data not shown). However, BrdU IP with induced WT-TRF1–FokI cells revealed that HIRA depletion reduced nascent telomere DNA synthesis by 60% (Fig. 4e). Similarly, telomere DNA fibers from HIRA-depleted WT-TRF1–FokI cells were substantially shorter than those of controls (8.695 μM (NT) versus 5.805μM (HIRA siRNA)) and exhibited altered progression, as inferred from the unequal labeling of CldU and IdU tracts (Pearson coefficient r2, NT = 0.9887 versus HIRA = 0.7196, n ≥ 25) (Fig. 4f). BrdU incorporation at telomeres was also impaired by HIRA knockdown in VA13 and LM216J ALT+ cell lines (Extended Data Fig. 4e). These results showed that HIRA has a key role in sustaining telomeric HDR in ALT cancer cell lines. To determine whether this was due to impaired chromatin assembly, we examined U2OS cells stably expressing SNAP-tagged histone H3.3, to visualize the deposition of newly synthesized histone H3 into chromatin49. Foci of newly synthesized TMR-labeled SNAP–histone H3.3 were detected in NT-siRNA-transfected cells at DSBs generated by WT TRF1–FokI, but not when the inactive DA TRF1–FokI was expressed (Fig. 4g). However, histone H3.3 was largely absent from TRF1–FokI-induced DSBs in HIRA-depleted cells (Fig. 4g). Intriguingly, histone H3.3 deposition at TRF1–FokI-induced DSBs was strongly impaired by PARP and PARG inhibition, and this effect was reversed upon combined inhibitor treatment (Fig. 4g). We conclude that HIRA is indispensable for deposition of histone H3.3 at DSBs and is
A
uthor Man
uscr
ipt
A
uthor Man
uscr
ipt
A
uthor Man
uscr
ipt
A
uthor Man
uscr
ipt
coordinated by PARylation to maintain HDR-associated chromatin dynamics at telomeres in ALT cancer cells.
HIRA compensates for ATRX deficiency in ALT cancer cells.
Our cumulative findings suggested that sequestration of HIRA at telomeres in ALT cells might be part of an adaptation to maintain chromatin in the absence of the ATRX–DAXX complex. Although HIRA–YFP was largely absent from WT-TRF1–FokI-induced DSBs in U2OSATRX cells18, even in the presence of PARGi, ATRX localized to telomeric DSBs and was not affected by PARGi (Fig. 5a,b). Similarly, depletion of ATRX in TEL+ HeLa LT cells in combination with PARGi enabled accumulation of HIRA–YFP at telomeres (Extended Data Fig. 5a), indicating that, in the absence of ATRX, HIRA mobilizes to telomeres to adopt ATRX’s role in maintaining telomeric chromatin, and potentially reflecting a dynamic interplay between distinct histone chaperone complexes50.
The dependence of ATRX-deficient ALT+ cancer cells on HIRA for HDR and chromatin management suggested that its absence could be detrimental for their survival. Using two distinct shRNAs (Extended Data Fig. 5b), we observed that, although the survival of TEL+ HOS, SJSA1 and LM216T cells was diminished, HIRA depletion was catastrophic for ALT + U2OS, Saos2 and LM216J cells (Fig. 5c). Strikingly, death of HIRA-depleted ALT cells was prevented by constitutive expression of ATRX in U2OS cells (Fig. 5d). Furthermore, the combined depletion of both ATRX and HIRA in TEL+ HeLa LT cells mimicked the
cytotoxic effect observed in ALT cells (Extended Data Fig. 5c,d). These data indicate that, in the absence of functional ATRX, HIRA becomes indispensable in ALT cancer cell lines. HIRA regulation by PARylation.
The requirement for PARylation in HIRAs association with telomeres during G2 phase (Fig. 4a) has not previously been reported. PAR was detected in immunoprecipitates of HIRA– YFP from WT-TRF1–FokI-induced U2OS cells (Fig. 6a), but PARylated HIRA was not detected from PARPi-treated WT TRF1–FokI cells or DA TRF1–FokI cells, confirming its PARP1-DNA-damage dependence. We therefore performed a series of in vitro PAR-binding assays by incubating immunoprecipitated, membrane-immobilized full-length HIRA–YFP with biotin-conjugated, in-vitro-synthesized PAR chains. Unlike GFP–PARP1 and GFP– FUS proteins known to bind PAR, we did not detect the binding of HIRA–YFP to PAR (Extended Data Fig. 6a), indicating that HIRA does not bind to PAR in cis and is likely subject to covalent modification by PARP1.
IP PAR western blots of previously characterized HIRA mutants similarly did not detect PARylation of a homotrimerization and CABIN1-binding mutant (HIRA-W799A D800A), suggesting that telomere binding occurs after formation of the HIRA complex (Fig. 6b). This mutant also did not localize to WT TRF1–FokI-induced DSBs (Fig. 6c,d). Interestingly, PAR was detected with the ASF1a-binding HIRA mutant (HIRA-I461D) that also localized to TRF1–FokI DSBs (Fig. 6b–d). Surprisingly, deletion of the entire conserved B-domain (ΔB) of HIRA–YFP, which surrounds the I461 residue, abolished PAR as well as telomere DSB localization. Thus, PARylation of HIRA likely occurs within the B-domain and is independent of ASF1a binding to the same region. We compared the ability of PARylatable
A
uthor Man
uscr
ipt
A
uthor Man
uscr
ipt
A
uthor Man
uscr
ipt
A
uthor Man
uscr
ipt
and of non-PARylatable HIRA to rescue the phenotypes of HIRA knockdown in U2OS cells (Fig. 6e–h and Extended Data Fig. 6b). Unlike the PARylated wild-type (WT) HIRA and the HIRA-I461D mutant, the non-PARylated ΔB mutant was unable to restore APB levels and telomere clustering following expression of WT TRF1–FokI (Fig. 6e,f). Likewise, the non-PARylated ΔB mutant was not proficient in restoring de novo histone H3.3 deposition (Fig. 6g), supporting the finding that perturbation of PARylation impedes histone H3.3 dynamics at telomeric DSBs (Fig. 4g). Lastly, in BrdU IP assays in WT TRF1–FokI U2OS cells, both WT HIRA and HIRA-I461D mutant fully restored telomere DNA synthesis, whereas the HIRA B-domain mutant failed to complement the loss of endogenous HIRA (Fig. 6h). These observations provide additional evidence that PARylation of HIRAs B-domain is critical for its localization and residency at telomeres during G2 phase and for deposition of histone H3.3 during HDR to compensate for the loss of ATRX.
Discussion
In this study, we provide evidence that the equilibrium between PAR synthesis by PARP and hydrolysis by PARG is critical to telomere maintenance by the ALT pathway. Whereas inhibition of PARP1 stimulates telomere recombination, inhibition of PARG and subsequent retention of PAR perturbs HDR mechanisms that mediate ALT. Negatively charged PAR imposes a biophysical reconfiguration of chromatin, known as PAR-seeded liquid-phase separation, that establishes subnuclear compartments dedicated for repair processes37. By combining telomere-specific proteomics and PARG inhibition, we uncovered protein factors whose inhibition can impair telomere dynamics in ALT cancer cells through diverse ways. The ability to detect such factors that are usually not detected at telomeres likely reflects their prolonged retention upon inhibition of PARG-dependent dissociation. Thus, a broad model to explain the effects of PARG inhibition on ALT-associated HDR would be that, although PAR is initially synthesized at telomeric DSBs or regions of replicative stress, PARG inhibition may block PAR-regulated phase separation that requires active PARG hydrolysis, paralyzing the ALT mechanism at its early or intermediate stages and altering the repair dynamics of telomeres.
A PAR-dependent switch from ATRX- to HIRA-mediated deposition of histone H3.3. When present in healthy cells or telomerase-expressing cancer cells, the ATRX–DAXX complex manages telomeric chromatin41,44 and alleviates replicative stress and DNA damage at telomeres18 by resolving replicative barriers like G4 structures45. The resolution of these aberrant structures enables subsequent histone H3.3 deposition by DAXX (Fig. 6i). Interestingly, ATRX can interact with PCNA and RFC during HDR of genomic breaks in the G2 phase45. Owing to the loss of functional ATRX and DAXX, the restoration of telomeric chromatin prior to mitosis becomes essential. We show that the PAR-dependent regulation of HIRA represents a fail-safe mechanism for this. HIRAs intrinsic non-specific DNA-binding properties have been proposed to be necessary for its role in gap-filling49. In the absence of ATRX, telomeres are prone to accumulate single-stranded DNA intermediates that HIRA can freely bind. We propose that, once localized, HIRA is retained via PARylation to execute deposition of histone H3.3 within telomeres (Fig. 6i). Although HIRA efficiently reconstitutes chromatin, it does not fulfill ATRX’s other roles in mitigating replicative stress
A
uthor Man
uscr
ipt
A
uthor Man
uscr
ipt
A
uthor Man
uscr
ipt
A
uthor Man
uscr
ipt
imposed by DNA secondary structures (for example, G4s, single-stranded DNA gaps) (Fig. 6i), which pose an impediment to chromatin assembly and alter nucleosome density within ALT telomeres51, or might interfere with binding of shelterin or other telomere-specific proteins. Thus, HIRA’s inability to compensate for ATRX–DAXX function leaves telomeres susceptible to persistent DNA damage and replicative stress, which in turn stimulates ALT-associated DNA-repair activities across successive cell cycles. This model could explain the dependence of ATRX-deficient ALT cancer cells on HIRA, as its depletion removes the fail-safe pathway that assures a threshold requirement of re-establishing telomeric chromatin before mitosis.
The requirement for PARylation to mediate HIRA association with ALT telomeres specifically in G2 was surprising, as it had not previously been implicated in HIRA regulation during transcription-coupled histone deposition or nucleotide-excision repair. In this regard, it might be relevant that PAR-mediated regulation of HIRA occurs through the B-domain. The B-domain is a short peptide that is conserved among functionally related histone chaperone proteins, such as the p60 subunit of chromatin-assembly factor 1 (CAF1)52 and codanin-1 (ref. 53). Its location within the disordered region of HIRA is consistent with the reported targeting of PARylation to disordered protein regions that mediate dynamic protein interactions37. HIRA’s B-domain makes crucial interactions with ASF1a during histone H3.3 transfer and deposition52. However, HIRA PARylation and binding to ASF1a appear to be distinct facets of the B-domain. The delineation of these might prove relevant for the design of small-molecule HIRA inhibitors to eliminate ATRX-mutated cancer cells that are reliant on ALT telomere elongation.
Methods
Cell lines.U2OS (ATCC; HTB-96), Saos2 (ATCC; HTB-85), HOS (ATCC; CRL-1543) and SJSA1 (ATCC; CRL-2098) cell lines were obtained from ATCC. VA13 and WT and DA TRF1– FokI U2OS cell lines were generously provided by R. Greenberg (University of
Pennsylvania). LM216J/T cells were originally described by J.P Murnane and generously provided by Roger Greenberg (University of Pennsylvania). Doxycycline-inducible U2OS-ATRX cells were generously provided by D. Clynes (University of Oxford). Cell lines were cultured in DMEM + GlutaMAX (Life Technologies) supplemented with 10% fetal growth serum. U2OS cells stably expressing SNAP–H3.3 were provided by the Almouzni Lab. Cells were cultured at 20% O2 and 7.5% CO2. U2OS, HeLa LT and 293FT cell lines were
validated by STR profiling and confirmed to be mycoplasma free by ATCC cell-line authentication services.
PARP and PARG Inhibitors.
The active (PDD00017272) PARG inhibitor and its inactive analog (PDD00031704) used in this study were generously provided D. James, I. Waddell, D. Ogilvie and K. Smith at the Drug Discovery Unit at Cancer Research UK (Manchester). Olaparib (KU-0059436, AZD2281) used to inhibit PARP1 and PARP2 was purchased from Selleck Chem.
A
uthor Man
uscr
ipt
A
uthor Man
uscr
ipt
A
uthor Man
uscr
ipt
A
uthor Man
uscr
ipt
Lentivirus production.
Lentiviral particles were generated by co-transfection of three plasmids, the shuttle vector plus two pMD2.g(VSVG) and psPAX2 in 293FT cells. Forty-eight hours after transfection, lentivirus-containing supernatant was collected and passed through 0.45-μM filters to isolate the viral particles. The following shRNAs were used: HIRA no. 1 (TRCN0000020515), HIRA no. 2 (TRCN0000020517), ATRX A (TRCN0000013588), ATRX B
(TRCN0000013589), PARG and PARP1 (gift from R. Sobol, University of South Alabama). Flow cytometry.
Cells in each condition were collected and washed twice in cold 1× PBS. Cell pellets were resuspended in 100 μl cold 1× PBS. Cells were fixed by slowly adding 1 ml cold ethanol (70%). Cells were incubated overnight at −20 °C. The next day, cells were washed three times with an excess of ×1 PBS. After the last wash, all PBS was removed and cells were resuspended in 500 μl PI staining solution containing 2 μg ml−1 RNase and 200 μg propidium iodide in 1× PBS. Cells were stained overnight at 4 °C. The next day, fluorescence was analyzed by flow cytometry (Accuri C6, BD).
Clonogenic survival assay.
One thousand cells were seeded in 6-well plates in triplicate and cultured for 7 d before fixation and staining in a 1% crystal violet solution. Plates were imaged and analyzed with the Protein Simple FluorChem system, which was used to count positive-stained colonies and to calculate total cell coverage per well. For experiments involving inhibitors, PARPi (1 μM/100 nM) and PARGi (1 μM/100 nM) were added 24 h after seeding cells in 6-well plates. Medium was replaced with inhibitors every 3 d. For experiments involving shRNAs, cells were infected with lentivirus expressing shRNAs control or targeting HIRA no. 1 and HIRA no. 2. After 2 d of infection, cells were seeded for colony assay.
Calorimetric ADP–ATP assay.
U2OS and HeLa LT cells were treated with PARGi (1 μM or 100 nM) for 12 d. U2OS TRF1–FokI (WT or inactive D450A) cells were induced with 4-OHT and shield for 4 h prior to collection. Uninduced U2OS TRF1–FokI cells were treated with MMS for 1 h prior to collection. Cellular ADP:ATP ratios in cell lines were measured using the ADP Assay kit (Sigma-Aldrich) according to the manufacturer’s instructions. Luminescence readings were taken using the BioTek Synergy 2 Multi-Mode microplate reader. Results were analyzed in Microsoft Excel with ADP:ATP ratios calculated through use of a standard curve.
Telomere restriction fragment analysis by pulsed field gel electrophoresis.
Telomere gels were performed using telomere restriction fragment (TRF) analysis. Genomic DNA was digested using AluI and MboI (NEB). Then, 4–10 μg of DNA was run on a 1% PFGE agarose gel (Bio-Rad) in 0.5× TBE buffer using the CHEF-DRII system (Bio-Rad) at 6 V cm−1; the initial switch time was 1 s, and the final switch time 6 s, for 17 h at 14 °C. The gel was then dried for 2 h at 60 °C, denatured in a 0.5 M NaOH/1.5 M NaCl solution, and neutralized. Gel was hybridized with 32P-labeled (TTAGGG)4 oligonucleotides in
Church buffer overnight at 55 °C. The next day, the membrane was washed three times in 2×
A
uthor Man
uscr
ipt
A
uthor Man
uscr
ipt
A
uthor Man
uscr
ipt
A
uthor Man
uscr
ipt
SSC buffer and once in 2× SSC 0.5% SDS, exposed onto a storage phosphor screen and scanned using Typhoon 9400 PhosphoImager (GE Healthcare). Telomere length was determined using TeloTool software.
C-circle assay.
Genomic DNA was purified, digested with AluI and MboI and cleaned up by phenol– chloroform extraction and precipitation. DNA was diluted in ultraclean water and
concentrations were exhaustively measured to the indicated quantity (30, 15, 7.5 ng) using a Nanodrop (Thermo Fisher). Samples (10 μl) were combined with 10 μl BSA (NEB; 0.2 mg ml−1), 0.1 % Tween, 0.2 mM each of dATP, dGTP, dTTP and 1× Φ29 Buffer (NEB) in the presence or absence of 7.5 U ΦDNA polymerase (NEB). Samples were incubated at 30 °C for 8 h and then at 65 °C for 20 min. Reaction products were diluted to 100 μl with 2× SSC and dot-blotted onto a 2× SSC-soaked nylon membrane. DNA was ultraviolet (UV) cross-linked onto the membrane and hybridized with a P32 end-labeled (CCCTAA)4
oligonucleotide probe to detect C-circle amplification products. All blots were washed, exposed to PhosphoImager screens, scanned using a Typhoon 9400 PhosphoImager (GE Healthcare) and quantified with ImageJ. In all reactions, when Φ29 was omitted as a negative control DNA was used.
Western blotting.
Cells were collected with trypsin, quickly washed in PBS, counted with Cellometer Auto T4 (Nexcelom Bioscience) and directly lysed in 4× LDS sample buffer at 1 × 10⁴ cells per μl. Proteins were gently homogenized using universal nuclease (Pierce/ThermoFisher), denatured for 10 min at 68 °C and resolved by SDS–PAGE electrophoresis, transferred to nitrocellulose membranes, blocked in 5% milk or BSA and 0.1 % Tween for 30 min and probed. For secondary antibodies, HRP-linked anti-rabbit or mouse (Amersham) was used, and the HPR signal was visualized with SuperSignal ECL substrate (Pierce) as per the manufacturer’s instructions.
Antibody sources were: PCNA Cell Signaling, no. 2586 1:2,000; RPA2 Abcam, no. ab2175 1:1,000; RPA2 S4/8 Bethyl, no. A300-245 1:1,000; poly(ADP-ribose) Millipore, no.
MABC547 1:400; PARP1 Active Motif, no. 39559 1:5,000; PARG Cell Signaling, no. 66564 1:1,000; TNKS1 S. Smith (New York University) 1:1,000; ALC1 (CHD1L) Bethyl, no. A303-342A 1:2,000; TRF2 Novus, no. NB110-57130 1:1,000; RECQ1 Bethyl, no. A300-447A 1:1,000; NFKB/p65 Santa Cruz, no. c-20 1:250; GFP–HRP Miltenyi, 130-091-833 1:1,000; Histone H2AX Abcam, no. 11175 1:5,000; γH2AX Millipore, no. 05-635 1:1,000; CHK2 Cell Signaling, no. 2662 1:1,000; CHK2 T68 Cell Signaling, no. 2197 1:1,000; XRCC1 Bethyl, no. A300-065A 1:1,000; SAFB1 Bethyl, no. A300-812A 1:1,000; FUS Bethyl, no. A300-292A 1:200; hnRNPUL1 Bethyl, no. A300-862A 1:1,000; RBMX Cell Signaling, no. 14794 1:1000; ARP2 Bethyl, no. A305-216A 1:1,000; ARP3 Cell Signaling, no. 4738 1:1,000; VCP Bethyl, no. A300-588A 1:1,000; RFC1 Bethyl, no. A300-141A 1:1,000; CCNB1 Cell Signaling, no. 4138 1:1,000; RPA1 Cell Signaling, no. 2267 1:1,000, γTUB Sigma, no. T5326 1:5,000; HIRA Active Motif, no. 39557 1:200; CABIN1 Abcam, no. ab3349 1:1,000; UBN1 Abcam, no. ab101282 1:2,000; ATRX Cell Signaling, no. 14820 1:1,000.
A
uthor Man
uscr
ipt
A
uthor Man
uscr
ipt
A
uthor Man
uscr
ipt
A
uthor Man
uscr
ipt
siRNA transfections.
For siRNA knockdown, the On-Target Plus (OTP) siRNA Smartpools from Dharmacon (Horizon) were used, unless otherwise indicated. To deplete endogenous HIRA for rescue experiments, a single siRNA targeting the 3′ UTR of HIRA messenger RNA was
synthesized and purchased from Dharmacon (Horizon). Briefly, 200,000 and 700,000 cells were seeded per well of a 6-well plate and a 10-cm dish containing growth medium without antibiotics, respectively. About 2 h later, cells were transfected. siRNAs and Dharmafect were diluted in OptiMEM (Life Technologies). A working siRNA concentration of 50 nM was used. We used 2.5 μl and 5 μl Dharmafect transfection reagent per 6-well and 10-cm plate, respectively. Transfection medium was replaced with complete culture medium 24 h later, or cells were split for desired application and collected at 72 h post-transfection, unless otherwise indicated. Sequences or Dharmacon catalog numbers of siRNAs used in this study are as follows: HIRA, 5′-GAUGACGACAGUGUUAUCCUU-3′; HIRA 3′ UTR, 5′-GACCUAAGACCUAUGUAAAUU-3′; SAFB1,
5′-UCAAUUUCGUCAGGAUUACUU-3′; CABIN1 no. J-012454-09; UBN1 no. J-014195-05; XRCC1 no. L-009394; RBMX no. L-011691; hnRNPUL1 no. L-004132; FUS no.
L-009497; VCP/p97 no. L-008727; ARP2 no. L-012076; ARP3 no. L-012077. Direct immunofluorescence.
Cells on glass coverslips were washed twice in PBS and fixed with 2% PFA for 10 min. Cells were permeabilized with 0.1% (w/v) sodium citrate and 0.1 % (vol/vol) Triton X-100 for 5 min and incubated with fresh blocking solution (1 mg ml−1 BSA, 10% normal goat serum, 0.1% Tween) for at least 30 min. Primary antibodies were diluted in blocking solution and added to cells for 1 h at room temperature (RT) or overnight at 4 °C. Next, cells were washed in 3 times with PBS for 5 min and incubated with Alexa-coupled secondary antibodies (488 nm, 568 nm, 647 nm) (Life Technologies) for 1 h at RT. Then, cells were washed three times with PBS and mounted on slides with Prolong Gold Anti-fade reagent with DAPI (Life Technologies). Once the Prolong Anti-fade had polymerized and cured for ~24 h, cells were visualized by conventional florescence with a ×40 and/or ×63 Plan λ objective (1.4 oil) using a Nikon 90i or Nikon A1R Spectral confocal microscope. IF-FISH.
After secondary-antibody incubation, cells were washed as above, but then the IF staining was fixed with 2% paraformaldehyde (PFA) for 10 min. PFA was washed off with PBS and coverslips dehydrated with successive washes in 70%, 95% and 100% ethanol for 3 min, and were allowed to air dry completely. Next, the coverslips were mounted on glass slides with 15 μl per coverslip of hybridization mix (70% deionized formamide, 1 mg ml−1 of Blocking Reagent (Roche), 10 mM Tris-HCl pH 7.4) containing Alexa 488–(CCCTAA)4 PNA probe
(PNA Bio). DNA was denatured by setting the slides on a heating block set to 72 °C for 10 min and then incubating for at least 4 h or overnight at RT in the dark. The coverslips were then washed twice for 15 min with Wash Solution A (70% deionized formamide and 10 mM Tris-HCl pH 7.2) and 3 times with Solution B (0.1 M Tris-HCl pH7.2, 0.15 M NaCl and 0.08% Tween) for 5 min at RT. Ethanol dehydration was repeated as above, and finally the samples were mounted and analyzed as described above.
A
uthor Man
uscr
ipt
A
uthor Man
uscr
ipt
A
uthor Man
uscr
ipt
A
uthor Man
uscr
ipt
Chromosome orientation FISH.
Cell cultures were incubated with 7.5 mM BrdU and 2.5 mM BrdC for ~12 h. After removal of nucleotide analogs, colcemid (Gibco) was added for ~2 h, cells were collected by trypsinization, swelled in 75 mM KCl and fixed in 70% methanol:30% acetic acid. Samples were stored at −20 °C. Metaphase chromosomes were spread by dropping onto washed slides, and then were treated with RNase A (0.5 mg ml−1) and pepsin. Slides were incubated in 2× SSC containing 0.5 mg ml−1 Hoechst 33258 for 15 min in the dark and irradiated for 40 min (5.4×10⁵ J/m2, energy 5,400) in a UV Stratalinker 2400 (Stratagene). The nicked BrdU/C-substituted DNA strands were degraded by exonuclease III digestion. The slides were then washed in PBS, dehydrated by ethanol washes and allowed to air dry completely. The remaining strands were hybridized with fluorescently labeled DNA probes of different colors, specific either for the positive telomere strand (TTAGGG)4 (polymerized by
lagging-strand synthesis) (Alexa-488, green color), or the negative telomere lagging-strand (CCCTAA)4
(polymerized by leading strand synthesis) (Alexa-568, red color). Prior to hybridization of the first PNA, DNA was denatured by heating at 72 °C for 10 min, as in IF-FISH, and then was incubated for 2 h at RT. Slides were washed for 15 min with Wash Solution A (see ‘IF-FISH’), dried and then incubated with the second PNA for 2 h at RT. The slides were then washed again twice for 15 min with Wash Solution A and 3 times with Wash Solution B (see IF-FISH) for 5 min at RT. The second wash contained DAPI (0.5 μg ml−1). Finally, cells were dehydrated in ethanol as above and were mounted (Vectashield). The resulting
chromosomes show dual staining and allow distinction between leading and lagging strands. Metaphase chromosomes were visualized by conventional florescence microscope with a ×63 Plan λ objective (1.4 oil) on a Nikon 90i microscope.
Live-cell imaging of telomere motion.
As a surrogate for telomeres eGFP–TRF1 foci were tracked in a three-dimensional volume after imaging with a Nikon A1RS point scanning confocal microscope. Fields were imaged with a ×60 1.40 NA objective using 405 nm and 488 nm excitation laser lines at 500 nm steps in z. Nuclear volumes were corrected for gross displacement in x and y due to cell migration using NIS Elements software. Images were deconvolved again using NIS Elements to account for warping due to spherical aberration. The nuclear volumes and relative foci positions were then corrected for nuclear rotation by defining the medial axis of a z-projected nucleus and determining its angular displacement relative to the field. The volumetric data were rotated to correct for angular displacement relative to the previous time point. Telomere (eGFP–TRF1) foci positioning and tracks were defined with Imaris analysis software. Fine x-, y- and z-axial displacements were corrected by defining a centroid point for each nuclear volume and correcting individual foci positions. Each telomere focus position (n) was corrected relative to the centroid displacement from the previous time point (t) in the x, y and z axes. This fine correction accounts for slight nuclear drift concentrated in the z axis, as slight upward and downward motion of the nucleus can drastically skew the displacement of individual telomere foci. Telomere movement from a minimum of 30 cells per condition was captured and the complete motion of > 100 telomeres over 60 min with the adjustments for motion in z. Telomeres whose motion could not be tracked for a complete hour were omitted from analysis. A Euclidian model was used to calculate the vector displacement (d) for the nuclear centroid and telomere foci over time:
A
uthor Man
uscr
ipt
A
uthor Man
uscr
ipt
A
uthor Man
uscr
ipt
A
uthor Man
uscr
ipt
dtn = (xtn − xtn − 1)2 + ytn−ytn−1 2+(ztn−ztn−1)2
The same vector displacement model was used in determining the mean squared displacement for foci over time.
BrdU IP.
TRF1–FokI-inducible cells were induced by adding 40 ng ml−1 doxycycline for ~24 h, followed by 4-OHT (1 μM) and shield1 ligand (1 μM). Cells were pulsed with 100 μM BrdU (Sigma) for 2 h before collection. Extracted genomic DNA was sheared by sonication into 100- to 300-bp fragments. Sheared genomic DNA was denatured for 10 min at 95 °C and cooled in an ice-water bath. Denatured genomic DNA was incubated with 2 μg anti-IgG (Sigma) or anti-BrdU antibody (BD) diluted in immunoprecipitation buffer (0.0625 % (vol/ vol) Triton X-100 in PBS) with rotation overnight and at 4 °C. The next day, samples were incubated with 30 μl Protein A/G agarose beads (Santa Cruz) prebound to a bridging antibody (Active Motif) for 1 h, with rotation and at 4 °C. Beads were then washed three times with immunoprecipitation buffer and once with TE buffer. Beads were then incubated twice in elution buffer (1% (wt/vol) SDS in TE) for 15 min at 65 °C. Pooled eluates were purified with the ChIP DNA Clean & Concentrator kit (Zymo). Samples were diluted into 2× SSC buffer, treated at 95 °C for 5 min and dot-blotted onto an Amersham Hybond-N+ nylon membrane (GE). The membrane was then denatured in a 0.5 N NaOH/1.5 M NaCl solution, neutralized and ultraviolet cross-linked. The membrane was hybridized with 32 P-labeled (TTAGGG)4 oligonucleotides in Church Buffer overnight at 55 °C. The next day, the
membrane was washed 4 times in 2× SSC buffer and once in 2× SSC/0.5% SDS, exposed onto a storage phosphor screen (GE Healthcare), scanned and analyzed with ImageJ. Telomere-fiber analysis.
We seeded 350,000 WT TRF1–FokI cells in a 60-mm dish and induced these by adding 40 ng ml−1 doxycycline for ~24 h, followed by 4-OHT (1 μM) and shield1 ligand (1 μM) for 3 h. PARPi (5 μM) or PARGi (5 μM) were added to the medium upon induction. Cells were subsequently labeled by incubation with 25 μM CldU for 20 min followed by 250 μM IdU for 20 min. Cells were collected with trypsin and resuspended in ice-cold PBS at 1.2 × 10⁶ cells ml−1. Two microliters of the cell suspension was pipetted onto a slide. Ten microliters of lysis solution (1 M Tris-Cl (pH 7.4), 500 mM EDTA (pH 8) and 10% SDS) was gently added to the cell suspension, and slides were incubated for 5 min. Slides were tilted at a 15° angle to allow the drop to travel the length of the slide. Slides were then dried for 7–8 min and fixed with methanol and acetic acid (3:1) for 7-8 mins. Slides were kept in 70% ethanol until denaturation for a maximum of 7 d. For denaturation, slides were initially incubated in methanol/0.1% 2-mercaptoethanol for 5 min and then incubated in denaturation buffer (0.1 M NaOH, 70% ethanol and 0.1% 2-mercaptoethanol) for 12 min. Subsequently, slides were incubated in fixation buffer (0.5% glutaraldehyde in denaturation buffer) for 5 min. Slides were rinsed sequentially with 70%, 95% and 100% ethanol and were left to dry for 30 min −1 h. DNA fibers were hybridized overnight with biotin-OO-(CCCTAA)4 locked nucleic
acid (LNA) probe (Exiqon) at 37 °C. The LNA probe was visualized using the
Alexa-A
uthor Man
uscr
ipt
A
uthor Man
uscr
ipt
A
uthor Man
uscr
ipt
A
uthor Man
uscr
ipt
Fluor-488-conjugated streptavidin antibody (Life Technologies), followed by incubation with the biotinylated anti-avidin antibody (Vector) and sequential addition of the Alexa-Fluor-488-conjugated streptavidin antibody (Life Technologies). IdU and CldU were detected using mouse anti-IdU (BD) and rat anti-CldU (Abcam) monoclonal antibodies followed by Fluor-647-conjugatedgoat anti-mouse (Life Technologies) and Alexa-Fluor-555-conjugated goat anti-rat (Life Technologies) secondary antibodies. Images were acquired using the Nikon 90i microscope equipped with a ×63 Plan λ objective (1.4 oil). The line-measurement tool on the NIS-element software (Nikon) was used to calculate the length of replication tracts and telomeres. For conversion of microns to kilobases, 0.26 μm corresponded to 1 kb of DNA.
BrdU labeling of telomere DNA synthesis.
Briefly, cells were synchronized in the G2 phase with 10 μM RO-3066 for 20 h. The next day, TRF1–FokI was induced as before and pulsed with 100 mM BrdU for 2 h. Coverslips were washed in 1× PBS before fixation with 4% paraformaldehyde for 10 min. After permeabilization (0.5% Triton X-100 for 5 min), cells were incubated with denaturing buffer (500 U ml−1 nuclease (Thermo Scientific), 20 mM Tris-HCl (pH 8.4), 2 mM MgCl2 50 mM
KCl in PBST) for 25 min at 37 °C in a humidified chamber. Coverslips were then washed in 1× PBST. Coverslips were incubated with blocking solution for 30 min at RT and they were incubated with anti-BrdU (1:10, BD, mouse) and anti-FLAG (1:1,000, CS, Rabbit)
antibodies, diluted in blocking solution, for 30 min at 37 °C in a humidified chamber. Coverslips were washed in 1× PBST and stained for 1 h with secondary antibodies. SNAP labeling of histone H3.3.
U2OS SNAP–H3.3 cells were transfected with control (NT) and HIRA-depleting siRNAs. Forty-eight hours later, these cells were transfected with FLAG-tagged WT or DA TRF1– FokI. The next day (24 h later), the quenching of old parental histone H3.3 and labeling of newly synthesized histone H3.3 was conducted as follows. Pre-existing histones were first quenched by incubating cells with 10 μM SNAP-cell Block (New England Biolabs) for 30 min, followed by a 30-min wash and a 2-h chase in fresh growth medium. Newly
synthesized SNAP-tagged histone H3.3 that were synthesized during the chase were labeled for detection by immunofluorescence by incubating cells with 2 μM SNAP-cell TMR star (New England Biolabs) for 15 min (pulse) followed by a 20-min incubation in fresh
medium. PBS-washed cells were incubated in pre-extraction buffer for 2 min before fixation and staining.
Immunoprecipitation of GFP-tagged proteins.
GFP IP was performed with GFP–TRAP agarose beads (Chromotek). Briefly, 1 × 10⁶ WT TRF1–FokI cells were seeded in a 10-cm dish. About 24 h later, cells were transfected with GFP constructs using Lipofectamine 2000 (Invitrogen) as per the manufacturer’s
instructions, and 40 ng ml−1 doxycycline was added to the medium as before. Cells were later induced with 4-OHT (1 μM) and shield1 ligand (1 μM) for 4 h with the addition of PARGi (5 μM). Cells were collected using ice-cold PBS, scraped from the dish and transferred to pre-cooled tubes. Cell pellets were resuspended in 200 μl ice-cold modified RIPA buffer (10 mM Tris-HCl (pH 7.5), 150 mM NaCl, 0.5 mM EDTA, 0.5% NP-40, 0.09%
A
uthor Man
uscr
ipt
A
uthor Man
uscr
ipt
A
uthor Man
uscr
ipt
A
uthor Man
uscr
ipt
sodium azide) with 1 mM PMSF, 2.5 mM MgCl2, 1 mg ml−1 DNase (Pierce) and protease
inhibitor cocktail (Sigma). PARPi and PARGi were added to lysis buffers to block in vitro PARP and PARG activity. To extract chromatin-associated proteins, such as HIRA and PARP1, modified RIPA buffer (500 mM NaCl) was used as before1. Tubes were placed on ice for 30 min with extensive pipetting every 10 min. Tubes were centrifuged at 20,000g for 10 min at 4 °C and lysates were transferred to pre-cooled tubes. 300 μl ice-cold dilution/ wash buffer (10 mM Tris-HCl (pH 7.5), 150 mM NaCl, 0.5 mM EDTA, 0.018% sodium azide) with 1 mM PMSF, 2.5 mM MgCl2 and protease inhibitor cocktail (Sigma) was added
to tubes. Fifty microliters of lysate was resuspended in 50 microliters 4× LDS buffer to save as 10% input samples. GFP–TRAP magnetic agarose beads were equilibrated in dilution/ wash buffer. Twenty-five microliters of the bead slurry was added to each tube, and rotated for 1 h at 4 °C. Beads were magnetically separated and washed twice with wash/dilution buffer. Beads were resuspended in 100 μl 4× LDS buffer and boiled for 10 min at 95 °C. Beads were magnetically separated and SDS–PAGE was performed with the supernatant. PAR-binding assays.
GFP alone, GFP–PARP1, HIRA–YFP or GFP–FUS were transiently transfected in U2OS cells and immunoprecipitated using GFP–TRAP magnetic agarose beads as described above. Proteins were separated in 8% SDS–PAGE denaturing gels. Gels were incubated for 1 r with gentle agitation in running buffer containing 5% β-mercaptoethanol. Proteins were then transferred to nitrocellulose membranes and rinsed 3 times in TST buffer (10 mM Tris-HCl (pH 7.5), 150 mM NaCl, 0.05 % Tween) and incubated on a shaker at room temperature in TST buffer containing 100 nM of biotinylated PAR polymer (R&D Systems). After 1 h of incubation, membranes were washed 3 times for 10 min with TST buffer, followed by 3 washes of 15 min with the same buffer containing 500 mM NaCl. The membranes were rinsed for 5 min in regular TST and incubated with HRP–streptavidin antibody in TST overnight at 4 °C. Alternatively, after PAR–biotin binding and wash steps, membranes were probed for PAR and developed using HRP secondary antibodies. Finally, membranes were probed for GFP–HRP to detect total immunoprecipitated proteins.
Enrichment of PAR-associated proteins.
We induced 4 × 10⁷ WT TRF1–FokI and DA TRF1–FokI cells by adding 40 ng ml−1 doxycycline for ~24 h, followed by 4-OHT (1 μM) and shield1 ligand (1 μM). PARGi (5 μM) was added during the 4-h induction period. Cells were lysed using ice-cold modified denaturing RIPA buffer (50 mM Tris-HCl (pH 7.5), 400 mM NaCl, 1 mM EDTA, 1% NP-40, and 0.1% sodium deoxycholate). PARPi and PARGi were added to lysis buffers to block in vitro PARP and PARG activity. Equal protein amounts were incubated with WT or mutant GST–AF1521 (Tulip Biolabs) in modified RIPA buffer (without NaCl) for 2 h at 4 °C. Beads were washed with modified RIPA buffer (150 mM NaCl). Bound complexes were eluted in 4× LDS buffer.
Mass spectrometry.
Mass spectrometry was conducted at MS Bioworks. Immunoprecipitated samples stored in 4× LDS buffer were separated ~1.5 cm on a 10% Bis-Tris Novex mini-gel (Invitrogen) using the MES buffer system. The gel was stained with Coomassie, and each lane was excised into
A
uthor Man
uscr
ipt
A
uthor Man
uscr
ipt
A
uthor Man
uscr
ipt
A
uthor Man
uscr
ipt
ten equally sized segments. Gel pieces were processed using a robot (ProGest, DigiLab) as follows. First washes were with 25 mM ammonium bicarbonate followed by acetonitrile. Then, they were reduced with 10 mM dithiothreitol at 60 °C, followed by alkylation with 50 mM iodoacetamide at RT. Samples were digested with trypsin (Promega) at 37 °C for 4 h, and then quenched with formic acid. Sample supernatants were analyzed directly without further processing using a nano LC–MS/MS with a Waters NanoAcquity HPLC system interfaced to a ThermoFisher Q Exactive. Peptides were loaded on a trapping column and eluted over a 75-μm analytical column at 350 nl min−1; both columns were packed with Jupiter Proteo resin (Phenomenex). The mass spectrometer was operated in data-dependent mode, with MS and MS/MS were performed in the Orbitrap, at 70,000 full width at half maximum (FWHM) resolution and 17,500 FWHM resolution, respectively. The 15 most abundant ions were selected for MS/MS.
Proteomic analysis of TRF1–FokI-induced PARylome.
Raw mass spectrometry files were converted into open mzML format using msconvert utility of Proteowizard software suite. MS/MS spectra were searched using the MSFragger
database search tool (version 20180316) against a UniProt/SwissProt Homo sapiens protein sequence database downloaded in 21 May 2019, appended with TRF1_FokI and
Y1521_ARCFU fusion proteins and the respective mutated versions. MS/MS spectra were searched using a precursor-ion mass tolerance of 20 p.p.m. and a fragment mass tolerance of 20 p.p.m., and allowing C12/C13 isotope errors (−1/0/1/2/3). Cysteine carbamylation (+57.0215) was specified as fixed modifications, and methionine oxidation (+15.9949) and amino-terminal protein acetylation (+42.0106) were specified as variable modifications. The search was restricted to fully tryptic peptides, allowing up to two missed cleavage sites. The search results were further processed using the Philosopher toolkit (https://
philosopher.nesvilab.org/) as follows. MSFragger output files (in pepXML format) were processed using PeptideProphet (with the high-mass-accuracy binning and semiparametric mixture modeling options) to compute the posterior probability of correct identification for each peptide to spectrum match (PSM). ProteinProphet was executed on all resulting pepXML files from PeptideProphet resulting in a list of proteins groups (in protXML format). This combined protXML file, as well as the pepXML for each individual
experiment, were then processed using Philosopher’s filter and abacus functions to generate a combined spectral count matrix. The combined protXML file was filtered using the Philosopher filter function to 1% protein-level false-discovery rate (FDR) using the target-decoy strategy. The PSM lists in each experiment were filtered using a sequential FDR strategy, keeping only PSMs passing 1% PSM-level FDR and mapped to proteins that also passed the global 1% protein-level FDR filter. Each peptide was assigned either as a unique peptide to a particular protein or (if shared) assigned as a razor peptide to a single protein that had the most peptide evidence. The combined filtered protein list, as well as the filtered PSM lists for each individual experiment, were then processed using Philosopher’s abacus function to generate a combined spectral count matrix. Each row in the resulting table represented a protein (with a single accession number selected among indistinguishable protein entries) and its abundance (unique plus razor PSM counts) across all experiments. The resulting quantification matrix was loaded into reprint-apms.org online resource to calculate abundance fold change (FC) scores comparing WT versus mutant experiment. A
A
uthor Man
uscr
ipt
A
uthor Man
uscr
ipt
A
uthor Man
uscr
ipt
A
uthor Man
uscr
ipt
final cut-off of FC ≥ 2 was arbitrarily set. This produced a final listing of 117 proteins that was used for in silico functional annotation in DAVID (https://david.ncifcrf.gov/) and downstream functional validation by experimentation.
Extended Data
Extended Data Fig. 1 |. Disruption of PAR turnover perturbs recombinogenic activity at ALT telomeres.
A
uthor Man
uscr
ipt
A
uthor Man
uscr
ipt
A
uthor Man
uscr
ipt
A
uthor Man
uscr
ipt
a, Western blot of PARP1 or PARG knockdown and PAR accumulation in U2OS cells
expressing shRNAs. Extracts from 2 mM hydroxyurea (HU)-PARGi (5μM/24hrs) treated U2OS cells serve as a control for PAR induction. b, Representative IF images of APBs (PML-TTAGGG) in U2OS cells expressing the indicated shRNAs. c, Quantification of APBs (% positive cells) in U2OS, Saos2 and HeLa LT cells expressing the indicated shRNAs. d, Quantification of telomere sister chromatid exchanges (t-SCE) (% per
metaphase) in U2OS, Saos2 and HeLa LT cells expressing the indicated shRNAs. n refers to the number of metaphase spreads analyzed from N = 3 independent assays. e, Left: Western blot of U2OS cells transfected with non-targeting and/or RECQ1 siRNAs treated with PARPi (5μM/72hrs). Right: Quantification of t-SCEs in U2OS and HeLa LT cells
transfected with NT siRNA, and/or RECQ1 siRNA. DMSO/PARPi (5μM/24hrs). n refers to the number of metaphase spreads analyzed from N = 4 independent assays. f, Cell cycle profiles and (g) cellular [ADP/ATP] ratio of U2OS and Hela LT cells treated with inhibitors for 12 days. h, PFGE of DMSO, PARPi (100 nM) or PARGi (1 μM) treated VA13 cells. The red dot indicates mean telomere length (kb). i, Representative images and quantification from clonogenic survival assays in ALT + cells, TEL + cells and (j) U2OS cells expressing ATRX treated with DMSO, PARPi (100μM) or PARGi (1μM) for 7 days. All scale bars in IF panels=5μm. All graphed data in the figure are mean ± s.e.m except d, e which are mean ± s.d. Unless otherwise stated, (n) is the number of cells analyzed and the number of independent assays (N) conducted is represented by black circles. Statistical significance was determined using one-way ANOVA except except (d) where the Mann-Whitney test was used and (i-j) where Students t test was used. Uncropped blots for a, e and digital images are deposited on Figshare. Graphed data is available as Source Data.
A
uthor Man
uscr
ipt
A
uthor Man
uscr
ipt
A
uthor Man
uscr
ipt
A
uthor Man
uscr
ipt
Extended Data Fig. 2 |. PARylation is an early and direct mediator of TRF1-FokI DSB formation.
a, [ADP/ATP] ratio in DMSO/PARGi treated WT-TRF1-FokI U2OS cells. Cells were
treated with 1.5 mM/1 hr MMS. (b) Representative IF images and quantification of PAR at WT-TRF1-FokI DSBs after PARGi, PARGi-PARPi or TNKS1 knockdown. c, Representative IF images and quantification showing GFP-PARP1 localization in WT-TRF1-FokI cells treated with PARPi, PARGi or both. d, Representative IF images and quantification showing GFP-PARG localization in WT-TRF1-FokI U2OS cells. e, Left: Representative IF images