Design and Analysis of Diagnostic Machines Utilizing Compliant Mechanisms
by Edward Sung
Submitted to the Department of Mechanical Engineering in Partial Fulfillment of the Requirements for the
Degree of Bachelor of Science
at the
Massachusetts Institute of Technology June 2011
ARCHIVES
MASSACHU ['-,T JUOCT20
2
11L L iBA
7--7
© 2010 Edward Sung All rights reservedThe author hereby grants to MIT permission to reproduce and to
distribute publicly paper and electronic copies of this thesis document in whole or in part in any medium now known or hereafter created.
Signature of Author ...
ment of Mechanical Engineering
7/ December 8, 2010 Certified by .. Accepted by .. Martin L. Culpepper Associate Professor Thesis Supervisor ... .... owl , ... ... ... John H. Lienhard V C. Collins Professor of Mechanical Engineering Undergraduate Officer
Design and Analysis of Diagnostic Machines Utilizing Compliant Mechanisms
by Edward Sung
Submitted to the Department of Mechanical Engineering On December 8, 2010 in Partial Fulfillment of the Requirements for the Degree of Bachelor of Science in
Mechanical Engineering
ABSTRACT
In this paper, the design and testing of an ankle rehabilitation device is presented. The purpose of the research done is to provide physicians with a diagnostics tool that can quantitatively measure the severity of an injury by measuring the ankle joint's functional output. Torque and power output have been shown to be correlated with functional performance of the ankle joint. The device can measure torque and power output over the full range of motion of the ankle joint complex. Such a device has the potential to enable more accurate diagnoses and improve the efficacy of treatment and rehabilitation.
The device allows rotation about the three orthogonal axes in the Cartesian plane. The rotations are linked in series to simulate ankle subjoint coupling. Cartwheel flexures with strain gages are aligned with the rotational axes and used as torque sensors. Strain gages are placed in a Wheatstone bridge circuit to mitigate environmental factors.
Trials measured torque of the right ankle joint of test subjects from a standing position. Results show that the coupling of the two modes of ankle joint rotation (plantarflexion/dorsiflexion and inversion/eversion) are dependent on a subject's own development.
Thesis Supervisor: Martin L. Culpepper Title: Associate Professor
ACKNOWLEDGEMENTS
First and foremost I would like to thank my thesis advisor Professor Martin L. Culpepper of the Precision Compliant Systems Laboratory (PCSL) at MIT for providing all of the advice and support that I needed to complete a successful thesis.
I would like to thank Alex Slocum Jr., a graduate researcher formerly of the PCSL, for his substantial help with the ankle rehabilitator project. He worked closely with me and my partner, Raymond Ma '10, and we could not have done this without him.
A special thank you goes out to Raymond Ma for his work on the initial prototype and the electronics. Finally, I would like to extend my gratitude to Dr. Jonathan Bean for making this project possible through his medical insight and monetary support.
CONTENTS
A cknowledgem ents ... 3 Contents ... 4 Figures... 6 Tables ... 7 1 Introduction... 8 1.1 Purpose... 8 1.2 Background ... 9 1.2.1 Existing D evices... 10 2 M ethods ... 122.1 Kinem atics of the Ankle Joint (AJC)... 12
2.2 Torque Sensor ... 14
2.3 D evice Protocols ... 15
3 D esign & Build ... 17
3.1 Functional Requirem ents ... 17
3.2 D esign Concepts ... 18
3.2.1 3-Axis Rotation in Series ... 18
3.2.2 N ested 4-Bar Linkages ... 19
3.2.3 Concept Assessment: Weighted Cost-Comparison Chart... 20
3.3 a-Prototype... 21
3.4
p-Prototype...
233.4.1 Initial D esign ... 23
3.4.2 Finite Elem ent Analysis (FEA) and Shortcom ings ... 24
3.4.3 A ngle A djustm ent M echanism ... ... ... 25
3.4.4 Modifications to Prototype... ... 26
3.5.1 M aterial Selection ... 28
3.5.2 Fatigue Perform ance ... 29
3.5.3 Flexure Geometry... 30
3.5.4 Flexure Geometry... 31
4 Results ... 34
4.1 M easurem ents and Data... 34
4.2 Error M odeling... 37
4.3 Discussion ... 38
5 Conclusion... 40
5.1 Discussion... 40
5.2 Areas of Im provem ent -Issues with
s-Prototype
... 41References ... 44
A .2 D tat... 45
A.1I Strain Gages... 45
FIGURES
Figure 1.1: The ankle rehabilitation device ... 9
Figure 1.2: Gait Pressure Device (left), Rutgers Ankle Interface (middle), Hand-held Dynamometer (right)...10
Figure 2.1: Ankle Joint Complex... 13
Figure 2.2: Cartwheel flexure in unloaded configuration (left), and approximate deformation m o d e (rig h t) ... 14
Figure 2.3: Prototype with flexures ... 16
Figure 3.1: 3-axis rotation in series concept ... 19
Figure 3.2: Nested 4-bar linkages concept... 20
Figure 3.3: a-prototype [12]... ... 22
Figure 3.4: Cartwheel flexure transition... 22
Figure 3.5: Initial design with stages labeled... 24
Figure 3.6: Close-up of pin-and-dial mechanism ... ... 25
Figure 3.7: Rendering of
p-prototype
... 26Figure 3.8: close-up of lead-screw angle adjustment mechanism ... 27
Figure 3.10: Cycle life versus safety factor for 7075-T6 Al... 30
Figure 3.11: FEA of plantarflexion flexure (left) and inversion flexure (right) ... 31
Figure 3.12: Deformed flexure blade... 32
Figure 4.1: Plantar/dorsiflexion flexure calbiration data and fit line... 34
Figure 4.2: Inver/eversion flexure calibration data and fit line ... 35
Figure 4.3: Ankle joint torque output for subject 1 ... 36
TABLES
Table 1.1: Gait Pressure Device characteristics... 10
Table 1.2: Rutgers Ankle Interface characteristics ... ... 11
Table 1.3: Hand-held Dynamometer characteristics... 11
Table 3.1: Functional Requirements for the Ankle Rehabilitation Device... 17
Table 3.2: Weighted cost-comparison chart of concepts ... 21
Table 3.3: M aterial com parison chart ... 29
T able 3.4: Flexure FEA results ... 31
Table 4.1: Subject 1 -female 47.6 kg -maximum torque values ... 36
Table 4.2: Subject 2 -male 70.3 kg -maximum torque values ... 36
Table 4.3: Subject 3 -male 72.6 kg -maximum torque values ... 36
Table 4.4: Subject 4 -male 81.6 kg -maximum torque values ... 37
CHAPTER
1
INTRODUCTION
1.1 Purpose
The purpose of this work is to provide clinicians with an accurate and reliable tool for diagnosing ankle injuries. Injuries to the Ankle Joint Complex (AJC) are one of the most common types of orthopedic injuries, generally experienced most often by athletes or the elderly. Torque and power output of the ankle joint have been shown to be correlated with functional capability [1). A device that can measure both power and torque output of the ankle joint has the potential to enable a more accurate diagnosis and also improve the efficacy of a given rehabilitation regimen.
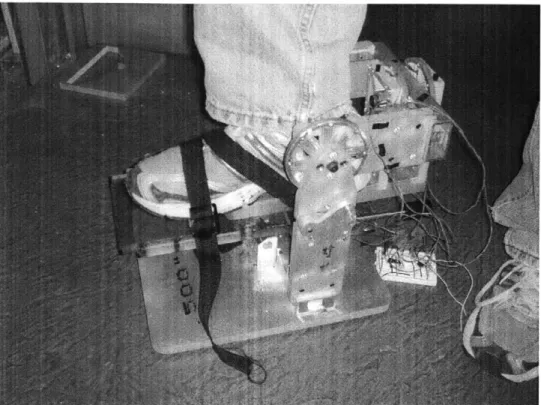
The device that has been developed is shown in figure 1.1. Torque is measured using cartwheel flexures, which have their flexure blades positioned radially so as to only allow angular displacement. The rotational axes of the flexures are aligned with those of the AJC, thus simulating AJC motion. Strain gages on the flexure blades give a voltage reading proportional to the torque applied. After calibration, the relationship between applied torque and angular displacement will also be known. Angular displacement can be differentiated with respect to time in order to calculate angular velocity, and therefore power (torque x angular velocity).
Figure 1.1: The ankle rehabilitation device
1.2 Background
AJC performance is also often used as an indicator of neuromuscular impairment, due to the importance the joint plays on balance [2]. However, current methods for the diagnosis and treatment of such injuries are varied in their efficacy. Current diagnostic procedures rely on the subjective assessment of a clinician in order to determine both the initial severity of an injury as well as the extent to which an injury has healed [3].
The subjective nature of this processes results from the clinician's reliance on patient response to questions relating to pain and ease of motion. While the responses may be used as a general guideline to determine the amount of rest or rehabilitation the patient should undergo, responses are also usually affected by factors such as the patient's own pain tolerance, or their
own ability to accurately describe their symptoms. Current clinical practice has few quantitative physical assessment tools that are both reliable and repeatable [4].
1.2.1 Existing Devices
Noteworthy devices with quantitative diagnostics capabilities are the gait pressure device, the Rutgers Ankle Interface, and the handheld dynamometer [5-8]. Figure 1.2 shows how each device is used. Tables 1.1-1.3 shows a comparison of the 3 devices with their pros and cons listed below each device.
Rutgers Ankle I
oadcell n
4.
Hand-heldFigure 1.2: Gait Pressure Device (left), Rutgers Ankle Interface (middle), Hand-held Dynamometer (right)
Table 1.1: Gait Pressure Device characteristics Vendor Zebris, Bertec, etc.
Usage Measure foot-ground reaction forces and center of foot pressure during gait. Method Measures gait pressure using multiple load cells placed in a treadmill [5]. Limitations Does not analyze ankle kinematics [5].
Cannot measure position or angular velocity of ankle rotation [5). High cost.
Table 1.2: Rutgers Ankle Interface characteristics
Vendor N/A
Usage Personal device for in-home use. Move ankle joint through a range of motion and measure load capacity.
Method A pseudo-passive Stewart Platform uses double-acting pneumatic cylinders to move the foot through a ROM and measure load bearing capability [6].
Limitations Low force output and input. Cannot exert larger forces on foot [6] and cannot support weight of patient [7].
Low reliability due to vibrations, large temperature fluctuations, and overheating of compressor [6].
High cost (projected).
Table 1.3: Hand-held Dynamometer characteristics Vendor Hoggan, Jamar, etc.
Usage Measure torque of joint to which device is held. Method Load cell, electric motor, etc.
Limitations Variability between repeated measures [8]. Variability between various dynamometers [8]. Hoggan, Jamar, etc.
CHAPTER
2
METHODS
2.1 Kinematics of the Ankle Joint (AJC)
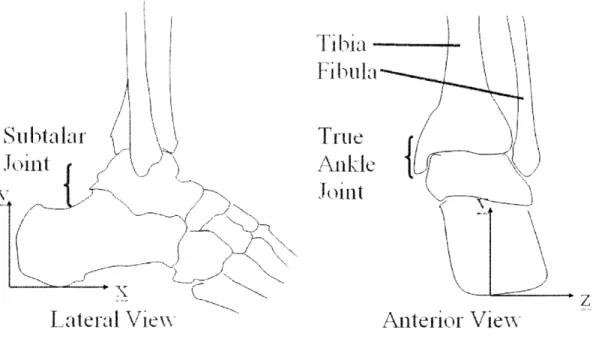
Because we wish to directly measure the torque output of the AJC, a good understanding of anatomy and the kinematics of the joint is required. The AJC is actually comprised of two subjoints, the true ankle joint and the subtalar joint. Each of these subjoints allows rotation about a single axis. The true ankle joint is responsible for motions such as plantarflexion and dorsiflexion, and the subtalar joint is responsible for inversion and eversion joint motions. As is shown in Figure 2.1, the true ankle joint is located above the subtalar joint; the reader can locate their own subtalar joint at the protruding end of the fibula, on the medial (inner) side of the AJC. It is important to note that the two subjoints are connected in series, and therefore their rotations are uncoupled. Specifically, plantarflexion of the joint and then joint inversion results in a different set of motions from inverting prior to plantarflexing. [9]
Subtalar
\
True
Joit Ankle
1-n
La:itertal
ViewI
Anterior View
Figure 2.1: Ankle Joint Complex
The axis convention shown in Figure 2.1 will be used. The x and z axes in the figure will form the ground plane; the x-axis is aligned with the longitudinal direction of the foot, and the y-axis is aligned vertically, about which there are two sources of rotation. The primary source is tibial/fibula movement, which is not actually a rotation in the AJC. When the lower leg is held still, the AJC provides rotation about the y-axis via a combination of motions of the two subjoints. When the foot is rotated inward, while constraining the lower leg, the motion that is seen is actually a combination of plantarflexion and inversion. It is for this reason that during such motion, the flat of the foot cannot be held parallel to the ground and will be observed to tilt up at an angle.
While the range of motion (ROM) of the AJC can be characterized using the axes of the subtalar and true ankle joints, it is still necessary to be able to measure the load capacity in the rotational direction about the y-axis for certain injuries. A low load capacity or pain upon
movement can indicate damage of skeletal tissue in the vicinity of the AJC. As such, the device will have torque sensors measuring torque in all three rotational directions, ox,
Qy,
and 07.2.2
Torque Sensor
It was postulated to use cartwheel flexures as torque sensors. A basic cartwheel flexure, along with its basic deformation geometry, is shown in figure 2.2.
A strain gages
-AA
unloaded loaded
Figure 2.2: Cartwheel flexure in unloaded configuration (left), and approximate deformation mode (right)
Strain gages are bonded to the flexure blades. In order to mitigate environmental factors such as temperature fluctuations, the strain gauges are placed in a Wheatstone bridge circuit. The outer ring of the cartwheel flexure grounded while the inner ring is rigidly attached to the rotation of the patient's foot, creating measurable deflection in the blades of the cartwheel flexure.
The torque applied to the sensor is linearly related to strain, which makes the flexure modules simple to calibrate using the process detailed by Ma [10]. The calibration is done by bolting a lever arm to the inner ring and hanging increasing loads from the end of the lever. This yields the constant K in the equation 0 = K * Tapplied. During calibration, the relationship
between torque and angular rotation is also recorded. Thus for a given strain reading, both the applied torque and the resulting angular rotation can be calculated, which can be differentiated to find angular velocity and power. Simple cantilevered-beam deflection models can be used to calculate force.
2.3 Device Protocols
The cartwheel flexures are set up as shown in Figure 2.3. The first round of preliminary tests have been completed. The subject stands on the platform with one foot strapped in and the other resting on another platform of equal height. Then the subject applies as much force as possible for a few seconds each in first plantarflexion, then dorsiflexion, then inversion, and last eversion. This gives us the maximum torques in each mode of rotation. For power readings, the subject applies a high impulse, forcing the foot plate to rotate as fast as possible.
mx cr cx crsion
llcxurcs
Figure 2.3: Prototype with flexures
Other protocols that test the functional strength of the ankle joint are being investigated and will be implemented during a clinical, for which preparations are currently being made. Among the protocols to be evaluated are the Starr-Excursion Balance test (SEBT) and the Unipedal Stance test (UST). Range of motion cannot be measured easily with the current prototype, so this study will focus on validation. Improvements will be made so that in future prototypes, the range of motion will be measured through either one of two methods: (1) extremely large motion flexures (>0.5 rad); (2) a semi-automated process that depends on the torque applied. For method (2), as long as the torque applied is above a certain number, a motor will rotate the foot plate slowly; when the torque applied falls below that number, the motor will stop, and the limit of the AJC's ROM will be measurable with just the flexure's ROM.
CHAPTER
3
DESIGN AND BUILD
3.1 Functional Requirements
The first step in the design process was to establish the functional requirements for the device, which are listed in table 3.1. The functional requirements were mostly dependent on what the customer wanted the device to do.
Table 3.1: Functional Requirements for the Ankle Rehabilitation Device
Functional Requirement Reason
1. Simulate AJC motions (zero translational DOFs and all three angular DOFs) from a given foot position; rotate -0.09 rad in each DOF when the foot position is set
2. Accommodate up to size 15 (US) feet 3. Support a load of up to 91 kg
4. Be adjustable to different foot positions within the range of 0.8 rad / 0.2 rad for
plantar/dorsiflexion and 0.8 rad / 0.2 rad for inver/eversion
5. Accommodate different foot anatomy with variations of up to 15 mm in the vertical distance between the true ankle joint and the subtalar joint, and 25 mm in the vertical and horizontal distances between the subtalar joint and the bottom of the shoe
Large displacements are required to calculate power readings. Additionally, an interface that doesn't give under load will stress the ankle joint and cause more pain than is necessary The 99th percentile shoe length is 330 mm [11] This is the maximum weight we expect a test subject to exert on the device
The device must be able to measure ankle Dutput throughout the ROM of the ankle
Different patients have different developments in their feet and AJC. Additionally, shoe sizes vary greatly
6. Have stiff flexures with maximum angular The platform must feel like it is as stable as the displacement of 0.000 15 rad for pseudo-static ground so that the patient does not falter or feel measurement in certain tests such as the unipedal unstable while balancing on one leg.
stance test
7. Be able to switch out flexures for different Functional requirements 2 and 7 require
tests within 60 seconds different flexures.
It should be noted that requirements 1-4 were functional requirements for the
p-prototype. Functional requirements 5-7 were added to accommodate feedback from users and to address shortcomings of the machine identified during experiments.
3.2 Design Concepts
Using the initial functional requirements (1-4), design concepts were generated. These are discussed in the following sections.
3.2.1 3-Axis Rotation in Series
The
p-prototype
currently being used is based off of this concept. This concept mimics ankle motion by having its rotations in series in the same order as those of the AJC. That is, ground, the first stage, is connected to a second stage that rotates about the y-axis. Then the second stage connects to a third stage that rotates about the z-axis. Finally, the third stage connects to a fourth and last stage that rotates about the x-axis. A rendered model of the initial concept is shown in Figure 3.1.Figure 3.1: 3-axis rotation in series concept
3.2.2 Nested 4-Bar Linkages
A 4-bar linkage has the property that, when the bottom linkage is fixed, the top linkage rotates about a point in space which is the intersection of the extended side linkages. By adjusting the angles or the lengths of the side linkages, it is possible to adjust the height of the point in space. While the point of space does shift during motion, for a point 102 mm above the top linkage and for 0.09 rad of rotation, it does not shift more than 2.5 mm, which is not significant. The ROM of the AJC can be simulated by placing one 4-bar linkage on top of another 4-bar linkage, but rotated 1.57 rad so as the rotations are perpendicular to each other. There is also the option of nesting the 4-bar linkage such as is shown in figure 3.2. This allows the rotations to be decoupled and be independent of each other.
Figure 3.2: Nested 4-bar linkages concept
Ergonomically, this design has the advantage that the flexures do not have to be in line with the rotational axes. This allows the device to be much more compact and for there to be no components that might come into contact with the patient. With the 3-axis design, the components have to be sufficiently large to ensure that no contact occurs. That also means that any foot position adjustment mechanisms have to be integrated into the flexure modules instead of being able to tilt the entire torque sensing platform, forcing the design to be complex. The 4-bar linkage design has no such complications and can be placed on a separate independent platform that changes position.
3.2.3 Concept Assessment: Weighted Cost-Comparison Chart
Although the 4-bar linkage design seems to hold promise, after careful evaluation of each concept with respect to the functional requirements, it was determined, using the weighted cost-comparison chart shown in Table 3.2, that the 3-axis design fit our requirements better. However,
this evaluation was based only on functional requirements 1-4. The assessment result might differ with the additions of requirements 5-7.
Table 3.2: Weighted cost-comparison chart of concepts
cost manufacturability position data
flexure
AJC Score adjustment interpretation ROM simulationweight 2 1 2 2 3 .3 N/A
3-axis 2 2 1 3 3 3 32
4-bar 3 2 3 1 1 3 27
At the point of time of this assessment, we were unable to design a flexure for the 4-bar design that would allow a rotation of 0.09 rad. Even if such a flexure were viable, we would run into an issue with data interpretation. Because the flexure blades for the 4-bar design are placed radially far out from the center of rotation, the blades must deflect much more than the blades in a cartwheel flexure in order to achieve the same rotation. For large deflections, it is likely that the relationship between torque, strain, and angular deflection is nonlinear. This would result in a very extensive and complicated calibration process.
3.3
a-Prototype
In the spring term of 2009, the a-prototype shown in Figure 3.3 was constructed by a student colleague. All of the components were cut on an OMAX waterjet from one 7.9 mm sheet of 6061-T6. While the material cost was very low, the structure did not have enough rigidity to constrain deflections to just the flexures. The structure also could not support more than 5 kg and the deflections resulted in significant errors in the data. Additionally, large loads resulted in significant translational forces on the flexure blades. In order to minimize error, the loads on the flexure blades must be pure torque. In the
p-prototype,
this issue is addressed by the usage ofshoulder bolts and bushings to eliminate the translational degree of freedom in the mechanism and support the patient's weight.
FFlexure whee
FFexrre WhWhee
Figure 3.3: a-prototype [12]
The same cartwheel flexure design was implemented, with minimal changes for the
p-prototype. The dimensions and locations of the flexure blades were kept constant, while the outer ring was changed to a square shape to enable better nesting for waterjetting and for placement within the device. This new cartwheel flexure is shown in Figure 3.4.3.4
P-Prototype
3.4.1 Initial Design
In order to minimize the overall machine cost and build time, most of the components were designed to be Waterjet cut out of 12.7 mm polycarbonate. For larger pieces which would have to resist higher moment loads, rectangular aluminum tubes were used for their high
stiffness, low cost, and low weight.
There are 4 subassemblies, or stages, to the beta-prototype device, shown in figure 3.5. The first stage is the base, which is a 12.7 mm thick aluminum plate. The second stage is mounted to the base and allows for rotation about the y-axis. The third stage mounts onto the second stage and rotates about the z-axis. The last stage, which holds the foot plate, mounts onto the third stage and rotates about the x-axis. Stages 2-4 all consist of a 25.4 mm x 50.8 mm x
Figure 3.5: Initial design with stages labeled
3.4.2 Finite Element Analysis (FEA) and Shortcomings
First-order FEA was done on the polycarbonate pieces. Parts were isolated and static load cases with the patient's weight were simulated. For a typical polycarbonate part, this resulted in a maximum deflection of 0.2 mm, which is not significant when the end of the foot plate is expected to deflect more than 12.7 mm.
However, the
p-prototype
failed to be rigid enough as well. After further investigation it became apparent that torsional loading cases had not been appropriately modeled. While deflections on the order of 0.2 mm in the components are negligible, 0.2 mm at a radial arm of25.4 mm allows an unwanted deflection of about 2.4 mm at the end of the foot plate (radial arm
of 305 mm).
Additionally, the interface between the first (base) and second stages also had backlash that propagated throughout the structure. There were two sources of backlash, one of which is
that the second stage was constrained by one shoulder bolt in a single shear configuration. The second source of backlash was that the pin joint had too much clearance. The inner diameter of the bushings was about 0.127 mm larger than the diameter of the shoulder bolt, which allowed about 0.005 rad of unwanted rotation.
3.4.3 Angle Adjustment Mechanism
Shortly after the
p-prototype
was built, the customer requested that the device be made capable of testing ankle performance from different initial positions (plantarflexion or dorsiflexion) of the joint. Because the polycarbonate parts had to be remade with a more rigid material, it was decided to add in a basic spring-loaded pin-and-dial angle adjustment mechanism, such as is commonly seen in weight lifting machines, for the plantar/dorsiflexion mode. A close-up of the adjustment mechanism is shown in Figure 3.6.shoulder
bolt (pivot) dial with holes
at 100, 20" and
sp Fing-loaded
Other modifications included elimination of spacers and changing the shoulder bolt mount such that it was now in a double shear configuration. A rendering of the resultant device is shown in Figure 3.7.
Figure 3.7: Rendering of
p-prototype
Although the addition of the angle adjustment mechanism provided a better understanding of the device's potential, it also significantly increased the amount of backlash present in the machine. In order for the pins to easily slide in and out of the dial, the holes had to be made oversize by about 0.76 mm.
3.4.4 Modifications to Prototype
In order to run preliminary trials, it was crucial that backlash be mitigated further in order to minimize errors and improve the reliability and accuracy of data gathered from test subjects.
Backlash would also have added instability to the platform, which would have interfered with trials and the comfort-level of patients. Therefore two major changes were made to the prototype:
1. Removal of the y-axis rotation.
2. Installation of a leadscrew based angle adjustment mechanism.
The y-axis rotation was removable because it is not a critical component of ankle kinematics. For the proof-of-concept trial, it was sufficient to demonstrate the capability of the device to measure ankle output for plantar/dorsiflexion and inver/eversion. However, in the final version of the device, the y-axis rotation will be added back in for full diagnostics functionality. Figure 3.8 shows a close-up of the lead-screw angle adjustment mechanism.
3.5
Cartwheel Flexure Evolution
During preliminary testing, a subject applied a large impulse load to the device by simulating the first half of a jumping motion. Because the cartwheel flexure had only been rated for 11.3 N-m of torque, the flexure blades snapped. The original cartwheel flexures were adequate for the x-axis (inver/eversion) and y-axis rotational modes, but not for the z-axis (plantar/dorsiflexion) rotation because it consisted of much greater force applied over a greater rotation.
In order to improve the performance of the flexures, their load capacity and range-of-motion needed to be increased. We used 45 kgf (half the maximum weight of a subject), and a moment arm of 178 mm as the upper bounds for the load (horizontal distance from true ankle joint to front sole). Therefore we can expect to see a maximum of 79 N-m of applied torque.
Since the device uses two flexures per rotation, each flexure must be able to support 39.5 N-m.
3.5.1 Material Selection
The performance of the cartwheel flexures depends on two properties - the Young's Modulus E, and the yield stress -y. A lower young's modulus allows the flexure blade to deflect further under a given load; and a higher yield strength allows the flexure blade to have increased load capacity. Therefore materials with a low ratio of E will perform the best. Other factors to consider are fatigue, cost, material availability, and machinability. Material properties are shown in Table 3.3.
Table 3.3: Material comparison chart
material E (MPa) cy (MPa) E/ ay Fatigue $/6.35mm x 76.2im x 1.8m machinability
6061-T6 Al 69000 276 250 Low 45.62 95 Brinell
7075-T6 Al 69000 455 158 Med 162.05 150 Brinell
5160 Spring Steel 205000 669 306 High 36.64 Rockwell C30
4140 Steel 205000 414 495 Med 68.29 Brinell 243
Titanium grade 5 117000 827 142 Med 853.13 Rockwell C32
Although titanium has the best ratio of E its material cost is extremely high.
Additionally, titanium and steel are very tough to machine, which drives up the waterjetting cost. While, later, the finalized product may use higher performance materials, 7075-T6 Al is the best material all around for prototyping.
3.5.2
Fatigue Performance
The fatigue life of 705-T6 Al was calculated and graphed in Figure 3.10. Because we expected to replace the cartwheel flexures after each trial, we decided to design for a safety factor of 1.5, which corresponds to approximately 1000 cycles.
Cycle Life vs Safety Factor for 7075-T6 Al
- - -... .- - - --... 1.E+12 1.E+11 1.E+10 1.E+09 1.E+08 1.E+07 1.E+06 1.E+05 1. E+04 1.E+03 1.E+02 1.E+01 1. E+00 1 1.5 2 2.5 3 3.5 4 Safety FactorFigure 3.9: Cycle life versus safety factor for 7075-T6 Al
4.5 5
3.5.3
Flexure Geometry
In order to increase the rotation, a variety of cartwheel flexures with nested blades were designed and optimized with FEA. The more blades that are placed in series, the larger the range-of-motion will be for a given load capacity. Additionally, because the basic straight radial blade geometry is preserved, the angular displacement will still be linear with the applied torque. However, there are also space and fabrication considerations which must be accounted for.
Two designs were chosen for the plantar/dorsiflexion and inver/eversion axes. The results of the finite element analysis are shown in Figure 3.11, with the relevant parameters shown in Table 3.4.
URES (in) URES (in) 0.113 0,060 0 055 0 094 0.049 0.085 0044 0.075 0 0.066 00D33 0.057 0027 0.047 0.022 0.038 0.016 0.019 0 0005 - 0.009 01000 0.000 Figure 3.10: FEA of plantarflexion flexure (left) and inversion flexure (right)
Although the maximum expected torque is 39.5 N-m per cartwheel flexure, it was not expected that there would be a test subject in our preliminary trials that would be able to exert the maximum torque. Therefore, to maximize range-of-motion the cartwheel flexure for plantar/dorsiflexion was designed for an average person's maximum output torque of 28.3 N-m, using 45 kgf as half the weight and 128 mm as the moment arm. This torque is calculated for when a person is standing on the front soles of his feet.
Table 3.4: Flexure FEA results
Parameter Plantarflexion Flexure Inversion Flexure
Load 28.3 N-m 11.3 N-m
SF 1.5 1.5
AAngle 0.038 rad 0.065 rad
3.5.4
Flexure Geometry
To confirm the results of the FEA, a simple beam bending calculation was done. A simplified deformation model of a flexure blade is seen in Figure 3.12. Deflection of the flexure
blade is given by Equation 1, which is a modified version of the standard cantilevered beam bending equation.
L3
2F() FL3
3EI 12EI
Figure 3.11: Deformed flexure blade
For the plantarflexion flexure, there are five blades in total: one middle blade and two blades in parallel attached to both the inner and outer hubs. Therefore Fapplied= F/2. F is taken to be the force at the middle of the blades, which is at a distance 25.4 mm radially: 28.3 N-m / 25.4
mm = 1114 N. The modified displacement equation becomes:
2F(Lmiaie)3 2
F-
'outer-3 F L3 L2g _22F 2 Z 2 2 2miie + outer 3.1)
3E midaie 3Elouter 12E Imiddle Iouter
1114N (8.89mm) 3 (10.2mm)
3 1.73mm
_______=_/____+ 3) .7m
12 * 69000 * 106MPa 1.87mm4 1.08mm4 (3.1)
As the radius of the flexure is 1.75", the cartwheel flexure is predicted to rotate 0.038 rad under the maximum load of 28.3 N-m, which is the same as the FEA result.
For the inversion flexure, the blades are in a "w" shape, with the outer and inner blades in parallel. Thus Fapplied to outer and inner blades = F/2 again. The modified equation becomes:
2F%(Lmidle)s 8= 3Elmiaaie FL F L. 2( outer)3 2 Lnner)3 + E2ue + o 3EIouter 3Elinner=outer
F Lmiddle + Louter + Linner
12E Imiddle + 2 outer 445N (9.40mm) 3 12 * 69000 * 106MPa 1.08mm4 (12.7mm) 3 + (7.62in)3 + 2 * 0.234mm4 /
This corresponds to 0.068 rad of rotation, which is quite close to the FEA result.
(3.1)
CHAPTER
4
RESULTS
4.1 Measurements and Data
First, the flexures were calibrated using the setup described in section 2.2. The resultant data is shown in figures 4.1 and 4.2.
Calibration for Plantar/Dorsiflexion Flexure
0 .9 - ... --. -.
...
y =0.0564x +,0.201 0.7 0.5 CL 0.3--0 0.2 0.1 0 0 2 4 6 8 10 12 14 Applied Torque (N-m)Calibration for Inver/Eversion Flexure
1.8 1.6 1.4 1.2 1 0.8 0.6 0.4 0.2 0 y=0.195x+ 0 1 2 3 4 5 6 7 Applied Torque (N-m)Figure 4.2: Inver/eversion flexure calibration data and fit line
8
During experimentation, four test subjects were asked to stand on the device with feet placed approximately shoulder width apart. One foot was strapped into the device while the other foot rested on a platform of equal height. The subjects were then asked to exert force in the plantarflexion direction and to hold for about 20 seconds. Then the process was repeated for the dorsiflexion, inversion, and eversion directions. Data for subject 1 is shown in figure 4.3. Because the modes of ankle movement are coupled, application of torque about one axis also results in some torque being applied in the other axis as well. The maximum torques for each mode of movement and their coupled torques for the four subjects were organized into tables 4.1-4.4. All data is in N-m. .... ... ... ... ... . --.. - . -... .. -. ... .... ....... ...... ..... - - ...
...
...
... .... -... ... .- ... ...Ankle Torque Output
25 20 15 10 5 0 -5 -10 -15 -20 -25 - Inver(+)/Ever(-) - - - ---.- - - Plantar(-)/Dorsi(+) 100 150 200 250 300 Time (s)4.3: Ankle joint torque output for subject 1
Table 4.1: Subject 1 -female 47.6 kg - maximum torque values
Mode Plantar. Dorsi. Inver. Ever.
Max Plantar. 20 0 5 0
Max Dorsi. 0 14 4.5 0
Max Inver. 5 0 6 0
Max Ever. 7 0 0 8
Table 4.2: Subject 2 -male 70.3 kg -maximum torque values
Mode Plantar. Dorsi. Inver. Ever.
Max Plantar. 42 0 4 0
Max Dorsi. 0 19 0 2.5
Max Inver. 7.5 0 12 0
Max Ever. 4.5 0 0 9
Table 4.3: Subject 3 - male 72.6 kg - maximum torque values
Mode Plantar. Dorsi. Inver. Ever.
Max Plantar. 37 0 3.5 0 Max Dorsi. 0 28 0 3 Max Inver. 25 0 12 0 Max Ever. 23 0 0 12.5 50 Figure 0 ...
...-Table 4.4: Subject 4 - male 81.6 kg -maximum torque values
Mode Plantar. Dorsi. Inver. Ever.
Max Plantar. 47 0 3 0
Max Dorsi. 0 37 7.5 0
Max Inver. 6 0 12 0
Max Ever. 5 0 0 10
4.2 Error Modeling
Exert the same downward force multiple times on a single point on the foot plate, and the device will measure the exact same torque each time. However, it is unlikely that users will be able place their feet in the device exactly the same each time they use it. Because alignment of foot with the device is done visually, the rotational axes of the ankle joint will always be slightly misaligned with those of the device.
All of the test data was taken with the subjects' feet in a horizontal starting position. For small angular displacements, ankle torque can be thought of as a downward force applied at the front sole of the foot. Therefore vertical alignment of the rotational axes can be neglected in the analysis for this trial.
The horizontal alignment, on the other hand, can be off by as much as 5 mm in both the x and z axes. The error from rotational axis misalignment is a percentage function of the subject's foot's moment arm (horizontal distance from rotational axis to front sole of foot). For example, for the average moment arm of 128 mm, if the subject's foot is misaligned in the positive x direction by 5 mm, the torque applied in the plantarflexion direction will be greater by 5 _
128+5
3.7%. Conversely, the torque applied in the inversion direction will be smaller by 3.7%.
It should also be noted that inver/eversion errors will be greater than plantar/dorsiflexion errors because the moment arm for inver/eversion is much smaller.
Table 4.5 lists the moment arms of the test subjects and the corresponding error percentages.
Table 4.5: Error Percentages for Test Subjects
Subject Plantar/dorsiflexion Inver/eversion Plantar/dorsiflexion Inver/eversion No. Moment Arm (mm) Moment Arm (mm) Max Error (%) Max error (%)
1 103 35 4.8 14
2 127 51 3.9 9.8
3 130 45 3.8 11
4 135 48 3.7 10
4.3 Discussion
Inversion torques were limited to 12 N-m, at which point the foot plate collided with the side of the structure. Therefore it is expected that the maximum torque values for inversion should be higher for subjects 2-4.
The effects of joint coupling are easily observed. For all subjects, inversion and eversion motions also resulted in application of torque in the plantarflexion direction. When subjects plantarflexed, some inversion was also observed; when subjects inverted, significant plantarflexion was also observed. This suggests that the test subjects' ankle joints developed to naturally turn inwards while plantarflexing and vice-versa. It is also possible that geometric concerns such as the distance between the feet might have altered this pattern as well.
Differences in individual ankle joint development can be seen as well from these data. Eversion by subject 1 is stronger than inversion. Conversely, inversion is stronger than eversion in the other subjects. In subject 3, inversion and eversion motions resulted in the subject also applying roughly double the torque in plantarflexion. The large coupled torque suggests that subject 3's ankle joint is less developed in the directions of inversion and eversion. Therefore the ankle compensates and recruits muscles in largely the same motor pattern as seen in plantarflexion.
Subjects 2 and 3 show dorsiflexion coupling with eversion, while subjects 1 and 4 show dorsiflexion coupling with inversion. Plantarflexion did not show as much variation among the subjects. Therefore it may be the case that dorsiflexion is much more subject to individual ankle development than is plantarflexion.
CHAPTER
5
CONCLUSIONS AND FUTURE WORK
5.1 Discussion
The purpose of the research done is to provide physicians with a diagnostics tool that can quantitatively measure the severity of an injury by measuring the ankle joint's functional output. Torque and power output have been shown to be correlated with functional performance of the ankle joint. It has been shown that the ankle rehabilitation device can measure torque output. Such a device has the potential to enable more accurate diagnoses and improve the efficacy of treatment and rehabilitation.
The device was also able to highlight the coupled motions of the AJC. Plantarflexion and inversion motions always occur jointly and are not easily isolated. Individual developments in joint development were also evident. One subject's ankle was stronger in the eversion direction
than in the inversion direction, while all other subjects exhibited the reverse case. Additionally, two subjects displayed coupling between dorsiflexion and eversion while the other two subjects displayed coupling between dorsiflexion and inversion. Torque data from the device provides insight into how each subject's ankle has developed and moves, and may be very useful in a clinical setting. Further testing is needed to verify these conclusions.
Preparations for a clinical trial of the device involving a large number of patients (-50)
are currently underway. This study will be used as a clinical validation of the device in addition to developing or testing relevant testing protocols beyond the scope of simply measuring
maximum torques. Subsequent analysis will be done across groups of varying age, injury status, and physical ability. Among the protocols to be evaluated are the Starr-Excursion Balance test (SEBT) and the Unipedal Stance test (UST). Range of motion cannot be measured easily with the current prototype, so this study will focus on validation. Improvements will be made so that in the y-prototype, the range of motion will be measured through either one of two methods: (1) extremely large motion flexures (>0.5 rad); (2) a semi-automated process that depends on the torque applied. For method (2), as long as the torque applied is above a certain number, a motor will rotate the foot plate slowly; when the torque applied falls below that number, the motor will
stop, and the limit of the AJC's ROM will be measurable with just the flexure's ROM.
For the clinical trial, the
s-prototype
will be used. After validation and any further modifications, the y-prototype design will be finalized and built.5.2
Areas of Improvement
-
Issues with
p-Prototype
The initial
p-prototype
device was not designed to have angle adjustment capabilities. Although later on a mechanism was implemented, the rotation was about an axis that was translated from the cartwheel flexure's axis. This resulted in a misalignment error from the changing moment arm. Future mechanisms must be aligned with the cartwheel flexure's axis.Foot sizes can vary from 178 to 330 mm long. Other dimensions such as subtalar joint and true ankle joint locations are subject to individual development. Therefore the device must be able to account for different foot geometries and sizes.
Each pair of consecutive stages in the
p-prototype
are connected through a pair of flexures. One stage connects to the inner ring while the other stage connects to the outer ring.This causes flexure replacement to be complicated and difficult, as a large portion of the device has to be disassembled.
To address the shortcomings of the
p-prototype,
a y-Prototype was designed and is shown in Figure 5.1. D-spline vertical distance between bottom of foot and subtalar jointAngle adjustment is achieved with a leadscrew. The leadscrew passes through a threaded cylinder that rotates within a flexure coupler, as seen in the Figure above. The coupler is fixed to the outer ring of the cartwheel flexure by two 6.35 mm dowel pins, and is radially constrained to the shaft of stage 3. The inner ring of the flexure is fixed to stage 3 by a D-spline. When the leadscrew is turned, stage 3 and the flexure rotate together. Stage 3 also rotates within the ROM allowed by the flexure. The angle adjustment mechanism allows a ROM from -0.35 rad (dorsiflexion) to +0.79 rad (plantarflexion). A similar mechanism is added in for inver/eversion. Additionally, if the stiffness of the flexure is not high enough, i.e. it does not provide enough resistance, then additional flexures can be added on to the sides.
Stage 3 is set at 0.70 rad below the horizontal. This is because tan(0.70 rad) was chosen as an estimate for the slope from the true ankle joint axis to the rearmost point of the subtalar joint. Any deviation from this angle can be fine-tuned with the foot size adjustment mechanisms. These mechanisms control the distance between the subtalar and true ankle joints, and the distance between the subtalar joint and the bottom of the foot.
REFERENCES
[1] Suzuki, T., Bean, J., Fielding, R. "Muscle Power of the Ankle Flexors Predicts Functional Performance in Community-Dwelling Older Women." Journal of American Geriatric Society 49:1161-7, 2001.
[2] Bean, J. F., Vora A., Frontera, W. R. "Benefits of Exercise for Community-Dwelling Older Adults." Archives of Physical Medicine and Rehabilitation Vol. 85 Supplement 3: 31-42, July 2004.
[3] Griffin, L. Y. Essentials of Musculoskeletal Care. American Academy of Orthopaedic Surgeons: Sept. 2005
[4] Holmes, A., Delahunt, E. "Treatment of Common Deficits Associated with Chronic Ankle Instability." Sports Med. 39(3): 207-24, 2009.
[5] Ranu, H. S. "Miniature load cells for the measurement of foot-ground reaction forces and centre of foot pressure during gait." J Biomed Eng Apr; 8(2): 175-7, 1986
[6] Girone, M., Burdea, G., Bouzit, M., Popescu, V. A. "Stewart Platform-Based System for Ankle Rehabilitation." Autonomous Robots 10: 203-12, 2001.
[7] Deutsch, J., Latonio, J., Burdea, G., Boian, R. "Rehabilitation of Musculoskeletal Injuries Using the Rutgers Ankle Haptic Interface: Three Case Reports," Eurohaptics Conference, Birmingham UK, 6 pp. July 1-4, 2001 (in press).
[8] Click, F. P., Bellew, J. W., Pitts, T., Kay, R. "A Comparison of 3 Hand-held
Dynamometers Used to Measure Hip Abduction Strength." J Strength Cond Res 17(3): 531-5, Aug 2003.
[9] Arndt, A., Westblad, P., Winson, I., Hashimoto, T., Lundberg, A. "Ankle and Subtalar Kinematics Measured with Intracortical Pins During the Stance Phase of Walking." Foot and Ankle International 357-365, 2004.
[10] Ma, R., Slocum, Jr., A. H., Sung, E., Bean, J. F., Culpepper, M. L., "Torque measurement via Compliant Mechanisms". Manuscript submitted to the ASME Journal of Mechanisms and Robotics, August, 2010.
[11] Templer, J. "The Staircase: Studies of Hazards, Falls, and Safer Design." Massachusetts, USA: MIT Press, 1992.
[12] Ma, R., Slocum, Jr., A. H., Sung, E., Culpepper, M. L., Bean, J. F., "Ankle-Rehabilitation via Compliant Mechanisms." Conference paper and poster presentation at the Design of Medical Devices Conference in Minneapolis, MN, April 13-15 2010.
APPENDIX
ELECTRONICS
A.1 Strain Gages
Catalogue page from:
http://www.omega.com/ppt/pptsc.asp?ref=SGDLINEAR 1-AXIS &Nav=pree02
SGD-3/120-LY1 1 S55 120 SGD-3/120-LY131 55 1 120 SGD-3/120-LY41 SGD-3/120-LY43 49 49 120 120 3.00 1.50 7.80 (0.118) (0.059) (0.307) Linear pattern, grid width narrow
120 0 3.80 (0.150) Ribbon Leads ST 5.5 Ribbon Leads AL 4 5.5 Solder Pads Solder Pads __________ .1 i I i '1 i ST AL SGD-51350-LY11 S65 -M1Y6I3|d"CTT-> 6-] Tn~~amm - -met 350 350 4.50 3.20 9,80 (0.177) (0.126) (0.386) Sinear nttrn 5.20 (0.205)
SGD-5/350-LY41 55 350 medium size
350 Q
Leads not SGD-5/350-LY43 55 350
* Maxim=n pemitted bridge energizing vdtage (Vrmsk. In- ... ... eNote: For strain gage accessoies see pages E-56 to E-59,
to 24 p g. .... Ordering Example: SGD-4/120-LYl3, 38 mm grid
249pkgS..1...0% 120 nommat-resstance strain gage. 959.
50 and up and OEM ..Consult Factory
lb TYPICAL STRAIN GAGE INSTALLATION
Ribbon Leads from Strain Gage or User Supplied
- Fine Gage Wire (30 AWG)
See page E-69
Adhesive, See page E.-67
Instrumenti 20 to 28 AW
See page E
-Bondable Terminal Pads (BTP) for Stress Relief and Junction for Different-Gage Wires, See page E-63
Ribbon Leads 17 Ribbon Leads AL 12 Solder Pads ST Solder Pads AL ST = Steel BTP4 gd AL = Aluminum Gagee t Dimensions Key: on Wire *A+ G ,s9 g-- I-GRID
A: Active gage length
B: Active gage width CARRIER C: Matrix length D: M~atrix width Shown actual size 7.80 mm Leads not shown Shown actual size 9.80 mm I I
A.2 Data Acquisition Instrument
Catalogue page from:
http://www.dataq.com/products/obsolete/di 1 94.html
UDATA
DI-1 94RS and D1454RS* Starter Kits
neINDAQ Resourcl
Two Digital Inputs for
Remote Start/Stop and
Remote
Event Marker
Control
The )l-194RS and D1-154RS*, )NrAQ's four-channel data acquisition starter kits.
are a low-cost way to experience WIND)AQ software,. now with more features and capabilities than ever bsefore. With these starter kits, you can digitize virtually any transducer's analog output signal and record it to your PC's hard disk. Xt the same time. view the transducers output on vour PCs monitor in a triggered sweep
toilloscope-like ' or scrolling chart re otrder-like) display format.
I Our starter kits provide a taste of the
exceptional power and speed possible with WINIl.Q software. They provide
12-bit tDI-1.4RSi and r-hit iDl-194Ri
measurement accuracy, a L1V analog me.surement range. up ) 240 sampleW
second throughput. and four analog iput
channels. A CD demornstrates WtNDI w Waveform Browser ,WW Bw i. our playback
and analysis software, hut to get a hands-on illustratihands-on of the data recording and display capabilities X: \ND v./Lie, you
nced a Lil-I54RS or 1)1-154RS starter kit When connected to your PC's serial port. these starter kits allow You to record.
display. and analyze data use our Own
signals. The kits ship with W INDLite ikccrdinu Software and Playba and
\nahs si voflwarci I lUta aequimton
rates up to 244) sampies per eeoad are
supported for Windo s 2i00 and X.
Self-Powered Advantage The Dl-154RS and D1-I 94RS derive their power directly fron the Rs-232 serial port to which it is connected- no batteries to replae or external power supplies to
More Capabilities
The DI-154RS and DI14RS starter kits
are equipped with t- dit inputs for remote start/stop and rei Ate event marker
control.
Included ActiveX Control Library
Both starter kits are provided with an ActiveX Control Library thal allows you to program the starter kits fronm any Windows programming env ironment.
Free Data Acquisition Software
Our WINDAif/Lite daa acquisition software offers real time display and disk streaming for the Windows environment. Their real time display can operate in a smooth scroll or triggered swecp rde of
operation, and can be scaled into Any unit of measure. Event markers with comments allow you to annotate your data acquisition session with descriptive informaion as you're recording to disk.
Raise your productivity to new heights with WINlDAQs unique multitasking feature. Record waveform data to disk in the backiround while running any combination of programs in the foreground - even WINDAQ Waveform Browser playback software to review and analyze the waveforni data as it's being stored! DA AG
£eAT
The D)-194RS Module with the WINDAQ Resource CD. screwdriver, and cable--alt included with each starter kit. D-154RS* module case is identical
WINDAG Software Specifications Disk and Display
Max rate t dis: Max rate to di play:
Display Modes:
Sltrage Nhdes: Display compessin atios: Dlispayed Tic i:
Time and Dtla SaMnping:
Max etnas markrus:
Wasflnn Display Scaling
Sceen Sealing gee chaand:
Engineeedng Ucttni*Comirsis
Hand Copy
Daia Stormg- iknuat
Wavefera Measummts (_wu -. tj -C I)h- n
Curor-basd dual-potit
Cur-mbaNsd (faq vs. ampuaudet
Waetn Anaaysit
Statitcs:
Frequency: Advanced CODAS analy-is:
Wafdam Export
Hardwan Requirements
Mnt Hiardwar Sample Rate Mx Hardwace Sarn ple r te
Unhmsited
aersitlan- freeze. trrgered.inest-yer-ed. Lksjoined at alt sample rates Cc'ainaous, pre-ur post-trigge
1:1 tol:L9AD
I to 32 LI4 p-r tile
Wa r esnn expansi. octn- sAdion, and -::isce
f=m+b per chama tel pr-A d screetn estinrous fAom
Ye complement
-pitdeeasun ts p
:n scalibrated units: elapsd rimse. rime
and date at cursor
imec meaasure'ments c-t the sarne
or atss different channels: a:
Y-- atlue difference: two-point shope Sddi. num ofsamples Hlz:c -de
rte db: Frequen; a
nin. max: varianor: standard d' imton: mean; media- sum: sum
of squars. skewness: R MS: area:
-5I
iC t 16,114 pns ( IT:- t-' AI9
pis
rDf.i-Wave form ir.legrlaor: differentiatin:
samhmt cpeatoas rc ian.
a a :ra k aadtalle detec twn
WmSD) CCODIASI t ornat to
a; apredho'CSVL AYST.
\ SYSTANT. DAD'SP. CODAS.
-eealurpet Nasay and 5 N11 Am ne l or cnpa'ie KC raneiI
Window t t200 or XP. Nn mmory
egrmet evod that requi'r y
th prae isy stemt
Hardware Specifications"
Interface /O)
Baud Rate Analog Inputs
lNumber A inixst channels:
kn!ut type:
Atnalo& Re-sdson:
A/D comversin method:
Sampting Bate: Relatiwe Accuracy: (tev tarPrtctin: lIn Impedane: Digital inputs Nemittw of inputs: Mimimum high kevet: Miamum tow level:
RS 232 44A Sinsdc-endci D1-14RS:- 12-bi S tescesiv apprinadn DAF194RS:03% i D0 i154RS: 025%> 10V t210V peak 2int duns 34 MV Digital Outputs Nttmharof cstputs: I Pwer Requirmaen
Curnt: Less than 4 A
Sr: Drv fr -232 p
Software Included
DM 94RS: WrtDacttite mnahdes Recoedieg and Playback sttwatr
Dl-iS-RS: D1-154RS: W:4w4 lie ditaaes
Recording and Playbxack soeiwaret
*Sgeilcatio are forl bosh the D 94RS and D-I 54RS unless mated 1theris
INo foe gemenl purpose s--Reserd fo- usea by Wa- Software
Ront End, Schematic Orderin Guide
\I. \ un
Data Acquisition Product Links
F" cL er :c >o Qmtopage 5
Dat 4"adson Dan L~gger Char Recorder ihemocrctple CzOc os'cope
-5
Description Order Number
DI-194RS Starter Kit 11- 194RS
4-channel 10-bit data acquisition starter kit.
D1-154RS Starter Kit OBSOLETE
4-channl 12-hbit data acquisiion starter kit
WDATAQ
EINSTRUMENTS
241 Springside DriveAkron. (hio 44333 Phone: 330-668-1444Fax: 330-666-5434 wwwadataq.com speiiain


![Figure 3.3: a-prototype [12]](https://thumb-eu.123doks.com/thumbv2/123doknet/14677288.558275/22.918.104.812.217.419/figure-a-prototype.webp)

