HAL Id: hal-02195763
https://hal.archives-ouvertes.fr/hal-02195763
Submitted on 21 Apr 2020HAL is a multi-disciplinary open access archive for the deposit and dissemination of sci-entific research documents, whether they are pub-lished or not. The documents may come from teaching and research institutions in France or abroad, or from public or private research centers.
L’archive ouverte pluridisciplinaire HAL, est destinée au dépôt et à la diffusion de documents scientifiques de niveau recherche, publiés ou non, émanant des établissements d’enseignement et de recherche français ou étrangers, des laboratoires publics ou privés.
From the River to the Fields: The Contribution of
Micromorphology to the Study of Hydro-Agrosystems in
Semi-Arid Environments (Phoenix, Arizona)
Louise Purdue
To cite this version:
Louise Purdue. From the River to the Fields: The Contribution of Micromorphology to the Study of Hydro-Agrosystems in Semi-Arid Environments (Phoenix, Arizona). Daniel A. Contreras. The Archaeology of Human-Environment Interactions : Strategies for Investigating Anthropogenic Land-scapes, Dynamic Environments, and Climate Change in the Human Past, Chap. 3, Routledge, pp.38-96, 2016, 9780367872687. �hal-02195763�
3 From the River to the Fields
The Contribution of Micromorphology
to the Study of Hydro-Agrosystems
in Semi-Arid Environments
(Phoenix, Arizona)
Louise Purdue
Abstract
This chapter presents a field and laboratory approach for better under-standing human-environment interactions in past agricultural societies in semi-arid environments. The field approach aims at studying the formation and evolution of anthropic landscapes based on a geomorphic approach to fluvial dynamics, combined with the geoarchaeological study of irriga-tion systems, considered as anthropic and environmental structures, and connected agricultural fields. To frame these dynamics chronologically and provide a more precise description of environmental and social dynamics (e.g., dynamics of deposition, flooding events, vegetation cover, fire regime, slash and burn, manuring), systematic sampling for chronology and soil analysis (micromorphology) is conducted in these three connected environ-ments. The selection, description, and quantification of markers in soil thin sections allows for the statistical classification of past dynamics, interpreted based on historical or current references. The multiplication of local stud-ies is key to documenting large-scale socioenvironmental dynamics, which can then be juxtaposed with climatic, archeological, and demographic data. This approach is illustrated through the socioenvironmental study of the hydrosystem of the Salt River in the semi-arid Phoenix Basin (Arizona) and the Hohokam irrigated agrosystem. This case study demonstrates how the field and micromorphological study of two irrigation canals and intertwined fluvial deposits at the headgates of one of the largest canal systems, Canal System 1, in use from the seventh to the fifteenth century A.D., provides vital information about past water management and land use as well as fluvial regime and climate change.
Introduction: State of the Art and Objectives
Water management has contributed to the construction and organization of human communities since the emergence of the first agricultural socie-ties. Societies have built water systems for food production, energy, indus-try, transport, and/or commerce purposes, and they have dealt with water
From the River to the Fields 59 resources facing the combined effects of social (water need) and environ-mental constraints (water availability and capacity). As a result, the evo-lution of water availability and allocation strategies through time and its impact on cultural shifts is a socioenvironmental question necessarily raised by researchers. Approaches to the study of water systems and irri-gation communities have traditionally revolved around the fields of theo-retical anthropology (e.g., Wittfogel 1957; Mitchell 1973; Netting 1974; Service 1975), ethnography (Hunt and Hunt 1973; Lees 1973; Downing and McGuire 1974; Hunt and Hunt 1976), social history (e.g., Glick 1996; Nabhan 1986), and spatial archaeology (e.g., Gentelle 1980; Bruins et al. 1986; Francfort and Lecomte 2002; Mouton 2004; Ortloff 2009). In par-allel, researchers have developed high-resolution tools to study water net-works, such as geomatics and geophysics (eg., Jones et al. 2000; Powlesland et al. 2006; Keay et al. 2009), as well as aerial and satellite imagery (e.g., Sanders 1982; Fowler 2002; Pournelle 2003; Wilkinson 2003; Clarke et al. 2005), and have adapted new approaches from such fields as environmen-tal history (e.g., Crook et al. 2008), geography and geomorphology (e.g., Marcolongo and Morandi Bonacossi 1997; Harrower 2006), and hydrol-ogy (e.g., Orengo and Alaix 2013).
These various approaches and methods have allowed for the study of water systems on the one hand (water management and related social struc-tures) and water networks on the other (spatial structure and links with the landscape and river systems). To understand past agricultural communities, it is necessary to reconstruct the environment they lived in, adapted to, and modified through time. The agrarian landscape they built, which is defined by agricultural practices and production, has evolved over the long term under the influence of climatic fluctuations and human activity. Some recent large interdisciplinary projects have focused on the interaction between cli-mate, water management, and human adaptation (e.g., Long Term Vulner-ability and Transformation Project coordinated by M. Nelson (cf. Nelson et al. 2010). However, the study of ancient water systems themselves, as signatures of both the agrosystem and the hydrosystem, is still scarce. These systems are rarely considered as objects which can be studied at various spa-tial and temporal scales and connected to agricultural fields and practices, as well as local and micro-regional geomorphic changes (e.g., Wilkinson 1998; Berger 2000; Beach et al. 2009; Purdue 2011; Bernigaud 2012).
To reconstruct the dynamic interplay (phases of stability and instability) between the agrosystem and the hydrosystem, diachronically and synchroni-cally, it is necessary to reconstruct fluvial dynamics, irrigation canal function and management, and agricultural practices. This chapter presents an over-view of how to study these three connected dynamics and their interactions based on a systematic field geomorphic, geoarchaeological, agronomic, and archaeological approach refined by laboratory analysis. Chronologi-cal control is necessary to understand the temporalities of fluvial dynamics and water and soil management, but I focus here more specifically on the
geoarchaeological and micromorphological approach. Micromorphology is the description of soils at a microscopic scale, based on the interpretative concepts of petrography and pedology (Kubiëna 1938; Brewer and Sleeman 1960; Bal 1973; Bullock et al. 1985; Fédoroff and Courty 1994; Stoops 2003) and is considered as one the major tools for understanding landscape evolution when correlated with other environmental analyses (Gebhardt 2000). Micromorphology has been used widely in semi-arid fluvial envi-ronments, where research has mainly focussed on paleoenvironmental and climatic issues (e.g., Courty 1990; Fédoroff and Courty 1989; 1999; Courty and Fédoroff 1999; Singhvi and Derbyshire 1999). In agrarian contexts, micromorphology has aimed at understanding the properties of cultivated soils (e.g., Courty and Fédoroff 1985; Mathieu and Ruellan 1987; Courty 1990; Verba et al. 1995; Hallaire et al. 1998; Lebedeva-Verba and Ger-asimova 2009); these studies often serve as references for recognition of past agricultural practices (e.g., Courty 1990; Verba et al. 2002; Presley et al. 2004) and estimate the impact of long-term agriculture on current soil properties (e.g., Wilson et al. 2002; Goodman-Elgar 2007; 2008; Sandor et al. 2007). The micromorphological study of hydraulic structures, in con-trast, is nearly nonexistent in arid environments (Purdue et al. 2010; Purdue 2011) and very rare in temperate environments (e.g., Gebhardt 1988; 1993; Courty 1990; Leroyer and Krier 1991; Berger 2000). The combination of signatures of human practices (canal cleaning, slash and burn, irrigation practice, manuring) and hydroclimatic dynamics (flow, sediment origin, erosion processes, sedimentary load, flood regime, water supply, vegetation development, fire regime) has rarely been used.
This approach and method will be highlighted through the example of Hohokam irrigation systems in the Phoenix Basin in central Arizona. Pos-sibly continuing and elaborating upon a tradition previously established by early agricultural groups, the prehistoric Hohokam people were dependent upon and more or less adapted to arid environmental conditions, especially fluvial dynamics. To survive, they built major irrigation systems as early as A.D. 100 (Henderson 1989), which persisted until A.D. 1450 (Haury 1976; Doyel 1979; Gumerman 1991). Their chronology is articulated around the Formative Period (A.D. 1–600), the Pioneer Period (A.D. 600–750), the Pre-classic Period (A.D. 750–1150), and the Classic Period (A.D. 1150–1450). Both social and environmental hypotheses have been put forward to explain these cultural shifts: warfare (LeBlanc 1999) and overpopulation (Ensor et al. 2003) on the one hand, and droughts and floods (Nials et al. 1986; Gregory 1991; Huckleberry 1999; Waters and Ravesloot 2001) or chan-nel metamorphosis and widening/downcutting events (Waters and Raves-loot 2001; Graybill et al. 2006) on the other. The cause of the “collapse,” however, is still in debate. A case study (Riverview at Dobson, AZ U:9:135 (ASM)) in Mesa, Arizona, provides an example of how environmental sur-roundings, fluvial dynamics, and human adaptation can be understood at a local scale to help answer these socioenvironmental questions.
From the River to the Fields 61 Approach and Methods
The Field Approach
To understand the interactions between the hydrosystem, water systems, and the agrosystem in the field, various spatial and temporal scales should be considered (i.e., geomorphic unit per system, per canal, and per strati-graphic unit; and phases of stability or cultural shift) (Chouquer and Favory 1991; Chouquer 2000). The field approach requires three steps: (1) First, it is necessary to reconstruct the current and past environmental framework based on a topographical, hydrological, and geomorphological study of alluvial archives, which allows for the understanding of lateral and verti-cal river dynamics through time (aggradation, incision, fluvial migration); (2) Second, hydraulic networks can be studied from a geoarchaeological per-spective. Fossil traces are identified and mapped using aerial photographs or historic maps, for instance. Transversal or longitudinal crosscuts of hydrau-lic features allow the reconstruction of episodes of canal construction and abandonment and the link between these temporalities and the dynamics of the hydrosystem. Indeed, canals are often filled with clastic or geochemical sediments which record paleoecological dynamics (Bertrand 1975) as well as local and regional hydrosedimentary dynamics ranging from short-term events (storms, floods, vegetation development) to long-lasting environmen-tal shifts (fluvial metamorphosis, incision, soil erosion) (Berger 2000). The major limits in the geoarchaeological study of canals are, first, their regular maintenance that removes sedimentary information and, second, the hier-archy of water systems, with headgates acting like sedimentary filters. This approach therefore requires diachronic and synchronous systematic studies; (3) Last, it is possible to identify and study cultivated deposits (more easily discernible towards the terminal end of the network) which are fed with water and sediments from adjacent hydraulic structures. The color, texture, structure, and inclusions in cultivated deposits are a reflexion of human practices as well as the dynamics, management, and efficiency of the irriga-tion system.
Traditionally, numerous samples for paleoenvironmental studies and chronology are collected in these three environments of study. Sherds recov-ered in irrigation canals, if well preserved, can provide a more or less precise period of construction or use. However, it is usually necessary to derive radi-ocarbon dates from organic material. Datable materials from the base of hydraulic structures can provide a date of construction, while datable mate-rial from upper fills corresponds to abandonment. Chronological assess-ments related to each episode of visible maintenance and natural erosion are also crucial. Alternative methods, such as OSL dating, can be adopted (Berger 1986). The period of use of the connected agricultural fields can be estimated based on chronostratigraphy, and numerous sherds are tradition-ally encountered in this environment. Fluvial deposits should also be dated,
by radiocarbon, or OSL when organic material is scarce. Bulk sediment samples in these three environments will allow pursuit of paleoenvironmen-tal studies, such as paleobotanical studies, ostracodes, and diatoms (Palacios-Fest 1994; Palacios-(Palacios-Fest et al. 2001), and soil studies, such as grain size and geochemical analyses. Micromorphology is much less commonly employed in such contexts, but can be used to distinguish events not visible through more common methods (fire signals, origin of the sediments, etc.) (Gebhardt 1988; Leroyer and Krier 1991; Berger 2000).
The Micromorphological Approach
Sampling Strategy, Processing, and Study Protocol
When simultaneously studying fluvial deposits, sediments that fill hydraulic structures, and associated agricultural fields, there are various lines of inquiry which allow one to understand past socioenvironmental dynamics such as sedimentary, pedological, ecological, and anthropic processes. To properly understand these processes, micromorphological sampling is usually con-tinuous in every deposit studied or disconcon-tinuous within homogeneous units (Courty et al. 1990). Blocks of 12 × 6 × 6 cm are sampled and wrapped in plas-ter bands and manila paper to protect them. The samples are then processed according to P. Guilloré’s (1983–1987) method. Thin sections are observed with the naked eye, under a binocular, and last under an optical microscope with plane polarized light, cross-polarized light, and incident light for the description of microfabric and microfacies (Goldberg and McPhail 2006). Topics of Enquiry in Fluvial Deposits, Canal Fills, and
Agricultural Fields
Sedimentological, pedological/pedoclimatical, ecological and anthropic processes have their own signatures—markers that enable differentiation and possible interpretation (cf. Table 3.1). When reconstructing sedimen-tary processes, we aim at understanding the environment of deposition (e.g., alluvial, eolian), the fluvial dynamic (e.g., flooding event, water stagnation, and rhythmic sedimentation), the origin of the sediments, and their hydro-climatic significance. Pedological and pedohydro-climatical studies include rhythm in sedimentation, episodes of water stagnation, evaporation, and presence of salts. The type of data selected are the microstructure (size, form, and arrangement of aggregates and grains), soil crusts (Evans and Buol 1968; Chen et al. 1980; Bresson and Valentin 1994), and three pedological fea-tures: biological features (Courty 1994), textural features, and crystalline features such as oxidation and reduction processes or the accumulation and depletion of carbonated/gypsum/salt crystals (e.g., Sehgal and Stoops 1972; Monger et al. 1991; Courty 1994). Investigations of ecological dynamics
From the River to the Fields 63 include the presence of vegetation and its type, origin, and impact on water level and flow, which provides information on the local to regional veg-etation cover, processes of erosion with the deposition of decayed plant matter, and also on the in situ plant growth and its kind (e.g., characeae, cyperaceae). Charcoals are also very relevant as they provide information about regional or local fire regimes (including slash and burn cultivation), its intensity, and the type of vegetation burned. Shells and ostracodes pro-vide signatures of typical water temperature and salinity, while the presence of excremental pellets is indicative of a well-aerated soil, specific humidity, and biological activity (Courty 1990). Lastly, human activities identified at the microscopic scale correspond to signatures of irrigation, slash and burn, tillage, and structures to protect hydraulic features. To identify these specific activities, micromorphologists traditionally study soil structure, porosity, organic matter, illuviation processes (coatings, e.g., Pal et al. 2003) and sur-face crusts (e.g., Bresson and Valentin 1994), and crystalline features (iron, carbonates, gypsum) (e.g., Alonso et al. 2004).
Data Quantification, Processing, and Interpretation
Qualitative descriptions are often used when thin sections are sampled to answer a specific question. However, in the context of systematic sampling, some quantification is necessary. The chart of semi-quantification proposed by Fitzpatrick in 1980 or the semi-quantification proposed by Harden (1982) and Dorronsoro (1994), which assigns a value of 1 to 100 (multiple of 10) to each interval of proportion or size, can be used on well-identified markers to identify large trends. Markers can also be described based on their presence or absence. Due to the subjectivity of these approaches, it may be preferable to quantitatively describe markers, e.g., by point count-ing (Eswaran 1968; Murphy and Kemp 1987; Amonette 1994) or by image analysis (e.g., Purdue 2011 for grain size studies).
Once all these markers are described, they can be classified by multivari-ate statistical analyses to compare and group synchronous sequences of sedimentation and/or paleoenvironmental dynamics (Berger 2000; Purdue 2011). While more and more studies provide keys for interpretation (eg. Stoops et al. 2010), these are not easily transposable to other environmental and archaeological contexts (Courty and Nornberg 1985; MacPhail 1986; 1990; 1992; MacPhail et al. 1987; 1990; Gebhardt 1993; Berger 1996). Also, interpretation often puts aside the principle of equifinality (Valentine and Dalrymple 1976; Pawluk 1978; Kemp et al. 1993). In order to mitigate both issues, it is necessary to compare archaeological data with samples from modern or historical contexts for whose dynamics we have written archives. Models of function and paleoenvironmental dynamics at the scale of the irrigation network and then the valley can be formulated. Ultimately, one can then put forward models of landscape evolution.
Case Study: Hohokam Irrigation Along the Lower Salt River, Arizona
Environmental Background: Climate, Geography, and Geomorphology
The Salt River watershed in Central Arizona covers an area of approxi-mately 35,000 km². The Salt River, 320 km long, originates in the White Mountains east of Arizona, in the Fort Apache Indian Reservation, at an average altitude of 3,500 m. The Salt River leaves the mountains near its confluence with the Verde River, its major tributary, and flows through the urban area of Phoenix until its confluence with the Gila River, tributary of the Colorado River, 37 km downstream. This area, referred to as the lower Salt River Valley in the Phoenix Basin, belongs to the Basin and Range Province (Gilbert 1875; Davis 1902), characterized by narrow mountain chains and low altitude fertile plains (300–350 m), gently sloping to the east (Fenneman 1931). The lower Salt River, dry today as a consequence of dam building, presents a channel-into-channel configuration (Gregory and Park 1974; Richards 1982), with flow contained in a braided channel during high discharges and a meandering channel set in a large floodplain (400 m) during dry years. This cut-and-fill floodplain is characterized by overbank aggradation, channel accretion (Nanson and Croke 1992), and gully erosion. Precipitation in this area is bimodal: average annual pre-cipitation reaches 190 mm (average from 1933 to 2015; Western Regional Climate Center 2015) with monsoonal summer precipitation, short and intense due to convective storms, and winter precipitation, long and less intense as a result of frontal storms, between November and March (Sell-ers 1965). Average monthly precipitation for these two seasons reaches 20 mm.
Intense urbanization and erosion of superficial formations precludes pre-cise geomorphic mapping of the lower Salt River Valley. The most substan-tial maps were provided by Péwé in 1978 and Pearthree and Huckleberry in 1994, and were completed by Cultural Resource Management projects upstream and downstream of the valley (Onken et al. 2004; Phillips et al. 2004) as well as recent publications (Huckleberry et al. 2013; Purdue 2013). Five terraces are generally described. The Pleistocene Sawik (T1, 15 to 72 m above modern river-bed level) and Mesa terraces (T2, 9–29 m) are morpho-logically very similar due to their carbonate content. The Blue Point Terrace (3–24 m above modern river-bed level) is composed of coarse gravels and rocks with calcium carbonate coatings. The Holocene Lehi Terrace (T3), composed of fluvial deposits, lies 1.5 to 6 m above the modern stream-bed level. Another lower terrace has been identified in parts of the lower valley (Huckleberry et al. 2013; Purdue 2013). Deposition only occurred on these two most recent alluvial formations during the last 2,000 years. A synthesis of the above-mentioned projects and publications has allowed identification
From the River to the Fields 65 of several phases: (1) Landscape stability and soil development occurred from the first century B.C. to the third century A.D.; (2) Fluvial and eolian accretion is recorded from that date until the ninth century A.D.; (3) A sec-ond phase of pedogenesis has been noticed between A.D. 800–950 with the development of cienegas in the direct vicinity of the stream; (4) Increasing flooding events are recorded between A.D. 900–1150 with fluvial morpho-logical evolution towards a braided system; (5) Signatures of a downcutting event (eleventh to twelfth century A.D.) are evident along the Gila River and its tributaries associated with soil development on the upper part of the Lehi Terrace; (6) The chronological interval between the fifteenth to the nineteenth century A.D. witnessed channel fill and floodplain accretion.
Archaeological Background: Hohokam Chronology and Irrigation Systems
Because they lived along the Salt and Gila Rivers in the semi-desert Phoenix Basin in Arizona, the Hohokam (A.D. 100–1450), like both their descend-ants the Akimel O’Odham (after 1694) and white pioneers (nineteenth cen-tury), were dependent on fluvial dynamics. To survive, the Hohokam built major irrigation systems as early as A.D. 100 (Henderson 1989), and con-tinued until A.D. 1450 (Haury 1976; Doyel 1979; Gumerman 1991). It was mainly during the Preclassic Period (A.D. 750–ca. 1150) that major canals were built and expanded (Doyel 1991), in parallel with an increase in set-tlement size, functional diversity, and social differentiation, the construction of ball courts, and the emergence of regional trade and networks (Gregory 1991). By the end of the Preclassic Period, 16 gravity-fed irrigation systems, some measuring nearly 30 km long, organized as a large “spider web,” were in use (Figure 3.1(a)). The transition to the Classic Period (A.D. 1050–1150) seems to represent a break in Hohokam social structure, shown by a major settlement reorganization (village aggregation, construction of compound walls, etc.), evolution in architecture, evolving ceramic production, decreas-ing trade and connectivity, and diversification in agricultural techniques and architecture (cf. Gumerman 1991). This new equilibrium and short-term reorganization was followed by the society’s collapse around the fifteenth century. The Salt River Valley subsequently remained unoccupied for a few centuries.
From a technical standpoint, Hohokam canals were organized in tertiary systems: main canals diverted water from the river and supplied secondary structures, the latter bringing water to tertiary canals, from which it was then evacuated into fields. In general, these tertiary canals were straight and regularly spaced, parallel or perpendicular to secondary canals. Head-gates probably controlled the entrance of water into the canals. In the lower Salt River Valley, salvage archaeology conducted over the last 20 years has enabled the creation of a very precise map of the irrigation systems (How-ard and Huckleberry 1991) (Figure 3.1(a)). Numerous paleoenvironmental
studies have also been conducted in irrigation structures themselves (e.g., Howard and Huckleberry 1991; Doyel et al. 1995; Hackbarth et al. 1995), but these have never been based on a micromorphological analysis.
The Riverview at Dobson Project
The Riverview at Dobson Project (AZ U:9:135(ASM)), which is nearly 32 acres in extent, is located south of the Red Mountain Freeway 202 and east of the Price Road, less than 1 km from the river (Figure 3.1(a)). Fieldwork was carried out in 2005 in collaboration with Arizona Museum of Natu-ral History and Arizona State University. This project, as well as previous projects in this area (Masse 1987; Ackerly and Henderson 1989; Mitchell and Motsinger 1998), unearthed more than 20 canals belonging to one of the biggest irrigation systems along the lower Salt River: Canal System 1. Their concentration in the area is favored by the presence of a narrow and low-elevation strip of land between the alluvial plain (currently the T3 Lehi Terrace) and the T2 Mesa Pleistocene Terrace. The canals exca-vated were oriented west-east and supplied water to the south and in areas of what is now Mesa, Tempe, Chandler, and the Gila River Indian Commu-nity. While numerous trenches were dug and canals encountered during this
project, I only studied two of them (T1 and T2).1 The study of canal profiles
so close to their headgates enabled simultaneous study of fluvial archives, irrigation canal fills, and signatures of maintenance. The socioenviron-mental signatures obtained also indirectly provide information about the amount of water supplied to the secondary and tertiary canals downstream. Unfortunately, these samples do not allow investigation of connected and well-identified agricultural soils. While some bioturbated fluviosols were encountered adjacent to the canals, we do not think they were cultivated in this central area of canal construction. As a result, while some agricultural fields were studied further downstream in this system (Purdue 2011), they are not presented here, as they cannot be clearly connected to the irrigation canals studied here.
Chronostratigraphy and Micromorphological Sampling
Two overlapping canals were observed in T1 (Figure 3.1(b)) (Canal 1a and 1b). The lower canal (Canal 1a) is built on top of finely prismatic brown silts
(T1, S VI)2 and measures 2.6 m deep and 1.4 m wide. Based on the
identi-fication of discontinuous stratigraphic limits between the strata, which correspond to traces of past cleaning episodes, we distinguished 6 clean-ing events within this structure filled with sand, silt, and clay and eroded in its upper part by a Salt River channel and flood deposits (T1, S VII and S VIII). Canal 1b was excavated into T1, S VIII. Much smaller in size than its predecessor, Canal 1b (75 cm deep, 75 cm wide) seems quickly filled by clayey deposits alternating with coarse sands. Charcoals recovered from the base of these fill deposits (T1, S24) provided a construction date in the interval
From the River to the Fields 67
A.D. 1030–11893 and we obtained a date of A.D. 1489–1651 in the upper
part of the canal fills (T1, S30)4 (possible post-abandonment date) (Figure 3.1).
Thirteen micromorphological samples were taken: 9 in the canal and 4 in flood deposits. Unfortunately, one went missing during transportation (T1, S VII).
Figure 3.1 (a) Geographic and geomorphic location of AZ U:9:135 (ASM); (b) stra-tigraphy and chronology in Trench 1 (West profile), AZ U:9:135 (ASM), with Canal 1a and 1b identified; (c) stratigraphy and chronology in Trench 2 (North-East profile), AZ U:9:135 (ASM), with Canal 2a, 2b, and 2c identified.
Three superposed canals were uncovered in Trench 2 (Figure 3.1(c)) (Canal 2a, 2b, and 2c). The lower one, Canal 2a (1.75 m deep, 2m wide), was dug into sandy silts rich in charcoals (T2, S VIII) dated to A.D. 596–
7525 (Preclassic Period), and is filled with fine deposits. After a first cleaning
episode, this structure was filled with cross-stratified sand and buried under two flood deposits (T2, S IXa and b). Canal 2b (1.25 m deep, 1.5 m wide) was then dug, but is also filled with cross-stratified sand and buried under new flood deposits (T2, S X). Canal 2c, wider and much smaller in size (2 m wide, 85 cm deep), was excavated into these deposits and is filled with alternating silty clay and laminated sands. One cleaning event was noticed. Numerous sherds were discovered in its fill (T2, S10) dating its use between A.D. 1000 and 1300 (Classic Period). Nineteen micromorphological sam-ples were taken, three of which were in the flood deposits.
Marker Selection
As mentioned in the methodological section, numerous markers can be selected depending on the initial question. In the Riverview at Dobson Pro-ject, the fill of the canals directly reflects changes in the Salt River flow. We therefore selected and systematically described 11 markers (Table 3.1). Their interpretation is based on reference materials from historic canals (Huckle-berry 1999; Purdue 2011) and geological formations (Purdue 2011), as well as pedological references (Soil Survey Staff 1975) and research on charcoal (Whitlock and Millspaugh 1996; Enache and Cumming 2006). However, we present here only the most relevant ones:
1 Flow intensity (texture obtained from image analysis; see Purdue 2011 for more details)
2 Sediment origin (mineral assemblage obtained by presence/absence, description, and counting of basalt grains followed by a multivariate statistical analysis integrating reference samples from the Salt River Basin (sedimentary basin) and Verde River Basin (volcanic basin)) (see Figures 3.2(b) and 3.2(d) and Purdue 2011 for more details)
3 Sediment transport (sedimentary structure, qualitative description) 4 Rhythmicity and rate of sedimentation (soil structure, qualitative
description)
5 Fire regime inferred from charcoal content (+, +++, +++) and size (< or > 125 µm)
6 Organic matter content (+, +++, +++) Results and Interpretation
EVOLUTION OF THE ALLUVIAL PLAIN
Out of the five flood events chronologically framed, four of them occurred between A.D. 596–752 and A.D. 1030–1189, and while modern agricultural
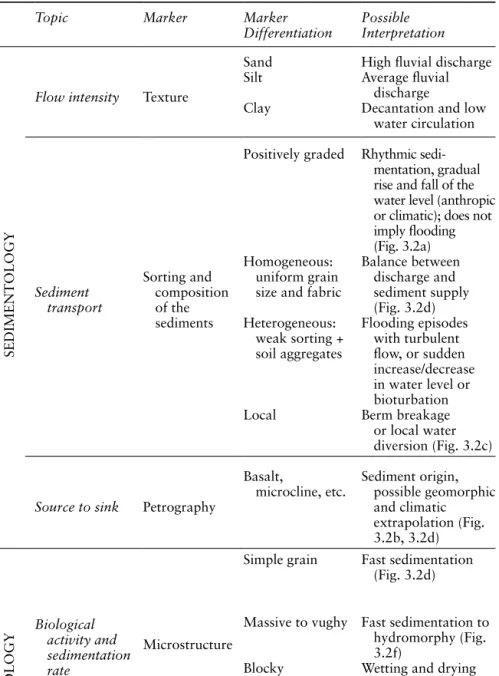
Table 3.1 Topical enquiry, micromorphological markers, and significance (Riverview at Dobson Project)
Topic Marker Marker
Differentiation Possible Interpretation
SEDIMENTOLOGY
Flow intensity Texture
Sand High fluvial discharge Silt Average fluvial
discharge
Clay Decantation and low water circulation Sediment transport Sorting and composition of the sediments
Positively graded Rhythmic sedi-mentation, gradual rise and fall of the water level (anthropic or climatic); does not imply flooding (Fig. 3.2a) Homogeneous:
uniform grain size and fabric
Balance between discharge and sediment supply (Fig. 3.2d) Heterogeneous: weak sorting + soil aggregates Flooding episodes with turbulent flow, or sudden increase/decrease in water level or bioturbation Local Berm breakage
or local water diversion (Fig. 3.2c)
Source to sink Petrography
Basalt,
microcline, etc. Sediment origin, possible geomorphic and climatic extrapolation (Fig. 3.2b, 3.2d) PEDOLOGY Biological activity and sedimentation rate Microstructure
Simple grain Fast sedimentation (Fig. 3.2d)
Massive to vughy Fast sedimentation to hydromorphy (Fig. 3.2f)
Blocky Wetting and drying cycles (Fig. 3.2e) Channel/granular High bioturbation and soil moisture (Fig. 3.2g)
Water presence
or absence Pedological crusts
Scarce vegetation, canal drying out, increased sensitivity to erosion
Topic Marker Marker
Differentiation Possible Interpretation
ECOLOGY
Fire regime
Charcoal % Intensity of the fire regime (Fig. 3.2j, 3.2k)
Charcoal size
Microcharcoal Regional fire (Fig. 2j), effect of bioturbation or granulometric sorting
Macrocharcoal
(> 125 µm) Local fire (Fig. 3.2l) Charcoal
shape Elongated Possible gramineae vegetation (Fig. 3.2k)
Vegetation cover
Organic matter % Vegetation cover
Organic matter shape
Fresh Local vegetation Humic Vegetation cover
(local to regional) (Fig. 3.2i) Aggregates /
microparticules Soil erosion Roots, phytoliths Type of vegetation
(Fig. 3.2h) Table 3.1 (Continued)
activity might have eroded other signatures, only 20 cm of arable land was identified on top of the last flood event dated after the sixteenth to seven-teenth century. Of the earlier four flood deposits, three deposited sediments with similar texture and sorting: T1, SV / T2, SVIII; T1, SVII / T2, SIXb; T1, SVIII / T2, SX (Figure 3.3(a)). These flood deposits are composed of weakly sorted coarse silts to sands (Figure 3.3(b) and 3.3(c)), rich in quartz grains, feldspar, pyroxene, sandstone, plagioclase, amphibole, and most of all basalt grains, whose origin and type has been traced to the Verde River Basin, tributary of the Salt River (Purdue 2011; reference sample shown in Figure 3.2(a)). The use of micromorphology in source-to-sink analysis allowed link age of mineral assemblages to precipitation regimes. Indeed, both the Salt and Verde basins are sensitive to winter and summer precipi-tation, as part of the bimodal regional precipitation pattern. However, the Verde Basin, as a result of its topography and high altitude, as well as its north-south orientation, is supplied mainly by the input of winter precipita-tion and snow. Higher discharges and larger floods occur during the win-ter along the Verde River (Graf 1983; Hirschboeck 1985; Ely et al. 1993; House and Hirschboeck 1997). Therefore, the occurrence of sediments from both basins suggests that flow occurred probably dominantly during the winter. Over time, the absence of sediments from the Verde River could also
Figure 3.2 Microphotographs of features commonly observed in irrigation canals, flood deposits, and agricultural fields. PPL: Plane Polarized Light; XPL: Crossed Polarized Light; IL: Incident Light. (a) Positively graded sediments; (b) Subrounded basaltic grains (origin: Verde River) (PPL); (c) Heteroge-neous subangular sands (local); (d) Well-sorted and homogeHeteroge-neous fine sand with horizontal mica particles, massive soil structure (PPL); (e) Water stagnation deposits and subangular blocky soil structure (PPL); (f) Vughy microstructure due to structural collapse under hydromorphic conditions (XPL); (g) Granular and subrounded blocky structure due to bioturbation (PPL); (h) In situ transversal cross-cut of a characeae stem (XPL); (i) Phy-tolith of the cyperaceae family (PPL); (j) Rounded to angular microchar-coal (IL); (k) Elongated charmicrochar-coals and organic matter in flood deposits (IL); (l) In situ burnt organic matter and charcoals (IL).
(a)
Stratigraphic correlation between T
renches 1 and 2 based on radiocarbon and ceramic dating obtained in both flood deposits and canal fills. In T
rench
2, Stratum VIII was radiocarbon dated (A.D. 596–752), while Stratum XI buries Canal 2c, dated by ceramics to the eleventh to
fourteenth century in
its upper part (Figure
3.2(b)). In T
rench 1, Stratum VIII corresponds to a flood deposit into which Canal 1b was excavated between A.D. 1049–1169
(Figure
3.1(c)). The last deposits filling Canal 1b were dated to A.D. 1520–1625. Therefore, Stratum IX, which covers Canal 1b, was
deposited after
that date. There is a sedimentary gap on the terrace between the twelfth and fifteenth century
.
(b)
Scan and binocular observation of the thin section sampled in T
rench 2, Stratum IXb. The aim of the thin section samples was to pursue a
source-to-sink analysis. First observations
under the binocular highlight weakly sorted silts and sands, partly bioturbated, numerous soil aggregates, traces
of
organic matter
, and rounded macrocharcoal.
(c)
Microphotographs and chronology of the major flood deposits that occurred between the seventh and the sixteenth century
. Description of the min
-eral and organic assemblage under the microscope allows identification of deposits originating from both the V
erde and Salt River basins. Coarse and
weakly sorted deposits rich in quartz, basalt, and amphibole originate from the V
erde and Salt River basins, while finer deposits lacking basalt grains
originate mainly from the Salt River Basin.
(d)
indicate reduced winter precipitation and shifts in precipitation patterns (summer precipitation) (Purdue 2011). The last flood deposit studied was composed of fine silt, with a homogeneous assemblage (T1, S VI; T2, S IXa), originating mainly from the Salt River Basin, which could point towards changing precipitation patterns.
The study of mineral assemblages also confirmed the first chronostrati-graphic correlations established in the field. Based on radiocarbon dates obtained in the canals fills and overbank deposits, it was possible to date the use of the canals (Fig 3.3(d)). Of those canals sectioned by these two trenches, only one was extant during the early Preclassic Period, two during the Preclassic Period, and two much smaller ones were in operation at the beginning of the Classic Period.
MICROMORPHOLOGICAL DESCRIPTIONS
Based on the chronology established (Fig. 3.3(d)) and micromorphological observations, four phases were identified. The description of the deposits encountered in canals in T1 and the ones in T2 are presented in Table 3.2. Detailed micromorphological description of each stratum and microstratum are available in Purdue (2011). Strata identified in the field are numbered while microstrata identified in thin sections are identified by appending alphabetical letters to the stratum designation.
The first phase of canal construction and use in the area occurred around the seventh century. The silts rich in charcoal (T2, S VIII) into which T2, Canal 2a was excavated indicate probable slash and burn to clear vegeta-tion. The deposits studied in the canal (T2, S 1 to 6) are composed of weakly sorted and cross-stratified coarse silts and sands, originating from both the Verde and Salt River basins (indicating regional erosion). Their configu-ration mimics natural channels and reveals high intensity turbulent flow, which probably favored berm breakage. The high content of organic matter throughout this structure and the presence of macrocharcoals suggest the presence of riparian vegetation at the scale of the watersheds as well as local fire events. Last, the dominant massive, vughy, and subangular structures indicate humid conditions, with well-expressed wetting and drying cycles. The thickness and homogeneity of the canal fill indicate a high sediment load but also a high discharge, as confirmed by the flood deposits (originat-ing in the Salt River Basin), which plugged and buried the canal (T1, S VI; T2, S IXa).
The second phase corresponds to Canal 2a observed in T2, dug into S VIII. At the bottom of the canal (S 2 to 5), sediments are composed of microlaminae of very fine sand and sandy silt, from both the Salt and Verde basins. These deposits are homogeneous and very well-sorted; some are pos-itively graded, while others are heterogeneous suggesting irregular flow. The single grain and massive to slightly bioturbated microstructure indicates fast sedimentation with occasional phases of evaporation and biological activity.
T
able 3.2
Selected micromorphological results
Trench / Canal Phase Stratum / Microstratum T exture Sediment Origin Sediment Structure Soil Microstructure Organic Matter Content Organic Matter Shape Charcoal Content Charcoal Size T1/1A 2 2a ss S Het c +++ MP + mi T1/1A 2 2b vfs V Het sg X X +++ mi T1/1A 2 2c vfs U PG sg X X + mi T1/1A 2 2d vfs S PG m X X +++ mi T1/1A 2 3a a S Hom sg + MP + mi T1/1A 2 3b ss U Hom m + MP ++ mi T1/1A 2 3c vfs V Het c + MP +++ mi T1/1A 2 4a vfs V Het sg X X +++ mi T1/1A 2 4b ss U Het c ++ MP + mi T1/1A 2 4c ca S Het m ++++ MP ++++ ma T1/1A 2 4d vfs V Het mix + MP ++ mi T1/1A 2 5 / / / / / / / / T1/1A 3 6 vfs U sg X X +++ ma T1/1A 3 7a ca US Het m + Ag +++ mi T1/1A 3 7b ca S Het sb + H ++++ mi T1/1A 3 8 / / / / / / / / T1/1A 3 9a ca S Het c ++++ H ++++ ma T1/1A 3 9b ss U Het sb ++++ H +++ mi T1/1A 3 9c ss S PG sb + MP + mi T1/1A 3 9d vfs U Het sg + MP + mi T1/1A 3 10 / / / / / / / / T1/1A 3 11 cs U Het sb + F ++ ma T1/1A 3 12a ca S PG sb X X + mi T1/1A 3 12b ca V Het sb ++ H ++ ma T1/1A 3 13 vfs V Het sg + H ++ mi T1/1A 3 14 cs V Het sb + MP ++ ma (Continued )
T able 3.2 (Continued) Trench / Canal Phase Stratum / Microstratum T exture Sediment Origin Sediment Structure Soil Microstructure Organic Matter Content Organic Matter Shape Charcoal Content T1/1A 3 15a vfs U Het sb + MP ++ T1/1A 3 15b a S B sb + MP + T1/1A 3 15c ss S Het m + MP + T1/1A 3 15d vfs V Het sg + MP + T1/1A 3 15e vfs V Het v + MP +++ T1/1A 3 16 a S B sb + MP + T1/1A 3 17a a S B sb + MP + T1/1A 3 17b a S B sb + Ag + T1/1A 3 18 X X X X X X X T1/1A 3 19 ca S B sg +++ H ++ T1/1A 3 20 ca S Hom m ++++ H +++ T1/1A 3 21 / / / / / / / T1/1A 3 22 / / / / / / / T1/1A 3 23 / / / / / / / T1/1A 3 LOST / / / / / / / T1/1B 4 24a vfs V Het v ++++ H ++ T1/1B 4 24b cs V Het v +++ MP +++ T1/1B 4 26 cs S Het m ++ MP +++ T1/1B 4 27 ca S PG sb + MP ++ T2/2A 1 1 vfs U Eolian v +++ H ++ T2/2A 1 2a cs V Het sb ++ H ++ T2/2A 1 2b vfs V Het m +++ H ++++ T2/2A 1 2c ca V Het sb +++ F +++ T2/2A 1 3 / / / / / / / T2/2A 1 4a cs US Eolian sg + MP +++ T2/2A 1 4b ss US Het v +++ H ++++ T2/2A 1 5 ss S PG m ++++ H ++
T2/2A 1 6 vfs V B v to c +++ H ++ mi T2/2B 3 7a vfs S PG sg ++ H ++ mi T2/2B 3 7b vfs US PG sg X X + mi T2/2B 3 7c vfs V Het sg X X + mi T2/2B 3 7d vfs US Hom sg X X + mi T2/2B 3 7e vfs V PG sg X X + mi T2/2B 3 7f vfs S PG sg X X + mi T2/2B 3 7g vfs U Het sg X X + mi T2/2B 3 7h a S Het c +++ Ag ++ mi T2/2B 3 7i vfs US Het sg X X ++++ ma T2/2B 3 7j ss S PG sg ++ Ag ++ mi T2/2B 3 7k vfs V Het sg ++ H +++ mi T2/2B 3 7l vfs V PG sg X X ++++ ma T2/2B 3 7m vfs V Het sg X X ++++ ma T2/2B 3 7n vfs V Het sg + MP ++++ mi T2/2B 3 7o vfs US Het sg + Ag ++++ mi T2/2B 3 7p ss S Het c +++ H +++ mi T2/2C 4 8a ca S B sb +++ Ag ++ mi T2/2C 4 8b ca US PG sb +++ H +++ mi T2/2C 4 8c cs V Het sg + MP ++++ ma T2/2C 4 9 ss V Het c + MP +++ mi T2/2C 4 10a ca S Hom sb +++ H +++ mi T2/2C 4 10b cs US Het sg ++ H +++ ma T2/2C 4 10c ca U Het v ++ H ++ mi T2/2C 4 10d cs U Het sg + H ++ mi T2/2C 4 10e ca S Hom v +++ H +++ mi T2/2C 4 10f ca U Het v +++ H ++++ mi T2/2C 4 11 ss V Hom sb +++ H +++ ma T2/2C 4 12a ss S Hom sb ++ MP + mi T2/2C 4 12b ss V Het sb + H ++++ ma T2/2C 4 12c ca V Het sb +++ F + mi (Continued )
List of abbreviations Sedimentology
T
exture:
vfs: very fine sand; cs: coarse silt; ss: sandy silt; ca: clayey silt; a: clay
Sediment origin:
US: upstream Salt River; S: Salt River Basin; V
: V
erde and Salt River basins; U: undetermined (no basalt
grains)
Sediment structure:
Het: heterogeneous deposits; PG: positively graded; Hom: homogeneous deposits; B: bioturbated
Organic components
T
ype of organic matter:
F: fresh; H: humic; MP: microparticles; Ag: organic soil aggregates
Content in organic matter:
+: 0–2%; ++: 3–4%; +++: 5–8%; ++++: > 8%
Content in charcoal particles:
+: 0–2%; ++: 3–4%; +++: 5–8%; ++++: >
8%
Size of charcoal:
ma: macrocharcoal (> 125µm); mi: microcharcoal (< 125 µm)
Pedology
Soil microstructure:
sb: subangular blocky; sg: simple grain; v: vughy; c: channel; mix: complex
cleaning event
T
able 3.2
From the River to the Fields 79 This is a typical signature of seasonal sedimentation (Courty 1990). Only a few organic microparticles have been observed in association with numer-ous rounded microcharcoal specks (possibly suggesting diminution of the vegetation cover and riparian vegetation upstream). The discrete change in canal shape suggests that this structure was possibly cleaned following that phase.
The third phase visible in T1 (Canal 1a, S 6 to 23) corresponds to a period of decreasing flow intensity but regular canal maintenance (5 clean-ing events). Well-sorted positively graded silty clays and clays were initially deposited (T1, S 6 to 8) indicating rhythmic sedimentation in the canal but very low flow. Most of the sediments originate in the Salt Basin. Their blocky structure suggests episodes of complete drying out, and the abun-dance of charcoal and macrocharcoal points towards possible in situ burn-ing events to clear vegetation. Coarser and weakly sorted sediments as well as numerous angular soil aggregates suggest episodes of berm breakage (T1, S9). Stratigraphic unconformities suggest that the canal was subsequently cleaned. Despite a temporary phase of turbulent flow characterized by deposits (T1, S13 to 14) composed of weakly sorted sands, silty sands, and coarse silts from the Verde and Salt Basin, maybe resulting from a sudden increase in water level in the river, massive well-sorted positively graded clayey silts (T1, S15 to 20) suggest low- to average-intensity flow as well as a rhythmic and fast sedimentation. Despite this sediment structure suggest-ing flows favorable to the transport and deposition of elongated particles of charcoals and organic matter, these two markers were only observed as isolates in low overall frequency (possibly suggesting regional decrease in the vegetation cover and/or drier conditions). The environment linked to the final use of the canal is unknown as the thin section sample was lost during shipping, but field data highlights a major in situ burning event in T1, S22. During its final use, Canal 1a was eroded and buried under flood deposits and channel sediments (T1, SVII; T2, SIXb) indicating fluvial morphological change; this probably occurred slightly prior to A.D. 1030–1189, based on the date obtained in T1, Canal 1b.
Before or during this flood event, Canal 2b was built in T2. This structure was filled with massive laminated or weakly sorted fine sands originating from the Verde Basin and various areas of the Salt River Basin (T2, S7). The mineralogical assemblage is much more diversified than the other sedi-ments studied. We progressively observe increasing quantities of micro- and macrocharcoal in the upper part of T2, S7, suggesting local and regional fire events; landscape denudation may have contributed to an increasing sedi-ment load. Canal 2b in T2, as well as the channel deposits in T1, was then buried under new flood deposits (T1, SVIII; T2, SX).
The fourth and last phase corresponds to two small Classic Period canals (T1, Canal 1b, S24 to 30; T2, Canal 2c, S8 to 12). Canal 1b in T1 was prob-ably built prior to the Canal 2c in T2. Indeed, the massive weakly sorted sands rich in macrocharcoal, sands (from both the Verde and Salt rivers)
and gravels (T1, S24 and 25) observed at the bottom of Canal 1b are very similar to the deposits into which this structure was excavated (T1, SVIII), suggesting a high bedload. Their heterogeneity, as well as vughy structure, implies uncontrolled flow and humid conditions (structural collapse due to humidity). Above, the graded and homogeneous coarse silts observed in both structures (T1, Canal 1b, S26 to 29; T2, Canal 2c, S8 to 12) indi-cate rhythmic flow alternating with temporary drying out as suggested by the massive to sub-angular soil structure (seasonal sedimentation, Courty 1990). Only small charcoals and altered fragments of organic matter have been identified. The upper deposits are weakly sorted and rich in angular soil aggregates possibly resulting from post-abandonment slopewash events and pedogenesis (T1, S30; T2, S12).
Discussion
The chronostratigraphic correlation between canal fills and flood depos-its made it possible to distinguish four hydrosedimentary trends from the seventh to the thirteenth century, three of which took place during the Preclassic Period (A.D. 750–1150), and the last one during the Classic Period (A.D. 1150–1450). Correlating these results with dendroclimatic, climatic, paleodemographic, and archaeological data makes it possible to situate the hydrosedimentary trends in relation to broader socioenviron-mental dynamics and discuss the sociopolitical versus environsocioenviron-mental fac-tors that control human-environment interactions. Results in the Phoenix Basin suggest that this co-evolution was overall controlled by hydrocli-matic factors during the Preclassic Period, mixed anthropic and clihydrocli-matic influences during the transition to the Classic Period, and social drivers during the Classic Period.
The Preclassic Period (Seventh–Eleventh Century)
This study has enabled us to show a first period of canal construction at the middle of the Preclassic Period. The Canal 2a in T2 is filled with lami-nated and cross-stratified coarse sands, conditions seem humid, and the high content of both charcoals and organic matter testifies to landscape evolving possibly at the regional scale. However, it would be necessary to multiply local studies to validate this hypothesis. This dynamic is well cor-related to the (dendro) climatic records, which reveal optimal conditions for irrigation with a high groundwater level and a possible narrow Salt River channel from which water could have been easily diverted (Graybill et al. 1989). This period of fluvial accretion favored water and sediment supply in downstream canals and fields but required coordination and management closer to the headgates to maintain canals and rebuild them after flood events.
From the River to the Fields 81 The second trend corresponds to Canal 1a built in T1, on top of the flood deposits that buried the earlier Canal 2a visible in T2. The initial flow in the canal was turbulent and rhythmic, with possible signatures of sea-sonal sedimentation and regional soil erosion (i.e., sediments derived from both the Salt and Verde basins, rich in charcoal). This suggests efficient water delivery, but the high sediment load probably favored fast siltation. However, flow progressively decreased, as shown by the occurrence of posi-tively graded very fine sediments (originating from the Salt River Basin) and traces of regular wetting and drying cycles. Graded sediments imply a regular increase and decrease in water level in the river or the action of headgates. The numerous cleaning events and ashes indicate local vegeta-tion growth, contributing to low water flow. During this second period, the agricultural areas downstream, dependent on that canal, may have suffered from this reduced water supply. No definite chronology is available for this period, but we do know that it occurred between the eighth and the eleventh century. How to explain this shift in fluvial dynamic, as well as changes in sediment origin and high maintenance? The first hypothesis, supported by climatic data, is a regional decrease in precipitation and discharge. Numer-ous researchers have noticed increasingly drier conditions at regional scale during this chronological interval, and related them to the Medieval Cli-mate Anomaly (e.g., Cook et al. 2004; Jones and Mann 2004; Moberg et al. 2005; Graybill et al. 2006). The dominance of Salt River deposits could also suggest evolution towards a summer precipitation pattern. The second pos-sibility is that increasing population along the Salt River Valley and in the upstream watersheds (Verde and Tonto basins, lower Salt River Valley) (e.g., Hackbarth 1992; Ciolek-Torrello et al. 1994; Doelle 1995; 2000; Deaver 1997) could have contributed to increasing erosion through land clearance (evidenced by abundant charcoals in the deposits) and could subsequently also have diverted most of the available flow in the river leading to decreas-ing flow in canals.
Canal 1a in T1 is buried under flood deposits and channel sediments origi-nating from both the Salt and Verde basins. The lack of bioturbation indi-cates fast sedimentation and burial. The only chronology available is that these destructive flood events and associated fluvial morphological change occurred after A.D. 596–752 and prior to A.D. 1030–1189 (2 sigma cali-brated date), with a most probable date range prior to A.D. 1049 and 1169 (1 sigma calibrated date), remarkably close to the transition from Preclassic to Classic Period, which witnessed a major cultural, social, economic, and agricultural change around A.D. 1050–1150. This phase of floodplain insta-bility may have led to two issues: (1) lateral soil erosion with possible loss of land close to the river, as well as issues cultivating it; and (2) water sup-ply issues associated with necessary cooperation and collaboration to repair canals and/or build new ones. Decreasing agricultural activity on the Lehi Terrace slightly after the Preclassic to Classic cultural transition (Cable and
Doyel 1984; Greenwals et al. 1994; Henderson and Clark 2004) could be a result of these events. In the framework of understanding the controlling factors of socioenvironmental interactions, one can discuss the origin of this floodplain instability: was it anthropic or natural? While we know that our chronological framework needs refinement, other paleoenvironmental data available in the Southwest do indicate (1) increasing discharges associated with the Salt River’s morphological change to a braided-like stream between A.D. 1051–1196 (Graybill et al. 2006); (2) a wetter and colder period within the Medieval Climate Anomaly and more precisely between A.D. 1034– 1150 (Cook et al. 2004) associated with regional flooding at the scale of the American Southwest (Ely et al. 1992; 1993; 1994; Hirschboeck 1987; 1988) as a result of El Niño-Southern Oscillation anomalies (ENSO) (Waters and Haynes 2001), which increase the frequency of winter frontal storms; (3) a change from monsoon-dominant precipitation to winter-dominant pre-cipitation during the eleventh century (indicated by dendroclimatic data; Ni et al. 2002). These results seem to confirm that our source-to-sink analysis is a marker of precipitation patterns, showing a shift from summer-dominant to winter-dominant precipitation during this period. They also emphasize that (1) the Phoenix Basin is sensitive to short-term climatic change, (2) sea-sonal precipitation shifts impact flooding events, and (3) winter floods are the most damaging along the lower Salt River. Summer storms, by their intensity, increase soil sensitivity to erosion, but their short duration does not favor soil transport over long distances, unlike the longer but less intense winter rains (Etheredge et al. 2004).
Going back to the Riverview at Dobson Project, it is also interesting to notice that following these events indicative of fluvial morphological change, only 20 cm of sediments were apparently deposited (as recorded in Trench 1 and 2). From a purely hydrogeomorphic perspective, if the discharge is higher than the sediment supply, the river will downcut. While no direct traces of downcutting events are visible on the site, we strongly support the hypothesis that this occurred along the Salt River, similarly to the Gila River (Waters and Ravesloot 2001) and its tributaries (e.g., Waters 1998; Cook et al. 2010). The anthropic impact on both the fluvial morphologi-cal changes and associated downcutting should, however, not be neglected. Indeed, the dominance of deposits rich in charcoals is in accordance with an increasing human occupation and agriculture in the upstream basins and tributaries of the Salt River (e.g., Hackbarth 1992; Hegmon 2002; Swanson and Diehl 2003). I therefore suggest that the transition from the Preclassic to the Classic Period was controlled by both short-term climatic shifts and long-term anthropic effects on the environment.
The Classic Period (> Eleventh Century)
The final trend, observed in the two small Classic Period canals (T1, Canal 1a; T2, Canal 2c) is one of contrasting sedimentation. Coarse and laminated
From the River to the Fields 83 deposits from both the Salt and Verde basins suggest rhythmic sedimen-tation, but phases of scarce water supply have also been identified. This combined signature could indicate a well-expressed increase and decrease of the water level in the river. Dendroclimatic data at the scale of the Verde and Salt River basins indicate phases of above average flow, possibly from winter-dominant precipitation, alternating with periods of very low dis-charge (Graybill et al. 2006). In both trenches, canal management decreased during this period. A plausible explanation for the evolution in canal size and maintenance could be a change in the organization of the agrosystem during the Classic Period. As a result of fluvial morphological change and a probable downcutting event, new systems had to be built upstream to meet water demands, such as the Lehi System, built upstream of Canal System 1 (Howard 1987). The potential issue is that water supply could have gener-ated individualization within agricultural groups more than their collabora-tion, which could explain the evolution in canal size and management. The reuse over the long term of these irrigation canals does, however, imply a durability of traditions and techniques, with a desire for efficiency and maintenance of agricultural practices and plot locations even in geomor-phologically sensitive areas. Finally, canals were abandoned, although no environmental constraint has been identified.
Conclusion
When studying human-environmental co-evolution, it is necessary to conduct systemic and multi-scalar studies that span both temporal scales (from single events to multi-century dynamics) and spatial scales (local to the scale of the watershed). Combined systematic geoarchaeological and micromorphological studies make it possible to examine these interactions as precisely and accurately as possible in past agricultural societies in semi-arid environments, as they exploited water and soils using gravity-fed irri-gation systems. This direct linkage of agricultural fields to rivers through irrigation systems makes it possible to assess long-term socioenvironmen-tal dynamics by examining these three elements. I have used the case of Hohokam prehistoric irrigation systems to illustrate the potential of a field geoarchaeological approach combined with the micromorphological study of irrigation canal fill and flood deposits from sedimentological, pedologi-cal, ecologipedologi-cal, and anthropic perspectives in enabling reconstruction of these socioenvironmental interactions. In order to discuss which of climate or anthropic activities controlled these interactions, it is also necessary to incorporate archaeological, climatic, and demographic data, which I have done here by drawing on the rich record of published work for the area. Results highlight that when alluvial plains are stable (as evidenced by soil development or low intensity overbank deposition), adaptation to shifts in water supply (from, e.g., high flow leading to berm breakage and erosion
Methodological Vignette: Micromorphology and Agrosystems
In arid environments, gravity-fed irrigation systems have allowed agri-cultural societies to cope with social imperatives (water needs) and environmental constraints (water availability). The resulting intertwined social, natural, and/or artificial system, referred to as an anthroposystem (Lévêque et al., 2003), exists at multiple embedded spatial and tempo-ral scales (micro-local to regional; past, present, or future). Simultane-ously pursuing geomorphic, geoarchaeological, and agronomic studies
or low flow favoring siltation) is visible through regular canal maintenance (cleaning and in situ burning events) and canal reconstruction. However, low frequency events (sudden floodplain accretion, repeated fluvial mor-phological change, and downcutting as a result of an abrupt climate change and shifting precipitation patterns, in parallel with the indirect impact of increasing population) can lead to social reorganization (e.g., the transi-tion from Preclassic to Classic Period in our case study). On the one hand, the maintenance and reconstruction of water structures in similar locations highlights the resilience of past Hohokam communities. On the other, the smaller size and weak maintenance of these structures in the Classic Period, despite an existent labor force, followed by their abandonment a few cen-turies later in the absence of environmental constraints, suggest that the restructuration of the agrosystem was not durable. In this case, then, it seems that low-frequency environmental shifts were a triggering factor in agricultural reorganization, but the complete abandonment can be traced also to other factors.
Acknowledgments
I would like to thank Daniel Contreras, both as the organizer of the session “Correlation Is Not Enough: Building Better Arguments in the Archaeology of Human-Environment Interactions” held during the SAA 2014 confer-ence in Austin, Texas, and for his insightful comments and suggestions on this chapter. I would also like to thank the School of Human Evolution and Social Change at Arizona State University (Tempe, Arizona) as well as Jerry Howard (Arizona Museum of National History), David Abbott (Arizona State University), and Jean François Berger for the support they provided in collecting the field data. I would also like to thank the GEOPHEN labora-tory at the University of Caen Basse Normandie for help and support pre-paring the thin sections.
From the River to the Fields 85
Notes
1 T1 refers to Riverview at Dobson (RAD) project conducted in 2005, T 206, Fea-ture 121; T2 refers to RAD 2005, T 204, FeaFea-ture 119.
2 Overbank flood deposits are indicated by Roman numerals and canal fills by Ara-bic numerals. Stratigraphic units are designated with an S.
3 T1, S24: Microcharcoal, Lyon 45–15, 915 ± 30 B.P., 2 σ calibrated date (95.4%): A.D. 1030–1189 (Reimer et al. 2013).
4 T1, S30: Microcharcoal, Lyon 49–43, 305 ± 30 B.P., 2 σ calibrated date (95.4%): A.D. 1489–1651 (Reimer, 2013).
5 T2, S VIII: Microcharcoal, Lyon 49–42, 1380 ± 35 B.P., 2 σ calibrated date (95.4%): A.D. 596–752 (Reimer et al. 2013).
References Cited
Ackerly, N. W. and T. K. Henderson (editors) 1989 Prehistoric Agricultural Activities on the Lehi-Mesa Terrace. Perspectives on Hohokam Irrigation Cycles. Northland Research Inc, Tempe.
to connect river dynamics to water networks and adjacent fields makes possible the relatively precise reconstruction of human-environment co-evolution, structured around phases of stability, thresholds, and shifts. The systematic analysis of alluvial archives, irrigation canal design, maintenance and sedimentary fill, as well as agricultural fields, can pro-ductively be combined with laboratory soil analyses such as micromor-phology (Berger 2000; Purdue et al. 2010). Micromormicromor-phology is the study of sediments under the microscope (Bullock et al. 1985; Stoops 2003) and has proven extremely useful in the understanding of sedimentary processes (e.g., environments of sedimentation, dynamics of flow, iden-tification of flood and soil erosion events), pedological and ecological dynamics (e.g., rhythm in water supply, soil development, vegetation cover, fire regime), human activities (slash and burn, cleaning events, manuring, irrigation), and dynamics related to soil climate (water stagna-tion/evaporation) (cf. Fédoroff et al. 1987; Courty et al. 1990; Kapur and Stoops 2008; Stoops et al. 2010). The systematic description of mark-ers of these processes allows for their statistical classification and the grouping of synchronous events. Their interpretation, based on current or historical references and bibliography (e.g., Stoops et al. 2010), ena-bles formulation of dynamic socioenvironmental models, such as recon-structions of changing irrigation regulars or impacts of climate changes. The multiplication of local studies is key for enlarging the scale of study to water networks or even entire catchments and discussing the control-ling factors of socioenvironmental interactions.
Alonso, P., C. Dorronsoro and J. A. Egido 2004 Carbonatation in palaeosols formed on terraces in the Tormes River Basin, Salamanca, Spain. Geoderma 118:261–276. Amonette, J. 1994 Quantitative Methods in Soil Mineralogy. Soil Science Society of
America. SSSA Miscellaneous Publication, American Society of Agronomy, Madi-son, WI.
Bal, L. 1973 Micromorphological Analysis of Soil. The Netherlands Soil Survey Institute, Soil Survey Papers 6, Wageningen.
Beach, Timothy, S. Luzzadder-Beach, N. Dunning, J. Jones, J. Lohse, T. Guderjan, S. Bozarth, S. Millspaugh and T. Bhattacharya 2009 A review of human and natu-ral changes in Maya Lowland wetlands over the Holocene. Quaternary Science Reviews 28:1710–1724
Berger G. W. 1986 Dating Quaternary deposits by luminescence—recent advances. Geoscience Canada 13:15–21.
Berger, J.-F. 1996 Climat et Dynamique des Agrosystèmes dans la Moyenne Vallée du Rhône. In Le III ème Siècle en Gaule Narbonnaise. Données Régionales sur la crise de l’Empire, edited by Jean-Luc Fiches, pp. 299–332. Apdca, Sophia Antipolis.
——— 2000 Les Fossés Bordiers Historiques et l’histoire Agraire Rhodanienne. Etudes Rurales: 153–154 La Très Longue Durée:59–90.
Berger, J.-F. and C. Jung 1996 Fonction, evolution et “Taphonomie” des Parcellaires en Moyenne Vallée du Rhône. Un Exemple d’approche Intégrée en Archéomor-phologie et en Géoarchéologie. In Les Formes Du Paysage, Tome 2, edited by G. Chouquer, pp. 95–112. Errance, Paris.
Bernigaud, N. 2012 Dynamique des Interactions Socio-Environnementales autour des Marais de Bourgoin-la Verpillière et du Grand Plan (Isère), depuis le Néolith-ique jusqu’au XIXe Siècle. Unpublished Doctorate in Archaeology, University of Nice Sophia Antipolis.
Bertrand, G. 1975 Pour une Histoire Ecologique de la France Rurale. In Histoire de la France Rurale, edited by G. Duby and A. Wallon, pp. 34–113. T.1. Editions du Seuil, Paris.
Bresson, L. and C. Valentin 1994 Soil surface crust formation: Contribution of micromorphology. In Soil Micromorphology: Studies in Management and Gen-esis, edited by A. J. Ringrose and G. S. Voase, pp. 737–762. Humphreys, Elsevier, Amsterdam.
Brewer, R. and J. R. Sleeman 1960 Soil structure and fabric. Their definition and description. Journal of Soil Science 11:172–185.
Bruins, H. J., M. Evenari and U. Nessler 1986 Rainwater-harvesting agriculture for food production in arid zones: The challenge of the African famine. Applied Geography 6:13–32.
Bullock, P., N. Fédoroff, A. Jongerius, G. Stoops, T. Tursina and U. Babel 1985 Handbook for Soil Thin Section Description. Waine Research Publications, Wolverhampton.
Cable, J. S. and D. E. Doyel 1984 The implications of field houses for modeling Hohokam agricultural systems. In Archaeology of the Original Townsite: The Murphy’s Addition, edited by J. S. Cable, S. L. Henry, D. E. Doyel, pp. 259–280. City Of Phoenix, Soil Systems Publications in Archaeology No. 8, Phoenix, AZ. Chen, Y., J. Tarchitzky, J. Brouwer, J. Morin and A. Banin 1980 Scanning
elec-tron microscope observations on soil crusts and their formation. Soil Science 130:49–55.
From the River to the Fields 87
Chouquer, G. 2000 L’étude des Paysages. Essai sur leurs Formes et leur Histoire. Editions Errance, Paris.
Chouquer, G. and F. Favory 1991 Les Paysages de l’antiquité, Terres et Cadastres de l’occident Romain. Editions Errance, Paris.
Ciolek-Torrello R., S. M. Whittlesey and J. R. Welch 1994 A synthetic model of pre-historic land use. In The Roosevelt Rural Sites Study. Vol. 3: Changing Land Use in the Tonto Basin, edited by R. Ciolek-Torrello and J. R. Welch, pp. 437–472. J.R. Statistical Research Technical Series 28, Tucson.
Clarke, D., R. Sala, J.-M. Deom and E. Meseth 2005 Reconstructing irrigation at Otrar Oasis, Kazakhstan, AD 800–1700y. Irrigation and Drainage 54:375–388. Cook, E. R., C. A. Woodhouse, C. M. Eakin, D. M. Meko and D. W. Stahle 2004
Long-term aridity changes in the western United States. Science 306:1015–1018. Cook, J. P., P. A. Pearthree, J. Onken, A. Youberg and E. R. Bigio 2010 Mapping of
Holocene River Alluvium along Oak Creek, Wet Beaver Creek, West Clear Creek, Fossil Creek, and the East Verde River, Central Arizona. Arizona Geological Sur-vey, 40, Tucson, AZ.
Courty, M.-A. 1990 Environnements Géologiques dans le Nord-Ouest de l’inde. Contraintes Géodynamiques au Peuplement Protohistorique, Thèse d’état, Uni-versité de Bordeaux.
——— 1994 Le Cadre Paléogéographique des occupations humaines dans le Bassin du Haut-Khabour, Syrie Du Nord-Est. Premiers Résultats. Paléorient 20:21–59. Courty, M. A. and N. Fédoroff 1985 Micromorphology of recent and buried soils in
a semi-arid region of Northwestern India. Geoderma 35:287–332.
——— 1999 L’apport de la Micromorphologie des sols à la Reconstitution des Paléopaysages (Application au Bassin Méditerranéen pour la période 3000 av. J.C.—1800 ap. J.C.). In Environmental Reconstruction in Mediterranean Land-scape Archaeology, edited by P. Leveau et al., pp. 55–65. The Archaeology of Mediterranean Landscapes 2, Oxford.
Courty, M. A., P. Goldberg and R. Macphail 1990 Soils and Micromorphology in Archaeology. Cambridge Manuals in Archaeology, Cambridge University Press, Cambridge.
Courty, M. A. and P. Nornberg 1985 Comparison between buried uncultivated and cultivated Iron Age soils of the west coast of Jutland, Denmark. Isksos 5:57–69. Crook, D. C., R. J. Jones, M. Elvin, J. Shen and J. A. Dearing 2008 The history of
irrigation and water control in China’s Erhai catchment: Mitigation and adapta-tion to environmental change. In Mountains: Sources of Water, Sources of Knowl-edge, edited by E. Wiegandt, pp. 21–42. Springer, Dordrecht.
Davis, A. P. 1902 Water Storage on the Salt River, Arizona. US Geological Survey Water Supply Paper 73.
Deaver, W. L. 1997 Chronological issues of the LVAP. In Vanishing River. Land-scapes and Lives of the Lower Verde Valley, edited by S. M. Whittlesey, R. S. Ciolek-Torrello and J. H. Altschul, pp. 447–490. Statistical Research Inc., Tucson. Doelle, W. H. 1995 Tonto basin demography in a regional perspective. In The
Roosevelt Community Development Study. New Perspectives on Tonto Basin Prehistory, edited by M. D. Elson, M. T. Stark and D. A. Gregory, pp. 201–226. Center for Desert Archaeology Anthropological Papers 15, Tucson.
——— 2000 Tonto basin demography in a regional perspective. In Salado, edited by J. S. Dean, pp. 81–105. Amerind Foundation New World Studies Series 4, Dragoon, AZ.