Building Operational Excellence in a Multi-Node Supply Chain by
Mira K. Sahney
B.S.E. Mechanical Engineering, University of Michigan, 1996 M.S. Mechanical Engineering, Stanford University, 1999
Submitted to the Sloan School of Management and the Department of Mechanical Engineering
in Partial Fulfillment of the Requirements for the Degrees of Master of Business Administration and
Master of Science in Mechanical Engineering
In Conjunction with the Leaders for Manufacturing Program at the Massachusetts Institute of Technology
June 2005
C 2005 Massachusetts Institute of Technology. All rightpreserved. Signature of Author
MIT Sloan School of M&iag ment MIT Department of Mechanical Engineering May 6, 2005 Certified by
Dr. Stephen Graves, Thesis Advisor Abraham Siegel Professor of Management, Sloan School of Management, MIT Certified by
Dr. Abbott Weiss, Thesis Advisor Sr. Lecturer, Engineering Systems Division, MIT Certified by
Dr. Daniela Pucci de Farias, Thesis Advisor Assistant Professor, Department of Mechanical Engineering, MN Accepted by
David Calodilupo Executive Director of the MBA Program, Sloan Schoj vanagement, MIT Accepted by
Dr. Lallit Anand, Chair, Departmental Committee on Graduate Students Professor of Mechanical Engineering, MIT
MASSACHUSETTS INSTITUTE OF TECHNOLOGY
Building Operational Excellence in a Multi-Node Supply Chain
byMira K. Sahney
Submitted to the MIT Sloan School of Management and the Department of Mechanical Engineering on May 6, 2005 in Partial Fulfillment of the Requirements for the Degrees of
Master of Business Administration and Master of Science in Mechanical Engineering
Abstract
This thesis shows how a combination of macro-economic, business, and organizational factors can lead a well-run company to adopt a "launch-and-expedite" behavior with detrimental effects on operational efficiency. It also demonstrates how it is possible, for an organization that finds itself in such a state, to apply basic operations principles and a data driven approach to systematically get out of the "launch-and-expedite" mode. The thesis presents a method to characterize a real, functioning supply chain in the context of changing conditions and in the absence of perfect data. It shows the analysis, recommendations, and results from a particular supply chain case study at Agilent Technologies, Inc. The project first analyzes and maps the current supply chain to characterize demand and supply variability. A selected menu of operational building blocks is then recommended to improve overall supply chain performance by reducing the internal bullwhip effect and improving on-time delivery. The recommendations are implemented in a successful pilot study and key operational metrics are recorded such as supply chain inventory, on-time delivery, variability of lead-time, and number of
expedite/schedule change requests. The particular organizational context of the project and its affect is also considered.
Although this thesis provides a case study of the Colorado Springs Technical Center operations and supply chain, results and lessons learned are applicable to other
component suppliers or component buyers within multi-node supply chains, particularly those in the capital equipment business.
Thesis Supervisor: Stephen Graves
Professor, MIT Sloan School of Management Thesis Supervisor: Abbott Weiss,
Sr. Lecturer, MIT Engineering Systems Division Thesis Supervisor: Daniela Pucci de Farias
Acknowledgements
Without Agilent Technologies, this thesis would not have been possible. I would like to thank Dan Hudson, manager of the Global Supply Chain Engineering group for
sponsoring this project. Greg Kruger served as an excellent mentor and project champion on-site in Colorado Springs. I am grateful for his support and dedication to this work. In addition, I would like to thank all the employees of the CSTC, DVD, and other Agilent organizations who shared their time, expertise, and opinions with me during my work on-site. Without your support and intimate knowledge of the Agilent supply chain, this project would have never been successful.
I wish to express my appreciation for the support and resources provided by the Leaders for Manufacturing Program (LFM), a partnership between the MIT School of
Engineering, the MIT Sloan School of Management, and major international manufacturing companies. I would also like to thank all my classmates in the LFM Program for helping me to learn even more that I thought I would from this experience. A special thanks goes to my advisors, Stephen Graves, Abbott Weiss, and Daniela Pucci de Farias for their pragmatic advice during the internship and thoughtful suggestions on writing this thesis.
Most importantly, I wish to thank my husband, Howard Tang, for his unwavering love and support during these two challenging years. This work has taken us across the country twice and having him with me through it all has made it a wonderful experience.
Table of Contents
Chapter 1: Introduction ... 8
1. 1 Project m otivation... 8
1.2 Agilent... 10
1.3 Global Supply Chain Engineering (GSCE) ... 11
1.4 Chapter overview ... 11
Chapter 2: Colorado Springs Technical Center (CSTC)... 12
2.1 Organizational structure and background information ... 12
2.2 Organizational goals ... 15
2.3 M arket based view ... 15
2.4 Resource based view ... 17
2.5 Chapter summ ary ... 19
Chapter 3: Direct observation of the current reality... 20
3.1 Forecasting and planning ... 21
3.2 Custom er order flow ... 25
3.3 Capacity m anagement... 29
3.4 Job scheduling and W IP management ... 31
3.5 Inventory and safety stock management... 33
3.6 Internal on-tim e delivery... 34
3.7 Chapter summ ary ... 36
Chapter 4: Hypothesis for change towards the ideal state... 39
4.1 Order sizing... 40
4.2 M anufacturing lot sizing ... 41
4.3 Job scheduling and W IP management ... 43
4.4 Quantify forecast error... 46
4.5 On-time-delivery measurement... 47
4.6 Statistical safety stock setting ... 48
4.7 Future state predictions... 52
4.8 Chapter summ ary ... 53
Chapter 5: An im plem entation case study... 55
5.1 Pilot implementation objectives... 55
5.2 Pilot implementation results ... 56
5.3 Implementation surprises and lessons learned... 60
5.4 Continuation and expansion of work ... 63
5.5 Chapter summ ary ... 64
Chapter 6: Organizational context and im pact... 66
6.1 Structure: Recent changes disrupted the CSTC ... 66
6.2 Culture: Friendly and loyal ... 68
6.4 Leading change in the organization ...
6.5 Implications for the future of operational improvements at CSTC ... 6.6 Chapter summ ary ... Chapter 7: Conclusions and follow-on work...
7.1 Introduction... 7.2 Summ ary of analysis and recomm endations... 7.3 Results and caveats ... 7.4 Recomm ended next steps...
7.5 Summ ary ... Appendix A: Effect of forecast translation from months to weeks...
Appendix B: Coefficient of Variation for a Poisson distribution ... 85
Appendix C: Economic Build Quantity... 86
Appendix D: Statistical safety stock determination... 88
Bibliography ... 92 73 76 77 79 79 79 80 81 82 83
List of Figures
Figure 1.1: Supply chain for high-tech capital equipment manufacturer ... 8
Figure 1.2: Variability in the semiconductor and electronics supply chain... 9
Figure 2.1: Distribution of CSTC products to product organizations at Agilent... 13
Figure 2.2: Logic Analyzers (left) and Oscilloscope (right)... 14
Figure 2.3: Competitive positioning of typical Agilent and CSTC products ... 16
Figure 3.1: CSTC supply chain material flow ... 20
Figure 3.2: Flow of information and parts through the supply chain ... 22
Figure 3.3: Component A weekly customer demand data... 27
Figure 3.4: Component A weekly order history between final assembly and CSTC... 28
Figure 3.5: WIP used as a shock-absorber for demand variability ... 33
Figure 4.1: Decoupling statistical safety stock buffer (FGI) ... 39
Figure 4.2: Building blocks for operational excellence ... 40
Figure 4.3: Example trade off between set-up cost and inventory holding cost... 43
Figure 4.4: Simple system dynamics model of the planning loop ... 44
Figure 4.5: Service level in a multi-echelon supply chain... 47
Figure 4.6: Preferred Safety Stock Configuration ... 50
Figure 4.7: Practical Safety Stock Configuration ... 50
Figure 4.8: Current vs. future supply chain inventory and service levels... 53
Figure 5.1: Component A inventory control chart for CSTC site... 58
Figure 5.2: Component A inventory control chart for final assembly site ... 58
Figure 5.3: Historical vs. current average supply-chain inventory level component A.... 59
Figure 6.1: A ctual project tim eline ... 75
Figure E. 1: Comparison of service function calculation methods... 90
List of Tables
Table 3.1: On-time delivery metrics example... 35Chapter 1: Introduction
1.1 Project motivation
The cyclic nature of the high-tech industry is well known in business. In particular, the capital equipment manufacturers that supply the high-tech industry are subject to an even greater volatility than that driven by the end consumer. These equipment manufacturers, as a result of their upstream position in the supply chain are subject to an amplification of demand variability often referred to as the bullwhip effect (see Figure 1.1). The bullwhip effect has been widely studied in supply chains and discussed in the literature (Felch
1997; Coughlin 1998; Blake 1999; Anderson 2000; Spearman 2000; Sterman 2000; Blaha 2002; Simchi-Levi 2003).
Raw Equipment Semiconductor Computer Customer
material manufacturer manufacturer manufacturer
c
upstream 4 downstream
Figure 1.1: Supply chain for high-tech capital equipment manufacturer
However, it is important to make a distinction between the variability amplification experienced by the manufacturers of finished goods and that faced by capital equipment manufacturers. For equipment manufacturers, the increased demand volatility is
experienced as demand driven changes in the desired manufacturing capacity (Anderson 2000). For example, a small percentage change in the demand for computers will produce a much larger percentage change in the demand for equipment to make the microprocessors that are inside the computers. In macroeconomics this effect is known as the investment accelerator (Samuelson 1939).
To fully comprehend the extent of the volatility faced by equipment manufacturers in the semiconductor and electronics business, consider Figure 1.2 (Fine 2005).
100.06 80.00 60.00 4O.0 20.00 >0 0.00 1961 1965 196 1 3 1977 1981 1 1989 1993 19 01 o Year -40.00
Worldwide Semiconductor Manufacturing Equipment Sales
-.- Worldwide Semiconductor Shipments
+& Electronics, Computing and Communications Equipment Output GDP World -f- GDP USA
Figure 1.2: Variability in the semiconductor and electronics supply chain
This figure plots data from the US economy over the period of 1961 - 2001. Five time series are plotted: (1) year-to-year percent changes for semiconductor equipment sales; (2) semiconductor shipments; (3) electronics, computing, and communications equipment output; (4) gross domestic product (GDP) USA; and (5) GDP World. Note the extent to which the equipment sales overshoot both the bull and the bear markets throughout several decades of data. It is also important to note that in this industry, the pattern repeats every 4-7 years. Experienced leaders of such firms are familiar with the pattern, as expressed in the following quote (Barnholt 2003):
"This is my seventh business cycle in my 37 years with HP and Agilent, and one thing I know is business cycles do end But markets are always different when cycles end than when they started The challenge is to understand the structural changes that are going on in our industry to be ready for the new opportunities as they come along."
The macroeconomic trends and bullwhip effect on high-tech capital equipment
manufacturers highlighted in Figure 1.1 provide the external context and motivation for this thesis. However, this thesis focuses on the internal concerns relevant for the
management of such firms including:
(1) What should the operations strategy be for a capital equipment manufacturer in a high-tech and highly cyclical industry?
(2) How can a typical company that desires to recover from a downturn
restructure its operations to perform well not only in the next upturn but also to survive the next downturn?
(3) What data should be collected to characterize the current situation?
(4) What specific actions can be taken to begin a change towards a new, more robust operational structure?
This thesis will examine these fundamental operations questions in the context of the semiconductor and electronics equipment business based upon applied research
conducted on-site at Agilent Technologies in the Colorado Springs Technical Center, but the results and findings can be generalized as applicable to other high-tech equipment manufacturers, who aim to strengthen their operational competitiveness.
1.2 Agilent
Agilent Technologies became an independent company from Hewlett-Packard in 1999, focusing on the test & measurement, automated test, semiconductor, and life sciences parts of the business. In the short time since independence the company has weathered many changes from a spectacular market upturn to an abysmal downturn and a
subsequent on-going recovery.
Additionally, with growing competition and maturation of its product architecture, Agilent has been shifting from historically vertically integrated businesses to increasing use of external suppliers, contract manufacturers, and low-cost labor regions for final assembly of products. During this transition, much attention has been focused on Agilent
final assembly and test site operations while less attention has been given to manufacturing organizations within the firm. This thesis considers the role of key internal component manufacturers and their new supply chain relationships within the firm.
1.3 Global Supply Chain Engineering (GSCE)
The Global Supply Chain Engineering (GSCE) group at Agilent sponsored this research in order to better understand the role of key internal component suppliers in the new Agilent supply chain.
The initial goal of this work was to model and analyze an Agilent supply chain that included an internal Agilent component supplier, as well as an Agilent final assembly site. This model would then be used to simulate and quantify the effects of different operational policies, such as safety stock levels or scheduling rules, on operational efficiency. The ultimate project goal was to improve operations within an Agilent supply chain by understanding the unique characteristics of internal component suppliers within the chain and designing an operations strategy to best capitalize on this understanding.
1.4 Chapter overview
This thesis is organized into seven chapters. Chapter 2 introduces the Colorado Springs Technical Center (CSTC) in terms of its structure, objectives and strategy within the larger context of Agilent's Electronic Products and Services (EPSG) division. Chapter 3 characterizes the current CSTC operations within the Agilent supply chain and a
computerized ERP system. Chapter 4 recommends the application of specific operations principles based on a data-driven analysis in order to drive improvements in CSTC performance. Chapter 5 presents the challenges, learning, and data from a pilot
implementation of the recommendations at the CSTC. Chapter 6 addresses the specific organizational context and its influence on further operational improvements at CSTC. Finally, Chapter 7 summarizes the conclusions of this research and the lessons learned. In addition, opportunities for further work as well as the applicability of the conclusions to other companies or industries are discussed.
Chapter 2: Colorado Springs Technical Center (CSTC)
2.1 Organizational structure and background information
HP purchased the site of the current CSTC operations in 1962 and micro-circuit work began on the site in 1969. The CSTC was formally created in 1975 to manufacture key components in support of Hewlett-Packard's growing test and measurement business. Historically, the CSTC was part of the Colorado Springs Group, which functioned as a stand-alone profit center within the larger company. Ownership of CSTC was officially transferred to Agilent when the company spun out of HP in 1999. Currently, the CSTC functions as a cost center within the Multi-Industry Business Unit (MIBU) of Agilent.
The CSTC manufactures low-level components which are used in Agilent products across all four divisions: (1) Test and Measurement; (2) Semiconductor Products; (3) Automated Test; and (4) Life Sciences and Chemical Analysis. Per a company policy aimed to preserve Agilent's competitive advantage, CSTC does not sell its components on the open market. The majority of CSTC components (93%) are used in products for the Electronic Products and Services Group (EPSG) part of the Test and Measurement Division. Within EPSG, the two major internal customers for CSTC are the Multi-Industry Business Unit (MIBU) and the Computing and Networking Solutions Business Unit (CNSBU). The shaded organizations in Figure 2.1 will be the focus of the work described in this thesis.
MIBU Oscilloscopes Logic Anal ers
GPSysComp EDA Software
Precision Measurement & Test
CSTC EPSG WBWIBU
CNSBU
0
Automated Test
Other Semiconductor Products
Divisions Life Sciences & Chem. Analysis %... ... I
Figure 2.1: Distribution of CSTC products to product organizations at Agilent
Discussion of CSTC components in this case study will be limited to those made for MIBU products, which are a $2.1 B market for Agilent annually. This represents the largest CSTC customer when the products are dollar-weighted. Although it won't be addressed specifically in this thesis, the diversity of customers and markets served by the CSTC does complicate its strategy and objectives. Oscilloscopes and logic analyzers are examples of MIBU products which are sold to other electronics firms for test and
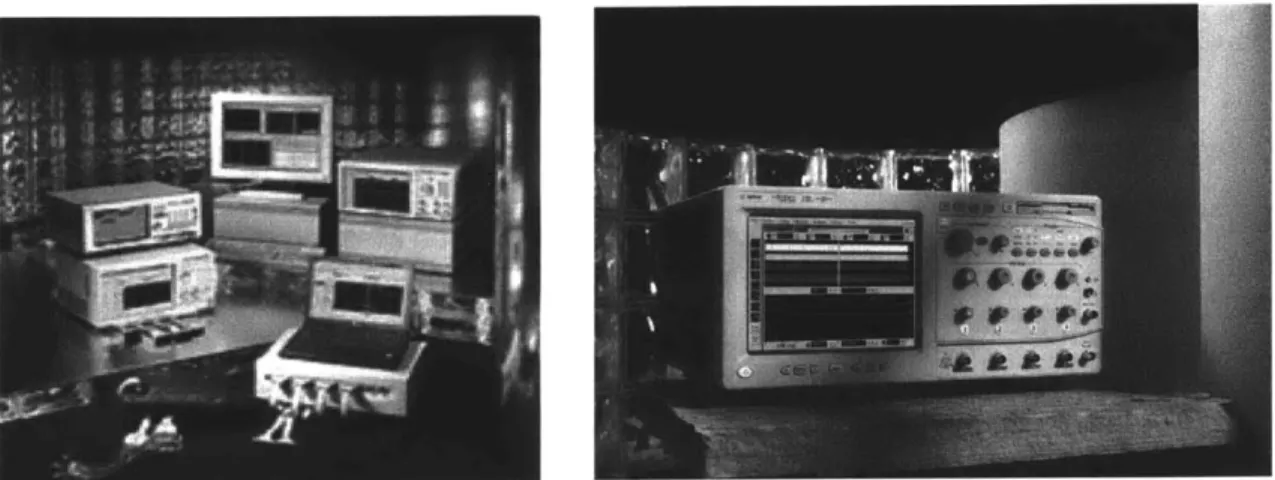
measurement applications, representing a $650M annual market size for Agilent. Typical examples of these products are shown in Figure 2.2.
Figure 2.2: Logic Analyzers (left) and Oscilloscope (right)
Some examples of components manufactured by CSTC include: hybrid integrated circuits and probe tips with integrated logic. However, the CSTC is most often recognized in terms of its process capabilities, not the specific products it manufacturers. These process capabilities include:
" Thick film, thin film (wet), and laser " Chip and wire bond
" Final assembly (solder, encapsulation, lid bond, etc.)
" Test (included several custom Agilent automated test equipment systems) The CSTC is at the forefront of developing new process technologies and using these technologies in production. As such, the manufacturing processes performed at the
CSTC are complex and often rely on the skill and tacit knowledge of technicians, operators and engineers at the site.
CSTC is currently run as a cost center and led by the plant manager. The types of personnel included in the CSTC organization are process engineers, quality engineers, equipment operators, planners, buyers and various supervisors and project leads. In 2004 there were approximately 90 associates working in the CSTC. Due to the market
slowdown, only one shift was run on most equipment and two shifts were only used if necessary to meet scheduled output requirements.
2.2 Organizational goals
"New products are the life-blood of our company... It's important to recognize that when we talk about innovation, we're not just talking about product innovation. We're talking about innovation in process ftoo]... " - Ned Barnholt, Agilent Chairman and CEO
The overarching goal of CSTC and Agilent is to increase market demand for Agilent products through innovation - including creating demand through obsolescing and
cannibalizing demand for its own products. As a process center, the CSTC supports Agilent's corporate strategy and culture of innovation by leading the industry in process innovations. These process innovations enable the products designed by Agilent development engineers to reach the marketplace ahead of the competition. While cost pressure has increased in importance of late, developing process capabilities for low-volume, high-mix production remains the primary goal for CSTC in order to satisfy the unique needs of its internal customers.
Additionally, the unstated goal of any firm is self-preservation, and the goal of CSTC is no different. Following the market downturn that began in 2001, the CSTC was
challenged to re-position itself competitively in relationship to potential external
suppliers. Despite increased outsourcing of higher volume products, the CSTC continues to occupy a key strategic position in the Agilent supply chain by providing manufacturing for prototyping, process development, new product launches, spares, and other low-volume products.
2.3 Market based view
Agilent and CSTC have typically led the market in the introduction of new products and product features. For example, the Colorado Springs Group originally created the entire market segment for Logic Analyzers. Before introduction by Agilent, this product category did not even exist. Agilent products represent the highest quality products available in terms of features, options/customization, service and support. These high quality products are sold at a significant price premium in the marketplace. The high-end
customer needs for the electronics test and measurement market can be distinguished from other customer segments. In the high end, there is little elasticity of demand. Customers require the highest performance products and are willing to pay what is necessary to acquire these products. Customers, in exchange for this price premium, also expect responsiveness on the part of the manufacturer as well as excellent service and support. Moving only slightly down-market in product performance can have a
significant influence on the basis of competition. In the mid to lower-end segments, price is a significant consideration and many suppliers compete for this business. Typically, Agilent does not develop new products for the lower-end market segments, but instead sells its more mature products to meet the needs of these segments.
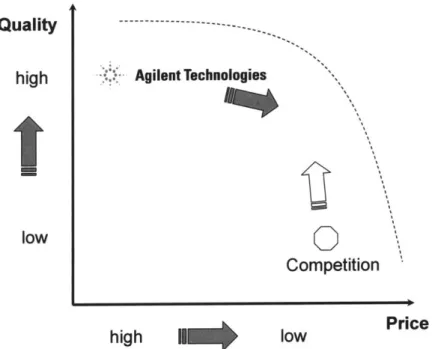
Although Agilent (HP) initially created many of the markets it serves, over time competition has developed and increased. As more of the electronic components necessary to build the equipment Agilent produces become commodities, competitors have been able to move up-market in quality while still offering low-priced products. This has led to increasing competition and pricing pressure in Agilent's traditional markets (see Figure 2.2).
Quality
---high Agilent Technologies
low
Competition
high II low Price
Agilent's CEO Ned Barnholt highlighted this shift in the nature of competition during his speech at SEMICON West in 2003:
"We're in a period of lots ofprice pressures, continuing excess capacity, and pressure for time-to-market, bringing new technologies and products to market.
These aren't going away, and the focus on operations improvement and cost reductions is much greater now than when we went into this downturn three years ago. ... We're in a market-share battle - allfighting for a limited piece of the pie as opposed to the capacity-expansion battle where we were all trying to keep up with the growth rate of the industry. That means there has to be a lot of
improvement in operations, whether in the way we run fabs or in the way we run our equipment businesses for minimum costs and competitiveness. There'sjust a lot more cost pressure across the industry, all the way
from the component to the
equipment providers."2.4 Resource based view
The resources of Agilent, including the CSTC, are designed to support the primary goal of the firm as noted in section 2.2 above. As a result, the CSTC production objective is to lead the world in prototype, new product introduction and low-volume high-mix manufacturing. In addition, since engineering innovation is central to Agilent's competitive advantage, product and process innovation are tightly coupled. For the CSTC this link between product and process innovation is a key resource in development and delivery of oscilloscopes and logic analyzers because the engineers are co-located.
Overall, however, the goal of the company is to remove manufacturing from the critical path of delivering innovative products to high-end customers. Recently with the market softness, there has also been an emphasis on limiting manufacturing costs; however, this is not historically a primary business concern for Agilent. In general, Agilent cultivates world-class engineering innovation, while manufacturing operations are a lower priority.
Because of the significant first-mover advantage for an innovation-based strategy, the capacity strategy for the organization has been to lead demand. That is, the CSTC aims to have more manufacturing capacity than the market requires, so capacity does not become a "bottleneck" for the company (Goldratt 1984). With such a strategic design, marketing and sales are usually the bottleneck, not the factory. During the boom of 1999, however, total industry capacity, as well as capacity at Agilent, lagged market demand and this re-positioned manufacturing as a bottleneck. Thus the boom of 1999 shows that it is possible in a highly cyclic industry despite a capacity strategy to lead demand, to end up lagging demand at the peaks of business cycles.
Policies of Agilent corporate and the macro-economic environment influence CSTC resources in several ways and thus must be considered in any future operations strategy development. The company is continuing to lower its cost structure by converting previously fixed costs to variable costs. Following this emphasis, managers are encouraged to outsource as much as possible. While management at CSTC supported this corporate initiative, they found that some products could not be made outside and after several tries were forced to bring the products back in-house for manufacturing.
Although previously the CSTC had been part of the Colorado Springs Group profit center, the CSTC is currently organized as a cost-center. Measures of success for CSTC management include: on-time delivery, warranty rates, injury/illness rates, variance in controllable spending, variance in cost of sales, variance in price of purchased goods, and variance in inventory dollars. Because of the cost-center mentality, one can see that most of the management metrics are focused on variances with the plan or budget for the quarter. The only management metrics that are absolute are on-time delivery, warranty, and injury/illness rates. This is an important consideration for a new operations strategy that will be revisited in the implementation section (Chapter 5).
2.5 Chapter summary
This chapter presented the current strategy of Agilent and the Colorado Springs Technical Center in terms of the value proposition, the capabilities, the processing network and resources of the firm. As indicated by the CEO, Ned Barnholt, in his speeches, the nature of competition for Agilent and CSTC is changing, so the company must respond by re-considering its strategy.
This chapter highlights the importance of articulating an operations strategy even in a high-margin, low volume business like electronics test and measurement. An operations strategy provides cohesion between the high-level business strategy of the CEO and the daily decisions that must be made by line managers. In addition, it helps unify decision-making amidst pricing pressure, as a sector matures or under cost rationalization pressure during a market downturn.
Often a clear operations strategy that integrates with the financial and overall strategy of the firm has not been articulated. This was the case at CSTC at the beginning of the applied research project. The management's operations strategy was primarily reactive as is often the case in a rapid market downturn. One of the goals of this work was to encourage CSTC management to articulate a proactive operations strategy based on the market realities and resources of the division in order to clearly define the means to achieve the firms' performance objectives.
Chapter 3: Direct observation of the current reality
This chapter introduces the CSTC role in the supply chain and provides both a qualitative and quantitative description of the current state of operations in this supply chain from the perspective of the component supplier. Although industry cycles in the electronics test and measurement business are outside of the control of Agilent management, internal sources of variability can be minimized. This chapter presents sources of internal
variability in the CSTC supply chain by examining internal data from forecasting, planning, and customer order flow. In addition, it considers other operational practices regarding capacity, job scheduling, inventory management, and metrics which also contribute to the internal bullwhip effect as it applies to the CSTC - at the tail end of the internal Agilent supply chain.
Whereas Figure 1.1 from the introduction illustrates Agilent's position in an external supply chain relative to electronics consumers, Figure 3.1 illustrates the position of CSTC within the internal Agilent supply chain, relative to direct customers of Agilent
-typically other electronics and semiconductor businesses.
raw material
CSTC final assembly Agilent
components & test customer
conrc (Malaysia)
contract
components manufacturer
(board load)
upstream downstream
Figure 3.1: CSTC supply chain material flow
The CSTC and the final assembly and test site in Malaysia (officially known as PIMO -Penang Integrated Manufacturing Operations) are facilities owned by Agilent, but
lower-level components can be sourced from either internal or external suppliers depending on the part. In today's supply chain design printed circuit boards (PCBs) are almost always loaded for Agilent by a third party contract manufacturer (CM). The data presented in this section will focus on the shaded supply chain nodes which are wholly owned and controlled by Agilent. In the future, the same type of analysis and supply chain mapping could be extended to include the other nodes of the Agilent supply chain.
3.1 Forecasting and planning
"In our business, we look at technology waves. In the communications industry, storage industry and computer industry, new standards come along at a fairly rapid pace. Ifyou
don't catch that wave, you've missed the market. These waves generally are not very
long, so you have to be there right at the front edge to be able to capitalize on them. "(Barnholt 2003)
Demand planning and forecasting of product sales is a sophisticated and complex process at Agilent Technologies. The company strategy of innovation dictates that Agilent is constantly pushing the "clockspeed" of the industry faster (Fine 1998). This makes it very important to effectively manage the ramp-up and ramp-down of products as typical life-cycles for high-end oscilloscope products have shrunk from 15 years to less than 3 years, with under one year of sales at peak margins before a higher performance product will begin to cannibalize the market.
Product family forecasts are developed and updated monthly by demand planners who work for a marketing group in a specific division. Detailed internal statistics are kept by the marketing organization on the historical accuracy of the forecasts, forecast bias, confidence intervals, etc. A product within a family may originally be forecast as a percentage of the total family demand. As the product family begins to sell and more information is available about customer preferences, this planning percentage is often adjusted to reflect actual customer demand. Although significant adjustments are
common for individual products, or product options, forecasts for aggregate product families are quite accurate.
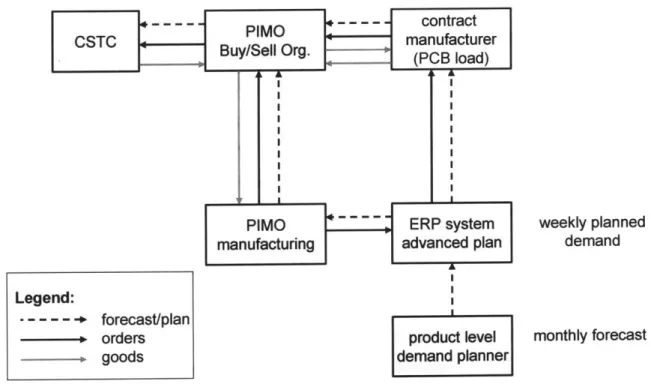
Figure 3.2 shows graphically the way in which forecast information is propagated throughout the organization to lower level component suppliers, such as the CSTC, through the ERP system.
S- - - PIMO - - --- contract
CSTC BuyMeO Org manufacturer
Buy/Sll Og. W(PCB load)
L A
PIMO ~~~~ ERP system
manufacturing advanced plan
IL I
weekly planned demand
monthly forecast
Figure 3.2: Flow of information and parts through the supply chain
A typical monthly forecast predicts 18 months into the future and is first entered into the computerized ERP system and then translated from calendar months to ERP system weeks. If necessary, forecasts can be updated by the demand planner, but only for time periods two months out in the future or greater. Although the conversion of the forecast from calendar months to ERP system weeks introduces some additional variability into the system, it can be shown mathematically that the additional variability is not
significant (see Appendix A). However, this additional variability can cause some confusion to planners who review the weekly planned orders and see the production rates changing, when in fact they are not changing.
Legend: --- -~ +forecast/plan - orders goods product level demand planner
Once the forecast is in the computer system as "planned demand", the forecast is "exploded" down to lower level components of the forecasted product based on the product bill of materials, options, and planning percentages. For components that the CSTC sells directly to PIMO via the buy/sell organization, the planned demand seen in the ERP system by CSTC contains both demand that might be manually entered by PIMO (special orders, big sales, yield loss issues at PIMO) and demand that is derived from the original product forecast. Because the plan is "run" weekly, the propagation of changes to lower level components happens weekly between internal organizations. The weekly planned demand is changed often as production schedules for final assembly and actual customer demand patterns change.
One surprising observation is that it was not possible for a planner at the CSTC to use the centralized ERP system to view the original upper-level forecast data entered by the division demand planner for his or her assigned products. Permission settings in the ERP system restricted planners in one Agilent organization from accessing information in another Agilent organization, because the ERP system treated each organization code as a separate entity. This was a change from previous IT systems used by CSTC which had developed organically at the division level and allowed information sharing within a division, but not necessarily across divisions.
Planners in the CSTC employed several coping strategies to improve information transparency. First they had almost daily phone calls with the buyers in Malaysia to confirm orders and to understand the relative importance of orders in the ERP system. Additionally, when demand seemed very strange, planners at CSTC would sometimes speak directly with the product level demand planner. Although this practice was
acceptable in the past within the Colorado Springs Group, management in Malaysia very much discouraged this information sharing.
Another less surprising observation is that despite the sophistication of the original forecast information produced, the only information that gets propagated through the
ERP system to lower level suppliers is a point forecast - not the forecast with bands of confidence or certainty. For example, a forecast that was highly accurate and one that was known to be much less accurate by the demand planning organization would both be translated by the ERP system to a supplier as a single point forecast. Therefore, much of the important information contained in a forecast could be lost as it was "exploded" through the bill of materials. (Note: Agilent is actively pursuing methods to include this information such as structured contracting. However, this relatively new approach is not pervasive within the company and not used currently with internal suppliers (Schmidt 2003).)
In the case of an external supplier, such as a PCB loader, the supplier can access a website that provides the weekly planned demand for the supplier's parts. This information is updated weekly. The PCB loader takes this weekly planned demand information and generates its own forecast. If the PCB uses parts which are supplied by an Agilent internal organization such as CSTC, the new forecast of the PCB loader is then entered manually on a website for the Agilent buy/sell team. The buy/sell team then translates the information back into the ERP system for the CSTC.
This additional translation requirement adds a minimum two-week delay to the demand planning process for externally processed parts when compared with the internal process. For example, for an externally loaded PCB in week one, the demand is shared with the contract manufacturer (CM). In the second week, assuming no data accuracy issues, the new demand is shared from the CM to the Agilent Buy/Sell team. In the third week the information is updated in the plan seen by the CSTC. In addition, Agilent employees often referred to the forecast being "broken" when it was sent to outside contract manufacturers. This is because once a part had gone outside the ERP system and
required manual entry of lower level demand information, it was not possible to trace the demand signal back to the original forecast for a part (although theoretically it should be).
Within the division that makes oscilloscopes and logic analyzers, the demand planner who generates the monthly forecasts is measured on three qualities: bias, forecast error
and stability. This information is also used to improve the monthly product forecasts in the future. An interesting observation is that beyond the monthly forecast, there is no formal measure of weekly demand plan accuracy. In addition, the weekly demand plan, which is updated weekly, is not archived, so it is not possible to determine its bias, error, or stability in comparison with actual orders. Currently there are no metrics focused on the weekly demand plan, so information about it is not monitored.
Several meaningful conclusions can be made from this high-level treatment of Agilent's demand planning and forecasting process.
1. The traditional role of demand planning in Agilent is to serve the sales and marketing organization, not production and operations.
2. Lower-level internal component suppliers, such as CSTC, do not have access to end customer demand data, despite an integrated ERP system.
3. Lower-level internal component suppliers, such as CSTC, receive different demand information than final assembly and test sites because of delays in propagation of the forecast (~ 2 weeks) and various built-in order modifiers in the ERP system.
4. The conversion of monthly forecasts to ERP weeks does not significantly affect forecast variability (see Appendix A).
3.2 Customer order flow
Given the uncertainly in much of the supply chain data as well as the lack of archived information on forecasts and demand in particular, one method which proved valuable in characterizing the supply chain was to map the flow of customer orders. The following example illustrates this useful methodology.
3.2.1 Determine true customer demand at final assembly factory
First, a component manufactured by CSTC is chosen. Using bill-of-materials data all the upper level assemblies which use the component are identified as well as the quantities of each component per upper level assembly.
Next, historical order data is collected for each of the final customer-purchasable products identified. There are many dates associated with a customer order in the ERP system, such as order-ordered date, order booked date, customer request date, order ship date, etc. This example uses the customer request date, which represents the date the customer would like to have the product, minus the average shipment time in days from the final assembly plant to the customer location. The product order history data is then aggregated based on the BOM structure quantities previously identified. This
transformed and aggregated data represents what we will call the true demand for a given CSTC component at the final assembly site.
While the customer order data was recorded daily, internal orders between organizations were only placed weekly so it is logical to aggregate customer order data into weekly buckets. Monthly buckets were also considered. However, with high-end products having a maximum life cycle of three years, a product in production was likely to have less than 15 monthly data points available so weekly data aggregation was selected as the preferred method. Figure 3.3 shows aggregated customer demand for Component A.
0
CU
5 10 15 20 25 30
Calendar Week
Figure 3.3: Component A weekly customer demand data'
For example, if this demand was approximately normally distributed with a mean, D ~ 40 and a standard deviation, GD 20, customer orders as seen from the perspective of final assembly would have a coefficient of variation (COV) as follows:
COV ,,,,,,= = 0.5 Cofinalassemhly -' .
PD
3.2.2 Determine order history between final assembly and component
manufacture
Shipment requests (i.e. orders) are placed weekly between the buyer at the final assembly site (PIMO) and the planner at the component manufacturing site (CSTC) via the
computerized ERP system. This is a semi-automated process in which the computer will recommend the order, but the buyer and planner must both electronically approve the 1 Throughout this thesis y-axis numerical values are blank in order to protect the confidentiality of the sponsoring organization. In some cases specific numerical results are provided for the purposes of example and should not be construed to be actual results of the sponsoring organization.
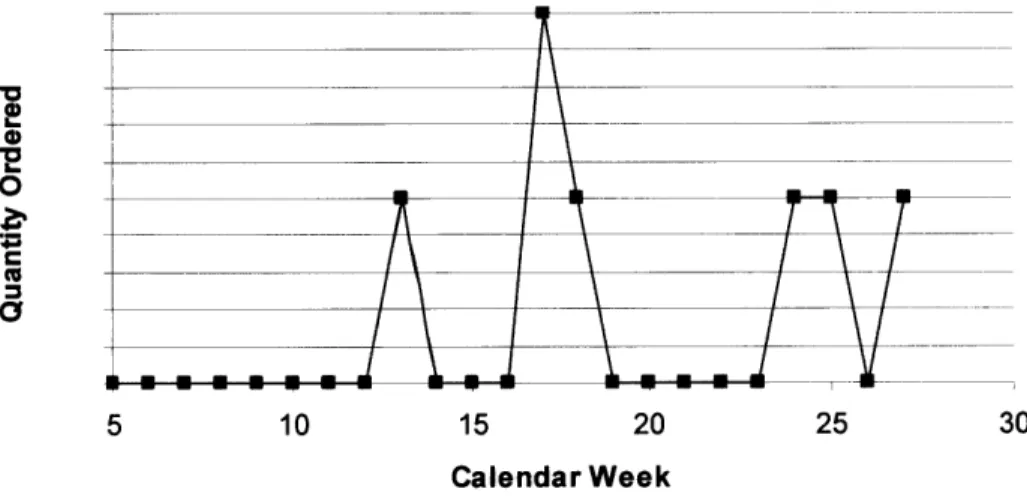
order before it will ship. The size of the order is determined by the demand forecast for the next week at the final assembly site, any yield loss in final assembly, and any order modifiers which restrict the minimum, maximum or multiple size of the order. For example, if electronic chips supplied by the component manufacturer are delivered on a reel with 100 units per reel, this would be the multiple required by the order modifier. Figure 3.4 shows an example of the order history for a product between the final assembly site and CSTC.
'E_ _ _ _ _ __ _ _ _ _ _
CY
Imum~rnLm> I
-5 10 15 20 25 30
Calendar Week
Figure 3.4: Component A weekly order history between final assembly and CSTC
Note that because of order modifiers in the system for this component, the final assembly site is ordering in groups of units. For example, if we let each order be for 50 units and consider an order an event, this data can be approximated by a Poisson distribution with mean k= 0.52 and variance X = 0.52. The coefficient of variation (COV) for the order
history in Figure 3.4 can then be calculated (See Appendix B for additional calculation details).
3.2.3 The internal bullwhip effect
With a mathematical representation of the true customer demand and the internal order history between final assembly and the component manufacturer the variability can be compared between the two nodes of the supply chain using the coefficient of variation.
=COVopnet 1.4
Variability Amplification - '"'"o""n"' - 1 = 2.8
CoVfinalassembly 0.5
This means that given a certain variability of customer demand, the structure and system of propagating orders from final assembly to component manufacturing is amplifying that variability by 2.8 times. This phenomenon of increasing variability as we move upstream in the supply chain is known as the bullwhip effect and the comparison of COVs between nodes of a supply chain is one way to quantify the bullwhip effect (Simchi-Levi 2003).
3.3 Capacity management
Manufacturing capacity at a firm can be considered in terms of human resources,
machine resources, and contracted/purchased resources. Each type of capacity possesses unique aspects to be considered in operations planning and strategy.
For physical resources, the CSTC facility had excess machine capacity. It was originally designed for three shifts of almost 24 hours a day operation, but was currently only running one or at most two eight-hour shifts per day. The equipment supported both low and medium volume production processes for Agilent. Prior to the downturn in 2001, the CSTC produced some high volume thick-film products, so it also had some automated equipment alongside the semi-automated and manual process equipment typically used for lower volume products and prototype production.
Although in 2004 there were sufficient machine resources in aggregate, it was possible at times that due to the high mix of product a particular machine in test could be
over-utilized. Manufacturing at CSTC is divided into three areas: (1) thick film; (2) wire bond, die-attach and laser; and (3) assembly and test. While the equipment in the thick-film, wire bond, die attach, and laser areas was primarily flexible and could be used to manufacture a variety of products, the equipment in test was specialized. For example, Component A could only be tested on Test Equipment A. Therefore, if demand was high in a particular week for multiple components that all required final test on Test
Equipment A, this could lead to Final Test being a constraint on throughput for CSTC.
The second determinant of CSTC capacity is human resources. The typical response by management, if test was becoming a bottleneck due to uneven distribution of work between test equipment, was to shift some test operators to second shift. In addition, most operators were cross-trained in order to increase human resource flexibility, thus
improving the responsiveness of CSTC to mix variability.
Reducing variability or "smoothing" demand on human capacity was a significant concern of management in the CSTC. During the downturn, the total number of operators had been reduced from a peak of 110 to 14. This weighed heavily on
management's mind as demand for CSTC products picked up. Management preferred to contract temporary workers to support peak demand periods rather than to hire Agilent employees. This was also due to the corporate emphasis on reducing fixed costs. Total operator hours were closely tracked by manufacturing planning. During this six-month project, operators were typically over 100% utilization according to the plan; however, management was still cautious about bringing on more operators. Only when the plan going forward showed a period of greater than 100% operator utilization for longer than two quarters did management work to bring on additional operators.
The theoretical implication of this approach to human capacity is that as utilization approaches 100%, queueing times for work orders in the CSTC shop will approach infinity. However, since this is not an acceptable outcome, other actions will be taken by management before the actual queueing time reaches infinity. These measures will likely
Another proxy for human resource capacity at CSTC is process engineers or technicians. Although this type of information was not tracked by the ERP system, skilled technicians or process engineers were regularly needed to assist with set-ups for manufacturing. These setup times represented about four to five times the per unit processing time for components made at CSTC. Sometimes operators would have to switch to work on another work order, while they waited for a skilled technician or engineering to assist with a setup.
The CSTC was increasing its use of outside vendors as part of the Agilent strategy to reduce fixed costs. In general, this strategy was effective in reducing fixed costs for the company; however, as CSTC was a low volume customer for these vendors, the CSTC could not exert much buyer power over the vendors. Often this led to delays in material availability for key CSTC components, which delayed the start of work orders according to the plan. As a result, CSTC management was considering the possibility of reserving some capacity at key vendors in the future.
3.4 Job scheduling and WIP management
"WIP is what it is. WIP is not something we can control. We have to report on it, but I really don'tfocus on it because it is not determined by us." - Planning manager at CSTC
Work orders at the CSTC are scheduled for release into the shop by the centralized ERP plan. They are released based on the lead time for the component, as long as the planner for the item has verified that the material is available to complete the job. Capacity of the shop is not considered when releasing jobs according to the plan.
An important relationship between WIP, throughput and cycle time is expressed by Little's Law (Spearman 2000):
I=R*T
Consider the status of WIP at the CSTC. At current production levels there were on average 300 work orders in WIP in the CSTC shop at any given time. These 300 work orders were made of 124 different part numbers on average. Each work order would take an average 80 hours of processing time to complete (not including queueing time).
Therefore we have I = 24,000 hours of work. On average there were 12 operators working on first shift and 4 on second. The rate of work completion is then R = 128 hours per day. From Little's Law we get an average 187 days completion time!
While the above estimate is extremely rough, it can certainly be concluded that there were significantly more jobs in the shop than could be expected to be worked on in a given day or week. This rough estimate was confirmed by conversations with operators who estimated on average each operator would work on 1-2 jobs per shift, i.e. about 32 jobs would be worked on in a given day or about 10% of the 300 jobs in the shop.
With so many jobs to choose from, scheduling and prioritization of jobs was very important and challenging. Every morning, CSTC lead operators, planners, and managers would meet to determine priorities for the day based on shipment requests in the ERP system and phone conversations with customers. Because of the limited human
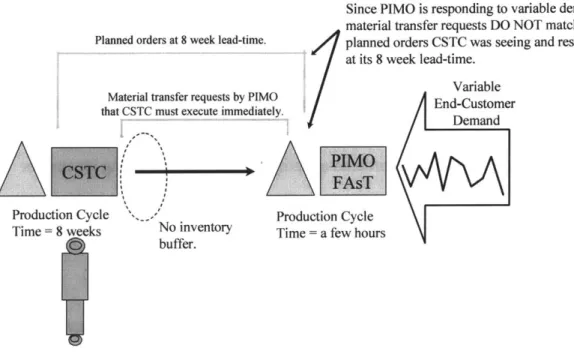
capacity of the shop, this method ofjob scheduling resulted in the use of CSTC WIP as a (un-intentional) buffer or shock absorber. This shock-absorber is a coping mechanism that was developed by the CSTC management in order to meet the variability in demand they saw from internal customers. In the current situation, the supply chain shock
absorber requires the CSTC to accelerate and decelerate work in process in an attempt to meet material transfer requests via a highly manual process. Figure 3.5 illustrates this principle.
I
Production Cyc Time = 8 weeks,
Since PIMO is responding to variable demand, the material transfer requests DO NOT match the lanned orders at 8 week lead-time. planned orders CSTC was seeing and responding to
at its 8 week lead-time.
/1'
VariableMaterial transfer requests by PIMO End-Customer
that CSTC must execute immediately Demand
le ..--' Production Cycle
No inventory Time = a few hours
buffer.
Figure 3.5: WIP used as a shock-absorber for demand variability
3.5 Inventory and safety stock management
CSTC had an official "no inventory" policy which was originally implemented during the downturn of 2001 in order to flush cash out of the supply chain. Another way to describe this policy is that CSTC would only complete a work order from WIP if it had a shipment request from a final assembly site for that component.
Because a typical component manufactured by the CSTC took between 2 and 8 weeks to manufacture, the "no inventory" policy significantly hampered the ability of CSTC to deliver product on-time to the final assembly site in Malaysia. Consider the best case scenario in which the forecasted demand is normally distributed with the same mean (g) and standard deviation (a) as the actual demand - i.e. the forecast is perfect. Even in this perfect world, CSTC would meet or exceed actual demand only 50% of the time. Put another way, although CSTC management had metrics that assessed on-time delivery to CSTC customers with a target of 90% or better on-time delivery, the current system structure had set up the facility for failure to meet this metric.
As a side note, actual on-time delivery performance ranged from 55% - 65%. In addition to the accumulation of partially completed product in the form of WIP (see section 3.4), one coping strategy developed by CSTC in order to improve on-time delivery
performance was to use the effect of manufacturing lot-sizes as an advantage. In reality, CSTC did not have zero inventory; instead the facility accumulated limited inventory as a result of the difference between the ordered quantity and the manufacturing lot size for the component.
3.6 Internal on-time delivery
On-time delivery between the CSTC and its internal customers was an important metric for the organization. A minimum acceptable on-time delivery (OTD) target had been set at 90%. In order to report performance against this goal, the planning manager
considered the information he could obtain from the new centralized ERP system and decided to use shipments. Because of international import/export regulations for high-end electronics and accounting rules, each shipment leaving the CSTC contained only one type of component. As the parts were small and lightweight, all shipments were made by air and the overwhelming majority of shipments arrived at their destination on schedule based on the ship date. Using this information, the organization currently compared the required ship date for on-time delivery to the actual ship date and compiled all shipments for the month to determine an aggregate on-time delivery percentage for the organization.
While this method for reporting OTD was convenient, because the information about shipments could be exported directly from the ERP system to a spreadsheet, the data is not particularly useful for decision making or control. It seemed instead to be collected for the purpose of reporting on the metric of OTD. Consider the following example which shows why the shipments measure does not provide consistent and useful data for decision making.
The final assembly site places two shipment requests for Component A from the CSTC. One shipment should be completed today (Week 0) and one should be made on Week 8. Each shipment request is for a quantity of 50 units of Component A. Let us suppose the CSTC only has 10 units available in Week 0 and ships these. Then each subsequent week, the CSTC continues to ship 10 units as the component manufacture is completed until the first order for 50 is satisfied. In Week 8 the CSTC has 50 units available and ships them as requested. Table 3.1 summarizes this simple example.
S50 10 Yes 10 Yes 1 10 No 2 10 No 3 10 No 4 10 No 5 6 7 8 50 50 Yes 50 No
Reported on-time delivery: 33% 60% 50%
Table 3.1: On-time delivery metrics example
Note that under the current reporting method, 33% OTD would be reported while under a more traditional service metric called fill-rate, the percentage of units shipping on-time would be reported. Using fill-rate in this case we would report 60 units on time out of 100 units ordered for an on-time delivery or fill-rate of 60%. Fill-rate is commonly referred to in the literature as Type II service (Nahmias 1997; Spearman 2000). Another commonly used measure of service level in the literature is called Type I service. It measures weekly if a stock-out has occurred. This metric is captured by the third column in Table 3.1. While a metric based on a Type II service level definition will always be higher than Type I, it more typically represents the type of information management in an organization desires.
Note that the current metric discourages a practice that may be in the best interest of the organization - that is shipping partially complete orders. In the example above, if the CSTC had simply waited until all 50 units for the first order were complete and shipped them as one shipment, the OTD would actually increase to 50%, according to the currently used metric, although the result may be less desirable for the customer.
A second concern applies to all the commonly used metrics for on-time delivery
performance - they equally penalize an order that is one week late and an order that is 8 weeks late. Certainly the effect of this difference on the customer is significant and should be considered in any newly proposed system.
No matter the definition of the metric, however, OTD for the same Component A as described in Figure 3.3 and 3.4, averaged 50 - 65% during the past 9 months which was significantly below the minimum management target of 90% and all parties conceded that improvement was necessary in the realm of OTD to CSTC customers.
3.7 Chapter summary
The primary take-away from this chapter is that the current reality of operations at the CSTC can be characterized as "launch-and-expedite". In other words, work orders are launched into the process based on the plan. These planned orders continue through manufacturing until a shipment is requested by the corresponding internal customer. Then the responsibility of a planner or manager at the CSTC is shifted to expedite mode. The work order is prioritized in a morning team scheduling meeting and expedited to the customer in order to achieve an on-time shipment for the organization.
It is important to note that this system of "launch-and-expedite" was not part of an operations strategy articulated by the firm, but instead a coping mechanism developed by the planners and production managers for dealing with the "no inventory" edict and the
extreme demand variability they experienced at their node in the supply chain. Chapter 4 will explore other strategies for mitigating the demand variability seen at the CSTC
supply chain node. The trade-off is that the strategies recommended in Chapter 4 will require coordination and communication across organizations, while the coping strategy of using WIP as a shock-absorber focused on what was immediately controllable by the planning manager at CSTC.
The quantitative data presented in this chapter on order flow or on-time delivery represents the simplest case - a component that passed directly from CSTC to PIMO
without an intermediary step at an outside contract manufacturer. Certainly a process that requires this additional step would experience even greater variability amplification and
internal bullwhip effect from the actual customer orders to the demand experienced by the CSTC. Approximately 50% of component types manufactured by the CSTC went on to a contract manufacturer prior to final assembly while the other half went directly to
final assembly.
In addition, it should be understood from this chapter how current metrics for specific organizations (marketing & sales, product line inventory manager, planner, etc.) drove a focus on specific outcomes. It did not seem that any person or organization was
responsible for the operations system as a whole. This is often the case in a corporation, where in the nature of efficiency job tasks are split and work is specialized. While it makes sense that the majority of a corporation should be engaged in work tasks in this manner, it is equally important that some portion of an organization consider the big picture and system as a whole. Otherwise, as in the case of CSTC, many small
independent operations decisions can combine to create a significant operations performance shortfall.
While a well articulated operations strategy can help guide dispersed decision making, there are also tactical steps and processes which can be put in place to help support
system level operational excellence. Chapter 4 will examine a variety of such tactical steps that could be implemented by an organization like the CSTC in conjunction with its customers and suppliers. Chapter 5 will reflect on a limited scale, actual implementation
of the recommendations from Chapter 4. Chapter 6 on the other hand will address more strategic operations concerns and the organizational fit of these at Agilent and the CSTC.
Chapter 4: Hypothesis for change towards the ideal state
Hypothesis: Implementing safety stock as a buffer to decouple the demand variability of end-customer orders from the planned work orders for components would significantly improve operational performance and, in particular, on-time delivery of components within the Agilent supply chain without incurring additional costs.
Figure 4.1 below illustrates the decoupling effect of the buffer safety stock between the two supply chain nodes.
Vaiable
Endistomer
Make
to
planI
CZ
KC
PIMO
"
Make
to order
Figure 4.1: Decoupling statistical safety stock buffer (FGI)
In order to test the hypothesis above, a mathematical model was used to quantify the effects of the proposed change (adding statistically-sized safety stock) on inventory levels throughout the supply chain in conjunction with on-time delivery performance, as well as plan stability. Statistically determining optimal safety stock levels for the decoupling buffer required multiple inputs including those shown in the figure below.
Gather Data Days of supply (order sizinrg) I Economic build quantities Item level F RForder processing Chantify forecast error IOTD mtis Imp~lenlnt Establish statistical
safety-stock
m-throughout supply chain.Monitor
Rbview SS settings quarterLy Prioritize exception messages Communicate significant rate [hangesLOTD & inventoryI evel s
Figure 4.2: Building blocks for operational excellence
This chapter focuses on gathering the proper input data in order to calculate statistical safety stock levels for the proposed buffer and on determining which settings in the ERP system must be adjusted in order to implement a safety stock buffer as proposed in Figure 4.1 above.
4.1 Order sizing
The size of orders placed between the final assembly organization and the component supplier organization can significantly alter the magnitude of the bullwhip effect experienced by a component supplier (Spearman 2000). Section 3.2.2 plotted data for orders for Component A between a final assembly site in Malaysia and the CSTC and it highlighted the effect of a minimum order quantity of 50 on order variability. According to their own admission, planners at the CSTC set current order sizes somewhat arbitrarily at the beginning of a components life, in order to prevent too high an order frequency
from the final assembly sites. Therefore, order sizing was identified in this study as an opportunity to reduce the internal bullwhip effect.
When there is an explicit cost to placing or shipping an order between organizations, an economic order size can be calculated using standard formulas (See Appendix C). In the example of the CSTC, however, ordering costs are implicit. Orders are suggested