HAL Id: hal-02337361
https://hal.archives-ouvertes.fr/hal-02337361
Submitted on 29 Oct 2019HAL is a multi-disciplinary open access
archive for the deposit and dissemination of sci-entific research documents, whether they are pub-lished or not. The documents may come from teaching and research institutions in France or abroad, or from public or private research centers.
L’archive ouverte pluridisciplinaire HAL, est destinée au dépôt et à la diffusion de documents scientifiques de niveau recherche, publiés ou non, émanant des établissements d’enseignement et de recherche français ou étrangers, des laboratoires publics ou privés.
Determination of modified figure of merit validity for
thermoelectric thin films with heat transfer model: Case
of CuCrO2:Mg deposited on fused silica
Inthuga Sinnarasa, Yohann Thimont, Lionel Presmanes, Antoine Barnabé,
Philippe Tailhades
To cite this version:
Inthuga Sinnarasa, Yohann Thimont, Lionel Presmanes, Antoine Barnabé, Philippe Tailhades. De-termination of modified figure of merit validity for thermoelectric thin films with heat transfer model: Case of CuCrO2:Mg deposited on fused silica. Journal of Applied Physics, American Institute of Physics, 2018, 124 (16), pp.165306. �10.1063/1.5054108�. �hal-02337361�
OATAO is an open access repository that collects the work of Toulouse
researchers and makes it freely available over the web where possible
Any correspondence concerning this service should be sent
to the repository administrator: tech-oatao@listes-diff.inp-toulouse.fr
This is an author’s version published in:
http://oatao.univ-toulouse.fr/24515
To cite this version:
Sinnarasa, Inthuga
and Thimont, Yohann
and Presmanes, Lionel
and
Barnabé, Antoine
and Tailhades, Philippe
Determination of modified
figure of merit validity for thermoelectric thin films with heat transfer model:
Case of CuCrO2:Mg deposited on fused silica. (2018) Journal of Applied
Physics, 124 (16). 165306. ISSN 0021-8979
Determination of modified figure of merit validity for thermoelectric thin films
with heat transfer model: Case of CuCrO
2:Mg deposited on fused silica
Inthuga Sinnarasa, Yohann Thimont,a)Lionel Presmanes, Antoine Barnabé, and Philippe Tailhades
CIRIMAT, Université de Toulouse, CNRS, INPT, Université Paul Sabatier, 118 route de Narbonne, 31062 Toulouse Cedex 9, France
Thermoelectric performance of a material is determined using a figure of merit (FOM) determined as ZT (ZT = σS2T/κ where σ is the electrical conductivity, S is the Seebeck coefficient, κ is the thermal conductivity, and T is the temperature). In the case of a thin film, it is normal in the first approach to consider calculating the FOM by using the thermal conductivity of the film. However, both the thermal influence of the substrate and the emissivity of the film must also be taken into account. In the present work, the heat transfer model is used in order to study the influence of the thermal con-ductivity, the thickness, and the emissivity of the film on the thermal gradient of the stack (substrate + thin film). The limits of these three parameters are determined in order to have the temperature vari-ation due to the presence of the film compared to the substrate alone that remains less than 1%. Under these limits, the thermal conductivity of the substrate can be taken into account instead of the thermal conductivity of the thin film, and a modified FOM (Z’T) can be calculated. The present study leads to the determination of the validity of modified ZT. In the case of CuCrO2:Mg thin films,
the model shows that the use of Z’T is valid. The calculated value of Z’T with the measured Seebeck coefficient and the electrical conductivity as a function of the temperature for 100 nm thick films and the temperature dependent thermal conductivity taken from the literature reached 0.02 at 210 °C. A thermoelectric module made with this material showed 10.6 nW when 220 °C is applied at the hot side. Published by AIP Publishing.https://doi.org/10.1063/1.5054108
I. INTRODUCTION
Among the physical properties of materials, knowledge of the thermal properties is crucial for a large range of appli-cations such as microelectronics,1,2 microelectromechanical system,3thermal barriers,4,5thermoelectrics,6and photonics.7 The determination of thermal conductivity is especially essential to calculate the figure of merit ZT (ZT = σS2T/κ where σ is the electrical conductivity, S is the Seebeck coeffi-cient, κ is the thermal conductivity, and T is the temperature) which can reveal the performance of a thermoelectric mate-rial. The measurement of the thermal conductivity is fairly well controlled in the case of bulk materials despite the long measurement time, the cost, the specific size of the sample, and the specimen preparation.8However, it is even harder to determine the thermal conductivity in the case of thin films due to the small quantity of matter, which transfer the heat. The 3ω method,9,10 which is generally used to characterize the thermal conductivity of the thin film, requires some approximations as isothermal and semi-infinite substrate, 1D quasi-static heat flow in the film, negligible convection and radiation, and insulating thin film. This method is restrictive due to the use of microelectronic processes with several steps, and it is not valid for samples with high porosity.11
In a previous work, we have studied the thermoelectric properties of Mg doped CuCrO2 thin films, deposited using
radio frequency magnetron sputtering. We have optimized
the annealing temperature12 and the thickness13 in order to get the highest power factor (PF = S²σ). One advantage of the thin films as thermoelectric materials is that the thermal con-ductivity can be lower compared to the bulk due to micro-structural effects.14,15 Nevertheless, due to the difficulty of the thermal conductivity measurement on thin films, the figure of merit ZT could not be calculated. Some authors took into account the contribution of the substrate in the ZT determination.16Pérez-Rivero et al.17have calculated a mod-ified figure of merit, ZT’, using only the thermal conductivity of the substrate without any demonstration of the validity of this relation.
In the specific case of a thin film, one can expect that the temperature gradient in the thin film deposited on the sub-strate can be influenced by the thermal conductivity of the substrate. In this work, we have focused on the contribution of the substrate thermal properties on the thermal behavior of the film. The impact of different characteristics of the film such as the emissivity, the thermal conductivity, and the thickness on temperature gradient at the surface of the thin film have been checked.
II. METHODOLOGY
A. Description of the model geometry
In this work, Comsol Multiphysics software is used in order to study the thermal properties of a thin film deposited on a substrate. The studied geometry is based on a 3D model of the substrate and the film as its top surface (Fig.1). Fused
a)
silica and Mg doped CuCrO2 are assigned for the substrate
and the film, respectively.
In order to study the heat transfer and determine a tem-perature profile, four measuring points are placed at the surface of the thin film and at the surface of the substrate without film to record the temperatures. Then the physic “heat transfer in solids” is applied. This physic requires several physical properties (emissivity, specific heat, thermal conductivity, and heat exchange coefficient), initial condi-tions (heat source temperature and environmental tempera-ture), and boundary conditions (thicknesses and dimensions) which will be described in the next part. Following this, the mesh is selected. The tetrahedral elements with fine mesh are well adapted for this model and are geometrically simple. Indeed, the type of the mesh can strongly affect the simula-tion so the elements and element size were carefully chosen. Once the mesh is correctly made and the mesh nodes coin-cide with the measurement points, the study is carried out in a steady state.
B. Description of the used heat transfer laws
The heat transfer in the solid model uses the heat Eq.(1)
as the mathematical model and can be characterized by three mechanisms described in Fig.2.
ρCp @T
@t þ Δ~q¼ Q, (1) where ρ, Cp, T, t, q, and Q are the density, the heat capacity,
the temperature, the time, the heat flux by conduction, and the heat source, respectively. The heat source describes heat generation within the domain.
In this study, the temperature of the heat source is fixed to 100 °C, and the contact thermal resistance between the substrate and the film is neglected because the CuCrO2:Mg
thin film is dense and well attached to the substrate.13 For a steady–state problem, the temperature does not vary with time and the first term disappears.
Figure 2 describes the heat transfer model where three modes (heat conduction, heat convection, and radiation) exist. • The heat conduction in solids is the transfer of heat
occur-ring by free carrier motion and lattice/molecule vibration. In general, the main part of the heat transfer in solids is
due to the heat conduction which is described by Fourier’s law18in Eq.(2),
~q¼ #k ΔT!!, (2) where q! the heat flux vector, k is the thermal conductivity that is taken as isotropic in this study, and ΔT is the tem-perature gradient.
• The heat convection occurs when the heat is dissipated due to a flowing fluid.19The heat dissipation from a solid surface to a fluid is described by the heat transfer coeffi-cient, h, following Eq.(3).
~n% ~q¼ h (T # T
1), (3)
where n! is the normal vector of the boundary and T1 is the room temperature.
In our case, the external natural convection with a laminar air flow20already implemented in Comsol is chosen. • The heat transfer by radiation takes place through the
photons at the surface of the material and describes Stefan Boltzmann’s law.
~n% ~q¼ εσ(T4# T4
1), (4)
where ε is the emissivity and σ is the Stefan’s constant (5.67 × 10⁻⁸W m−2K−4).
III. EXPERIMENTAL DETERMINATION OF THE PHYSICAL PROPERTIES
In order to solve the above equations, some unknown properties such as the heat capacity, the emissivity, the density, and the thermal conductivity of the substrate and the thin film must be determined in advance.
There is no influence of specific heat capacity in the steady state study as shown in Eq. (1). However, we have still determined the value of the specific heat capacity using the Differential Scanning Calorimetry (DSC) model Mettler
FIG. 1. Description of the model geometry.
Toledo DSC 1 with HSS7 sensor. From the DSC signals, the specific heat capacity of the Mg doped CuCrO2 powder is
calculated21 as a function of the temperature. The obtained specific heat capacity is 536 J kg−1K−1 at 100 °C. The heat
capacity of the fused silica (730 J kg−1K−1) is taken from the
literature.22
The emissivity of the samples (fused silica and CuCrO2:
Mg film on fused silica) is measured with an emissometer model AE1. This apparatus approximates total hemispherical emittance at 65 °C. Prior to the measurement, the calibration of the emissometer is done with a high emittance standard made of aluminum hard black anodized Teflon infused (ε = 0.87) and a low emittance standard with nickel-plated brass (ε = 0.06). Then the measurement gives 0.83 for the fused silica and 0.76 for the 300 nm thick CuCrO2:Mg film
on fused silica. The values of the emissivity are assumed constant when the temperature is increased. In order to check the influence of the substrate on the obtained emissivity value, the emissivity of several films with different thick-nesses (100, 300, 600 nm) was measured and showed the same value. Therefore, CuCrO2:Mg films are considered to
be opaque for the infrared photons emitted by the substrate. The density of fused silica and CuCrO2are taken,
respec-tively, from Refs. 22 and 23 (2.21 g.cm−3 and 5.49 g.cm−3)
and is supposed to be constant with the temperature. In the same way, the thermal conductivity of the substrate is obtained from Ref.24(1.38 W m−1K−1) at room temperature and does
not vary a lot till 250 °C. Concerning the thermal conductivity, CuCrO2 bulk is reported to have a value of 8 W m−1K−1 at
300 K.25In order to broaden the scope of the study, parameters such as the thermal conductivity, the thickness, and the emis-sivity of the film are varied in a wide range.
IV. RESULTS AND DISCUSSION
The temperatures at the surface of the film and at the surface of the substrate given by the simulation are used to cal-culate α. The coefficient α shows the relation between the tem-perature difference at the surface of the substrate without film [(Tsource− Tn)s] and the temperature difference at the surface
of the film deposited on the substrate [(Tsource− Tn)s+f] for a
given location. Figure3 shows a schematic representation of the film deposited on the substrate and describes the zones
where the temperature differences are taken by indicating an example with a measuring point 4. The definition of the coeffi-cient α allows us to know how the presence of the film on the substrate influences the heat transfer. To facilitate the represen-tation of the results, (1 − α) is taken instead of α. If the value (1 − α) is positive (0 < α < 1), the presence of the film boosts the heat transfer and increases the temperature at the surface of the film. If the value (1 − α) is negative (α > 1), the presence of the film decreases the temperature at the surface of the film. Finally, if the value (1 − α) is equal to 0 (α = 1), the presence of the film does not influence the tem-perature and is equal to the temtem-perature of the substrate (without film) at the given location.
α¼(Tsource# Tn)sþf (Tsource# Tn)s
: (5)
The factor of merit ZT of a material is calculated by using the below relation,
ZT¼σS 2
κ T, (6)
where σ is the electrical conductivity, S is the Seebeck coefficient, k is the thermal conductivity, and T is the temperature.
Regarding thermoelectric thin film, it is the thermal conductivity of the layer (k = kf) which is taken into
account for the calculation of ZT. However, in this case, the influence of the substrate is totally neglected. On the con-trary, some authors17 use the thermal conductivity of the substrate (ks) for the calculation of a modified ZT which
FIG. 3. Schematic representation of the film deposited on the substrate.
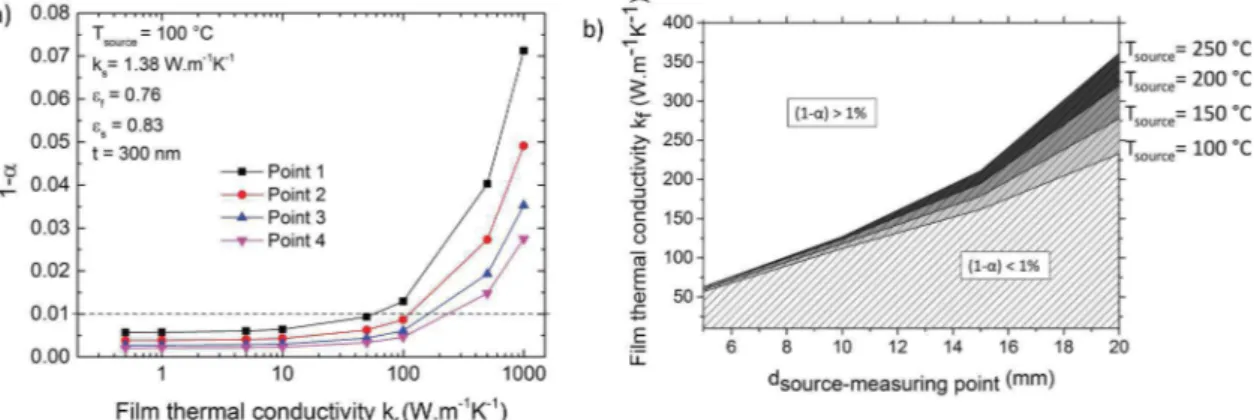
FIG. 4. (a) Evolution of (1 − α) as a function of the film thermal conductivity. (b) kflimit as a function of the distance between the source and the measuring
can be defined as Z0T ð Þ ¼σS 2 ks T: (7)
The aim of the present work is to study the influence of three parameters (the thermal conductivity, the thickness, and the emissivity of the film) on the validity limit of the modified figure of merit (Z’T) of the block (substrate + film). The con-dition for the determination of the limit is fixed at 1% of tem-perature variation due to the presence of the film at the surface compared to the temperature at the surface of the substrate without the film. In other words, this corresponds to (1 − α) < 0.01.
A. Influence of the thin film thermal conductivity Figure4(a)shows the evolution of (1 − α) as a function of the film thermal conductivity when other properties are fixed with the values exposed in Table I. The film thermal conductivity is varied from 0.5 to 1000 W m−1K−1. In this
range, the obtained values of (1 − α) are positives for the four different measuring points which indicates that the pres-ence of 300 nm film increases the temperature at the surface compared to the substrate only. This temperature increase is more and more important when the conductivity of the thin film increases. Obviously, it also depends on the measuring points. The variation of (1 − α) below 1.38 W m−1K−1,
which corresponds to the thermal conductivity of the sub-strate (fused silica), is not obvious. In fact, the predictable
trend is an evolution of (1 − α) under 0 when the film thermal conductivity is lower than the substrate thermal con-ductivity. The present variation of (1 − α) indicates that even if the main part of the heat transfer in solids is due to the heat conduction, the other type of heat transfers (convection and radiation) still occurs. As the heat convection is assumed the same in the case of the substrate only and the film depos-ited on the substrate, and as the geometry does not change, the emissivity is the second main part of the heat transfer, which must not be neglected.
The 1% increase of (1 − α) due to the presence of the film is given with the film thermal conductivity limit extracted from Fig.4(a). This film thermal conductivity limit is plotted as a function of the distance between the heat source and the measuring points for different heat source temperatures in Fig. 4(b). Below this limit (hatched area), the temperature at the surface of the film is assumed to be the same as the tem-perature at the surface of the substrate without film when the same heat temperature is applied at the edge. The results show that the film thermal conductivity limit increases with the dis-tance between source and measuring point and with increasing heat source temperature. It indicates that in general the longer the length of the thermoelectric leg, the higher the limit of the film thermal conductivity. It is also true for the high temperature source. Besides, CuCrO2 bulk is
reported to have a thermal conductivity of 8 W m−1K−1 at
300 K25 and 7 W m−1K−1 at 300 K26 in Mg doped CuCrO 2
bulk, and it is quasi constant with increasing temperature. In our case, the film thermal conductivity must be higher than 100 W m−1K−1 to have an effect on the temperature
differ-ence when the length of thermoelectric leg exceeds 10 mm.
B. Influence of the thin film thickness
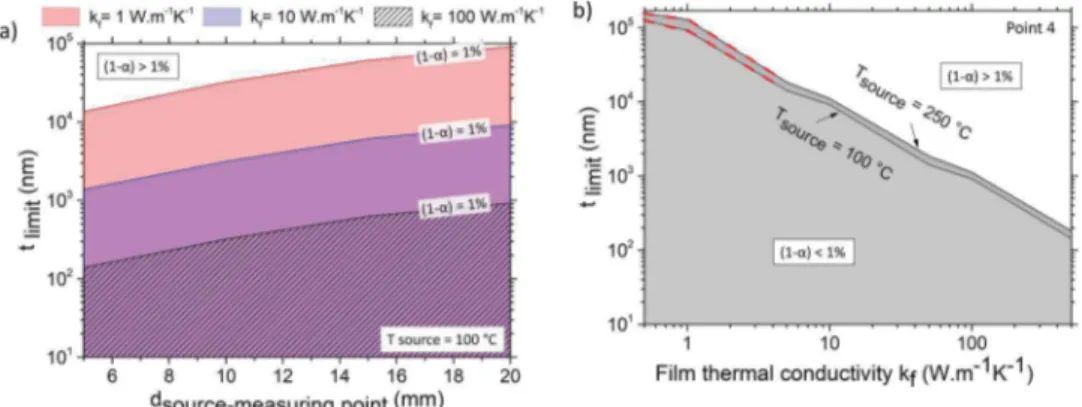
The thin film thickness is an important parameter that influences the heat transfer in solids. Figure 5(a) shows the film thickness limit as a function of the distance between the source and the measuring points for three films’ thermal con-ductivities. For a given film thermal conductivity, the thick-ness limit increases when the distance between the source and the measuring points increases. For instance, 100 nm thick film is in the domain where (1 − α) is under 1% even when the film thermal conductivity is 100 W m−1K−1.
Figure 5(b)shows the film thickness limit as a function of the film thermal conductivity for two different heat source
TABLE I. Properties of the CuCrO2and the fused silica used in the model.
Physical properties CuCrO2 Fused silica
Specific heat capacity (Cp) at 100 °C 536 J kg−1K−1 (determined on powder) 730 J kg−1K−1a Density (ρ) 5.49 g cm−3a 2.21 g cm−3a Thermal conductivity (k) at 300 K 8 W m−1K−1c(reported for bulk) 1.38 W m−1K−1d Emissivity (ε) 0.76 (measured on film) 0.83 (measured on 1 mm thick fused silica)
a Reference22. b Reference23. c Reference25. d Reference24.
FIG. 5. (a) The film thickness limit as a function of the distance between the source and the measuring points for three film thermal conductivities. (b) The film thickness limit as a function of the film thermal conductivity for two different heat source temperatures at point 4.
temperatures at point 4 (dsource-measuring point= 20 mm). The
tendency is similar for the whole measuring points ( points 1 to 3 not shown here). The thickness limit decreases when the film thermal conductivity increases. It reveals that the thinner a film is, the higher its thermal conductivity can be without significant consequences on the temperature gradient. The knowledge of the CuCrO2:Mg bulk thermal conductivity
(7 W m−1K−1 at 300 K26
) gives an approximate film thick-ness limit of 10 μm when the measuring point is taken at 20 mm from the heat source. Consequently, working with a few hundred nanometers thick film allows neglecting the thermal conductivity of the film and using the modified factor of merit (Z’T) with the thermal conductivity of the substrate. It also enables to use a high thermal conducting material without any influence on the temperature gradient.
C. Influence of the emissivity
It is necessary to know the impact of the film emissivity on the temperature gradient at the surface of the film. Emissivity reflects the ability of the material to lose heat by radiation. The emissivity taken by a material ranges from 0 to 1. Although the emissivity is an intrinsic property of a material, it can be increased by adjusting the geometry, resulting to an effective emissivity, which can be greater than 1 in the case of a very rough system. In the case of this simu-lation, the geometry is plane and does not take into account the roughness, so that the emissivity is limited to the value of 1. At a given measuring point, it is possible to define an emissivity range of the film (εf) within which the
tempera-ture difference between the deposited film (Tf + s) and the
single substrate (Ts) is less than 1%.
Figure 6(a) shows this emissivity range of the film (colored zone) as a function of the distance from the source for three different values of the substrate thermal conductiv-ity. The temperature source is fixed at 100 °C. The ranges are bordered by the emissivity limit values for which the temper-ature variation of the film relative to the single substrate is 1%. The values below the low limit of εfcorrespond to the
emissivities for which the temperature of the film will be greater than the substrate (Tf + s> Ts) with a difference more
than 1%. On the contrary, the values above the upper limit of εfcorrespond to the emissivities for which the film
tempera-ture will be lower than the substrate (Tf + s< Ts) with a
differ-ence more than 1%. In that case, the upper limit is only
visible for small distances, less than 10 mm from the source, and for films with low thermal conductivity. For longer dis-tances and higher thermal conductivities of the film, the high limit would correspond to values of εfgreater than 1, which
is outside the limit fixed in the previous paragraph. Even with high emissivity, it is not possible to obtain thin film temperature lower than the substrate alone if the film is ther-mally too conductive or if the measuring point is too far from the source. It can be seen in Fig.6(a)that whatever the thermal conductivity, the emissivity range allowed to have less than 1% temperature differences widens with the dis-tance from the source. From these results, it can be con-cluded that (Z’T) can be used for 300 nm thick CuCrO2:Mg
thin films which have an emissivity and a bulk thermal con-ductivity of 0.76 and 7 W m−1K−1, respectively.
In Fig.6(b), it is observed that when the thermal conduc-tivity of the film increases, the emissivity limit shifts to higher values but it is limited by the threshold value of 1 (as a result, the range of allowed emissivity values is reduced). Figure6(b)
also shows that the allowed emissivity range increases with increasing temperature of the source. Thus, when the tempera-ture of the source is high, it is possible to use a less emissive film without affecting the temperature gradient.
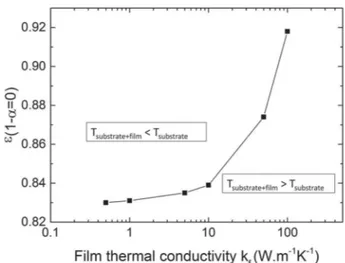
Figure 7 represents the evolution of the emissivity needed in order to have no difference in temperature between the deposited film and the substrate without film (1 − α = 0).
FIG. 6. (a) The emissivity limit as a function of the distance between the source and the measuring points for three film thermal conductivities. (b) The emissivity limit as a function of the film thermal conductivity for two different heat source temperatures at point 4.
FIG. 7. The emissivity for (1 − α = 0) as a function of the film thermal conductivity.
Our simulations have shown that this emissivity value is independent of the distance from the source and the tempera-ture of the source. Figure7shows that when the thermal con-ductivity of the film increases, it is necessary to increase its emissivity as well.
In conclusion, we note that just like the thermal conduc-tivity and the thickness of the film, emissivity plays an important role in the case of thin films thermal gradient. However, it is rarely taken into account for thermoelectric applications. In fact, when it is high, it allows obtaining higher temperature gradients that is beneficial for thermoelec-tric applications.
D. Experimental results
The simulation results have shown that the modified ZT can be used in the case of the CuCrO2:Mg thin films. In
Fig.8, (Z’T) of 100 nm thick CuCrO2:Mg films is plotted as a
function of the temperature compared with the data from the literature. The values of the modified ZT are calculated using the measured Seebeck coefficient and the electrical conductiv-ity as a function of the temperature (from 40 to 210 °C) pub-lished in our previous work13and the temperature dependent thermal conductivity of the fused silica published by Combis et al.24 Thanks to the thermal properties of the CuCrO2:Mg
film, (Z’T) attained 2 × 10⁻² at 210 °C, whereas CuCrO 2:Mg
bulk studied by Hayashi et al.26 reached only 0.008 at the equivalent temperature. Pérez-Rivero et al.17 published a Z’T of 7 × 10⁻³at 180 °C in the case Ca
3Co4O9epitaxial thin film
on yttria stabilized zirconia crystalline substrate. In compari-son, the value of (Z’T) of delafossite thin film is higher due to a higher Seebeck coefficient of CuCrO2:Mg and a lower
thermal conductivity of the fused silica substrate. This result shows clearly the advantage of working with CuCrO2:Mg film
compared to the bulk in terms of ZT.
Due to the interesting thermoelectric performance of the 100 nm thick CuCrO2:Mg film, we decided to elaborate a
ther-moelectric module made with three legs of CuCrO2:Mg film.
The legs were connected with a gold layer. In order to charac-terize this module, one side of the module was heated and the other side was left untouched under air as shown in the inset of Fig. 9(a). The applied temperature at the hot side and the measured temperature at the cold side of the module were plotted in Fig.9(a). The cold side temperature was measured using an infrared camera and carbon spots with an emissivity of 1 were used for the temperature determination. The slight variation of the temperature at the cold side from 22 °C to 46 ° C when the hot side temperature was increased from 25 °C to 220 °C indicated once again a low thermal conductivity of the CuCrO2:Mg film and gave a high temperature gradient, benefit
for thermoelectric applications. Figure 9(b) shows the maximum electrical power generated by the three legs thermo-electric module when the hot side temperature is increased. It reached 10.6 nW when 220 °C is applied at the hot side. Saini et al.27 have also elaborated a thermoelectric module with oxides films (Ca3Co4O9 as p type and ZnO:Al as n type)
deposited on fused silica and reported 0.34 pW when 300 °C is applied at the hot side. Compared to the literature, the present study showed an encouraging result for practical appli-cations at high temperature.
V. CONCLUSIONS
In this article, the influence of the thermal conductivity, the thickness, and the emissivity on the heat transport of CuCrO2:Mg film deposited on fused silica is studied using
simulations. The results gave limit values from which the temperature increase due to the film is lower than 1% com-pared to the substrate only. For the thin films, which have the thermal conductivity, the thickness, and the emissivity value under the limit, the modified ZT can be used to determine the thermoelectric performance of the thin film. The simula-tion results also allowed revealing the importance of taking into account the emissivity in the ZT calculation which is rarely studied. In fact, by increasing the film emissivity
FIG. 8. The modified ZT of 100 nm thick CuCrO2:Mg film as a function of
the temperature compared with the data from the literature.
FIG. 9. (a) Applied temperature at the hot side and measured temperature at the cold side as a function of the heating step. Inset: Schematic represen-tation of the setup. (b) The maximum power as a function of the hot side temperature. Inset: Photo of the unileg module.
value, the stack (substrate and film) can be cooled down which is beneficial for thermoelectric properties of the mate-rial. Mg doped CuCrO2 film is situated in the valid zone to
use of the modified ZT. The calculated value of (Z’T) reached 0.02 at 210 °C which encouraged the elaboration of the ther-moelectric module based on this material. The characterization of the module revealed a maximum power of 10.6 nW when 220 °C is applied at the hot side and the cold side is left untouched. This study showed interesting thermoelectric per-formances to a potential application of CuCrO2:Mg films as a
thermoelectric material at high temperature.
1J. Ma and H. H. Hng,J. Mater. Sci. Mater. Electron.13, 461 (2002). 2
P. Procter and J. Solc, in 1991 Proceedings of the 41st Electronic Components & Technology Conference(IEEE, 1991), pp. 835–842.
3L. Shi, C. Yu, and J. Zhou,J. Phys. Chem. B109, 22102 (2005). 4P. G. Klemens and M. Gell,Mater. Sci. Eng. A245, 143 (1998). 5
A. J. Slifka, B. J. Filla, J. M. Phelps, G. Bancke, and C. C. Berndt,
J. Therm. Spray Technol.7, 43 (1998).
6L. L. Baranowski, G. Jeffrey Snyder, and E. S. Toberer,J. Appl. Phys.
113, 204904 (2013).
7
S. H. Aref and J. Yekta,Opt. Fiber Technol.20, 374 (2014).
8
W. Buck and S. Rudtsch, in Springer Handbook of Metrology and Testing (Springer Berlin Heidelberg, 2011), pp. 453–483.
9D. G. Cahill,Rev. Sci. Instrum.61, 802 (1990). 10
V. Moraes, H. Riedl, R. Rachbauer, S. Kolozsvari, M. Ikeda, L. Prochaska, S. Paschen, and P. H. Mayrhofer,J. Appl. Phys.119 (2016).
11C. Dames,Annu. Rev. Heat Transf.
16, 7–49 (2013).
12
I. Sinnarasa, Y. Thimont, L. Presmanes, A. Barnabé, and P. Tailhades,
Nanomater.7, 157 (2017).
13I. Sinnarasa, Y. Thimont, L. Presmanes, A. Barnabé, C. Bonningue, and
P. Tailhades,Appl. Surf. Sci.455, 244 (2018).
14
D. G. Cahill, H. E. Fischer, T. Klitsner, E. T. Swartz, and R. O. Pohl,
J. Vac. Sci. Technol. A7, 1259 (1989).
15T. B. Limbu, K. R. Hahn, F. Mendoza, S. Sahoo, J. J. Razink, R. S.
Katiyar, B. R. Weiner, and G. Morell,Carbon117, 367 (2017).
16
J. Alvarez-Quintana,Appl. Therm. Eng.84, 206 (2015).
17
A. Pérez-Rivero, M. Cabero, M. Varela, R. Ramírez-Jiménez, F. J. Mompean, J. Santamaría, J. L. Martínez, and C. Prieto,J. Alloys Compd.
710, 151 (2017).
18
J. W. Gooch, Encyclopedic Dictionary of Polymers (Springer New York, New York, 2011), pp. 323–323.
19M. Kaviany, Principles of Convective Heat Transfer (Springer, 2001). 20T. L. Bergman and F. P. Incropera, Fundamentals of Heat and Mass
Transfer(Wiley, 2011).
21
M. J. O’neili,Anal. Chem.38, 1331 (1966).
22A. G. Romashin and Yu. E. Pivinskii,Refractories
9, 590–595 (1968).
23C. Palache, H. Berman, and C. Frondel, The System of Mineralogy of
James Dwight Dana (American Association for the Advancement of Science, 1963).
24P. Combis, P. Cormont, L. Gallais, D. Hebert, L. Robin, and J.-L. Rullier,
Appl. Phys. Lett.101, 211908 (2012).
25
C. Ruttanapun and S. Maensiri, J. Phys. D. Appl. Phys. 48, 495103 (2015).
26K. Hayashi, K. I. Sato, K. Nozaki, and T. Kajitani,Jpn. J. Appl. Phys.57,
59 (2008).
27
T. A. Saini, P. Mele, and K. Miyazaki,Energy Convers. Manag.114, 251 (2016).