Publisher’s version / Version de l'éditeur:
42nd International Congress and Exposition on Noise Control Engineering:
Inter-Noise 2013, 2013-09-18
READ THESE TERMS AND CONDITIONS CAREFULLY BEFORE USING THIS WEBSITE.
https://nrc-publications.canada.ca/eng/copyright
Vous avez des questions? Nous pouvons vous aider. Pour communiquer directement avec un auteur, consultez la première page de la revue dans laquelle son article a été publié afin de trouver ses coordonnées. Si vous n’arrivez pas à les repérer, communiquez avec nous à PublicationsArchive-ArchivesPublications@nrc-cnrc.gc.ca.
Questions? Contact the NRC Publications Archive team at
PublicationsArchive-ArchivesPublications@nrc-cnrc.gc.ca. If you wish to email the authors directly, please see the first page of the publication for their contact information.
NRC Publications Archive
Archives des publications du CNRC
This publication could be one of several versions: author’s original, accepted manuscript or the publisher’s version. / La version de cette publication peut être l’une des suivantes : la version prépublication de l’auteur, la version acceptée du manuscrit ou la version de l’éditeur.
Access and use of this website and the material on it are subject to the Terms and Conditions set forth at
Sound insulation performance of cross laminated timber building
systems
Schoenwald, Stefan; Zeitler, Berndt; Sabourin, Ivan; King, Frances
https://publications-cnrc.canada.ca/fra/droits
L’accès à ce site Web et l’utilisation de son contenu sont assujettis aux conditions présentées dans le site LISEZ CES CONDITIONS ATTENTIVEMENT AVANT D’UTILISER CE SITE WEB.
NRC Publications Record / Notice d'Archives des publications de CNRC:
https://nrc-publications.canada.ca/eng/view/object/?id=4ae707b4-6075-4376-bb30-9b42a039fa91 https://publications-cnrc.canada.ca/fra/voir/objet/?id=4ae707b4-6075-4376-bb30-9b42a039fa91
Sound insulation performance of Cross Laminated Timber Building
Systems
Stefan Schoenwald1’2, Berndt Zeitler1, Ivan Sabourin1, and Frances King1
1
National Research Council - Construction 1200 Montreal Road, Ottawa K1M 2C1, Canada
2
Currently at EMPA – Acoustics/Noise Control, Ueberlandstrasse 129, 8600 Dübendorf, Switzerland ABSTRACT
In recent years Cross Laminated Timber (CLT) was introduced as an emerging building system in the North American market. CLT elements consist of multiple layers of wooden beams that are laid-out cross-wise and laminated together to form solid wood panels for floors and walls. As part of a multi-disciplinary research project a comprehensive study was conducted on the impact and airborne sound insulation of this type of elements in order to create a data base that allows building designers to predict the acoustic performance of CLT systems. Parametric studies were carried out on the direct impact airborne sound insulation of CLT floor assemblies (with/ without various floor topping and gypsum board ceiling variants), on the direct airborne sound insulation of CLT walls (with/without gypsum board linings), as well as on the structure-borne sound transmission on a series of CLT building junctions. The results were then used as input data for predictions of the apparent impact and airborne sound insulation in real CLT buildings using the ISO 15712 (EN12354) framework that was originally developed for concrete and masonry buildings. The paper presents the prediction approach as well as results of prediction and measurement series for apparent impact and airborne sound insulation.
Keywords: Building Acoustics, Sound Insulation, Impact Sound, Prediction
1. INTRODUCTION
Cross Laminated Timber (CLT) elements are a building system that is already widely used in Europe. The elements consist of an odd number of layers of wooden battens (lamellas) that are laid-out cross wise and glued together to form solid wood panels for floors and walls. CLTs recently emerged in the North American Market as a new wood construction technology for multi-storey wooden buildings. Properties and design details of Canadian CLT structures were assessed in a multidisciplinary project that included besides sound insulation also structural, fire safety and heat-and-moisture transfer aspects.
The sound insulation test series were structured as parametric studies on the direct airborne and impact sound insulation of walls and floors (with and without gypsum board linings and floor toppings) and as well as on flanking airborne and impact sound insulation. The framework of ISO 15712 “Building Acoustics – Estimation of acoustic performance of buildings from the
1
berndt.zeitler@nrc-cnrc.ca
2
performance of elements”, or better known as EN 12354 in Europe, was utilized with measured input data to estimate flanking sound insulation. The prediction method was chosen because CLT elements are fairly similar to concrete and masonry elements regarding homogeneity for which the prediction models were originally developed. The greatest difference to concrete and masonry structures are the greater damping of the CLTs and their junction details with rather point than line connections. Both issues will be addressed in the following. Nonetheless, the ISO 15712 prediction method was already successfully applied for CLT buildings in earlier studies in Europe (e.g. [Schramm/Rabold DAGA], [Dolezal], [Homb prague] and [Geyer prague]). Further, special care has to be taken when the methods are applied in a North American context as most required input data is measured according to ASTM standards and ISO 15712 is written using ISO units.
2. ISO 15712 Prediction Method
ISO 15712-1 is a prediction method to estimate the apparent airborne sound transmission in a building, which is the energy sum of direct transmission through the partition and up to 3 flanking paths at each junction as is perceived by the building occupants. ISO 15712-2 gives a corresponding model for apparent impact sound insulation. Both models are closely related, use essentially the same calculation procedure as well as input data. This is revealed by a comparison of Equation 1 for airborne and Equation 2 for impact for the detailed calculation of flanking sound transmission between element i and element j.
j i s situ ij v situ j situ i situ j situ i ij
S
S
S
D
R
R
R
R
R
10
lg
2
, , , , , ,+
+
D
+
D
+
+
=
(1) j i situ ij v situ j situ j situ i situ i situ i n ij nS
S
D
R
R
R
L
L
L
10
lg
2
, , , , , , , , ,−
D
−
−
−
+
D
−
=
(2)Rare the sound reduction indices (Transmission Loss TL according to ASTM E 90) for flanking (Rij) and direct resonant transmission Ri, Rj through the bare elements, DR are the incremental change of transmission loss due to additional layers like gypsum board wall liners, gypsum board ceilings or floor toppings. The direction averaged velocity level difference Dv,ij describes the structural power flow across the junction and the last term describes the geometry with the area S of separating element s and flanking elements i and j. Index situ indicates that the values are already adjusted from data measured in the laboratory to the field situation that is predicted, which can be a rather tedious process as is shown when discussed later. Equation 2 for the Normalized Flanking Impact Sound Pressure Level Ln,ij further requires as input data the direct Ln,i (NISPL according to ASTM E 492) of the bare source element i and its incremental change DLi due to an added floor topping.
Even though there are some peculiarities in the measurement of the ASTM quantities the calculation procedure of ISO 15712 is also valid if this data is used as input data where possible. Only Dv,ij has no equivalent in ASTM standards and either has to be measured according to ISO 10848 or can be estimated for some restricted junctions according to the equations given in ISO 15712, Appendix E. With this input data Equation 1 and 2 have to be evaluated for all relevant paths and at all frequency bands that are necessary for determination of the Apparent Sound Transmission Class (ASTC) according to ASTM E413 and of the Apparent Impact Insulation Class (IIC) according to ASTM E989.
2.1 Input Data for Element Performance
The ISO 15712 requires that data of airborne and impact sound insulation performance of the elements (R and Ln) used as input data for the prediction of flanking sound insulation is transferred from the lab to the considered building situation and ideally it should be for resonant transmission only. For airborne excitation, non-resonant transmission, below the coincidence frequency becomes significant. This transmission component is a forced displacement of the wall by the sound waves that does not induce any vibrational energy in the elements and hence is not proportional to the damping of the elements. Only resonant vibrational energy can be transmitted structurally between elements at the junction. The current ISO 15712-1 does not give a practical correction method that
allows correction for non-resonant transmission. In most cases in concrete masonry construction the coincidence frequency is very low and therefore the error due to neglecting this correction is small and on the conservative side. For the tested, thin CLT panels, the coincidence frequency is much higher (for 78 mm 3-ply panels around 800 Hz) and therefore a new correction method was applied that requires the measurement of the sound radiation efficiency of the elements sair for airborne and sstruc for structure-borne excitation.
air struc n,lab lab res n
R
R
s
s
lg
10
, ,=
+
(3)Further the resonant energy in the elements is proportional to the damping of the elements and therefore the lab data for impact and airborne sound transmission has to be adjusted further to account for the different edge losses in the lab and building situation as shown in equation 4.
lab n situ n lab res n situ res n
T
T
R
R
, , , , , ,=
−
10
lg
(4)The damping of the element is described by their structural reverberation of the elements which can be easily measured in the lab, and must be predicted for the field situation. For cases where the total damping of the elements in the building situation is dominated by transmission losses to adjacent elements – i.e. elements with low internal loss factor and weak junction attenuation to other elements – the structural reverberation time Ts of the elements can be estimated for the considered building situation according to Annex C of ISO 15712-1. This procedure is lengthy and complicated since in order to obtain an accurate estimate the structure-borne losses at all four junctions of all relevant elements – at the flanking elements also those at the three junctions that are not at the separating element – have to be taken into account, and the vibration reduction indices have to be known. For elements with small edge losses or when the internal loss factor is governing the total damping – i.e. internal loss factor is >0.03 – the standard assumes that the effect of structural losses is the equal for building lab situations and no correction is necessary.
The performance of the bare CLT elements as well as with additional layers was measured in this study in NRC Construction’s Wall and Floor Sound Transmission Facilities. In both facilities floor and wall test specimens were installed in movable frames between two isolated chambers of the transmission suite. The size of the wall specimens was 3.60 m width by 2.40 m height and of the floors 4.70 m by 3.78 m. The sizes of the chambers of the wall facility is 250 m3 and 140 m3 and in the floor facility app. 250 m3 for both chambers. Both facilities are equipped with a computer controlled sound and data acquisition system that moves the microphones to the same nine measurement positions in each room. For the impact measurements the ISO-tapping machine is used at the four excitation positions defined in the ASTM E492.
Besides the standardized measurements according to the ASTM-protocols also the structural reverberation times were measured according to ISO 10848. Hereby the elements were excited with an electro dynamic shaker driven by a sine sweep signal at four positions and the responses were measured with four accelerometers at four different sets of positions. Deconvolution techniques and backward integration were applied to obtain impulse responses, energy decay curves and reverberation times.
The radiation efficiencies were measured in both facilities, too. The sound pressure levels and reverberation times in the rooms were measured with the automated measurement system. The velocity levels of the elements were measured in the floor facility with accelerometers and in the wall facility with a scanning laser Doppler vibrometer. For airborne excitation the specimens were exposed to white noise from the installed sound system. For structure-borne excitation of the walls an electro-dynamic shaker driven with white noise and for floors an ISO-tapping machine was used. 2.2 Input Data for Junction Transmission
The structural power transmission between the coupled elements i and j is given by Dv,ij which depends on the geometry (junction length lij and area of elements S) as well as on the structural reverberation time Ts of the elements in the considered building situation. Dv,ij is derived from the situation independent vibration reduction index kij according to equation 5.
situ j situ i ij ij situ ij v
a
a
l
k
D
, , , ,=
−
10
lg
(5)Hz
f
with
f
f
T
c
S
a
ref ref situ n s n situ n,
1000
2
.
2
, , 0 2 ,=
=
π
(6)The velocity level difference depends on junction length and geometry as well as damping of coupled elements that is described by the equivalent absorption length defined in Equation 6. The structural reverberation time Ts,n,situ in Equation 6 has to be estimated as outlined in Section 2.1. For elements with internal loss factor >0.03 and small edges it is also assumed that the difference between the lab and field situations is small and the equivalent absorption length of the elements is set numerically equal to their area.
For line-connected monolithic building elements in concrete and masonry construction, estimates of kij are given in the Annex E of ISO 15712-1 depending on the masses of the coupled elements. In CLT construction adjoining elements are connected with nailed metal plates or long wood screws at a spacing specified by structural engineers for the specific axial and lateral loads. These connections cannot acoustically be considered as line-connections and therefore the kij-data presented in this paper was measured at junction mock-ups according to ISO 10848. Hereby wall-wall and floor-wall junctions were assembled in a lab environment and kij were determined from measure velocity level differences analogously to equation 3 and equation 4. In this paper only data for a floor-wall cross junction, as shown in Figure 1, are discussed.
Figure 1 – Set-up for measuring the junction vibration reduction index kij at CLT floor-wall junctions The 175 mm 5-ply CLT floor slab (total length 8.60 m) is continuous across the walls that are located at app. 0.50 m of centre and the outer lamellas are oriented perpendicular to the walls. The upper and lower wall size (3.60 m wide by 2,40 m high) are both 78 mm thick 3-ply walls. The floor slab was supported by the lower wall in the middle and at its free edges with shores. Soft rubber pads were placed between the CLT floor and the shores as vibration isolators. The lower wall was standing on a massive rigid concrete floor only supported by its connections to the CLT floor at its upper edges. The top wall is connected at the bottom to the CLT floor and a steel frame spans over its top to apply with hydraulic jacks an axial load to the upper wall. This is done with a force that simulates the weight of additional upper stories. Loading was found to have an effect on flanking sound transmission in wood frame construction, however, the effect is limited as the initial loading of the first storey causes the greatest difference and further loading does not change the acoustical propagation properties.
The size of the elements was according to ISO 10848-4 and the indirect measurement method was utilized. All four coupled elements were instrumented with 4 accelerometers and the velocity response was measured on all 16 –channels simultaneously when one of the elements was excited
during the 30s time interval with multiple hammer blows applied in a predefined excitation areas of app. 1 m2. On each element four different excitation areas and four sets of receiver points were used - in total the velocity was averaged over 16 measurement points on each element. The structural reverberation times of the elements were measured at the same points; however, an electro-dynamic shaker driven by a sine-sweep signal was used for excitation. The impulse responses and the energy decay curves were determined with de-convolution methods and backward integration respectively. The reverberation time of elements in this lab-situation was determined for the first steep slope in the decay curves using a graphical user interface. Measured Dv,ij,lab was normalized to kij using equation 3 and 4 and the full data set – geometry and measured structural reverberation times – and for comparison only the geometry by setting the equivalent absorption length numerical equal to the area of the elements.
3. Test Results
3.1 Sound Insulation of CLT Elements
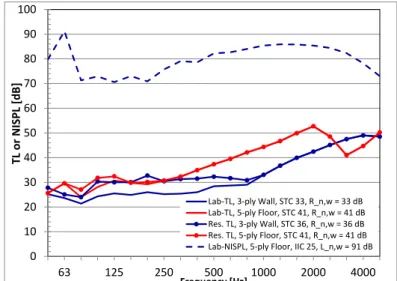
The measured Transmission Loss for the 78 mm 3-ply wall and the 175 mm 5-ply floor are presented in Figure 2 for the bare measurement as well as corrected below coincidence frequency to remove the non-resonant transmission component. The TL of the 5-ply CLT floor (STC 41) is higher than for the 3-ply CLT wall (STC 33) due to the greater mass. The distinct dip in TL of the 5-ply floor around 3150 Hz is due to thickness resonances and is shifted for the thinner 3-ply CLT to higher frequencies that are not presented in this graph. The corrected resonant TL of the 5-ply floor is only marginally greater than the lab data in the frequency range plotted as only few frequency bands below the coincidence frequency at 200 Hz, where the forced excitation is significant, are presented. The coincidence frequency of the 3-ply CLT is much higher (around 800 Hz) and hence the correction has a much greater effect and corrected TL values are a maximum of 6 dB greater. This is also reflected in the STC-rating that increases 3 points for the 3-ply CLT, whereas it does not change for the 5-ply CLT. Further the Normalized Impact Sound Pressure Level (NISPL) is shown in Figure 3 for the 5-ply floor without surface treatments, like toppings or hung ceilings, and thus it achieves only IIC 25 or Ln,w = 91 dB.
Figure 2 – Sound Transmission Loss of 3-ply CLT wall and 5-ply CLT floor – lab TL, TL corrected for non-resonant component, and NISPL
3.2 Element Damping
The internal loss factor of the elements were measured in order to determine if the if only the geometry or both geometry and loss factor have to be taken into account when lab data is transferred to the field situation. Several CLT panels were hung up from a crane and the reverberation times were measured. It is assumed that losses through the suspensions can be neglected as well as radiation losses. The results for the measured loss factors of the hung elements are presented in Figure 3 together with the radiation loss factors that were predicted from the measured radiation efficiencies.
0 10 20 30 40 50 60 70 80 90 100 63 125 250 500 1000 2000 4000 T L o r N IS P L [d B ] Frequency [Hz]
Lab-TL, 3-ply Wall, STC 33, R_n,w = 33 dB Lab-TL, 5-ply Floor, STC 41, R_n,w = 41 dB Res. TL, 3-ply Wall, STC 36, R_n,w = 36 dB Res. TL, 5-ply Floor, STC 41, R_n,w = 41 dB Lab-NISPL, 5-ply Floor, IIC 25, L_n,w = 91 dB
The radiation loss factors are by more than one order smaller in most of the frequency range, which strengthens the assumption that the measured loss factors were mainly due to internal losses. The internal loss factor of both CLT panels is about 0.05 in most of the low and mid-frequency range that is important for flanking sound transmission. Only in the high frequency range above 2000 Hz it is less and about 0.02. Therefore according to ISO 15712-1 it is suggested to neglect the loss factor when transferring input data from the lab to the fielding situation.
Figure 3 – Measured internal loss factors and predicted radiation loss factors of CLT panels 3.3 Vibration Reduction Index
All possible transmission paths across the X-junction are shown in Figure 4 for airborne excitation and on first glance it seems that there are many paths. However, a detailed inspection reveals that there are only a maximum of 2 unique Ff-path kijs (k12, and k24) and 4 unique Df- or Fd-path kijs (k12, k23, k34, and k14) possible. For example, k12 is for the Fd-path between room “A” and “B”, but it is also the 24-path between room “A” and room “C”. The number of unique kijs reduces further if e.g. element 1 and 3 as well as 2 and 4 are the same, including the connection details. In this case there is only one unique kij for all Df- and Fd- paths. On the other hand, if for instance different connection methods are applied to connect element 2 and element 4 (e.g. element 2 connected with angle brackets and element 4 with screws) then two data sets are presented, one for path 1-2 and path 2-3 and another for path 1-4 and path 3-4. For impact sound insulation the number of possible paths is smaller as only floors can be excited and k24 is not relevant.
Figure 4: Possible sound transmission paths for X-junctions; left: kFf; middle: kFd and kDf for horizontal paths; right: kFd and kDf for vertical paths
For the floor-wall junction of the 5-ply floor and 3-ply walls three different connection types were investigated. First, the walls were connected with 90 mm steel angle brackets that were screwed to the upper and lower wall at 300 mm spacing. Second, the lower wall was connected with 300 mm long self-tapping screws and the upper wall was connected with angle brackets. Third, so-called
0.00 0.02 0.04 0.06 0.08 0.10 0.12 0.14 0.16 0.18 0.20 63 125 250 500 1000 2000 4000 Lo ss F a ct o r [ -] Frequency [Hz] Limit ISO 15712
Radiation Loss Factor 5-ply CLT Internal Loss Factor 5-ply CLT Radiation Loss Factor 3-ply CLT Internal Loss Factor 3-ply CLT
hold-downs were installed at each end of the wall. They connect the upper and lower wall with threaded steel rods that were inserted through holes in the floor slab and only connected to the walls.
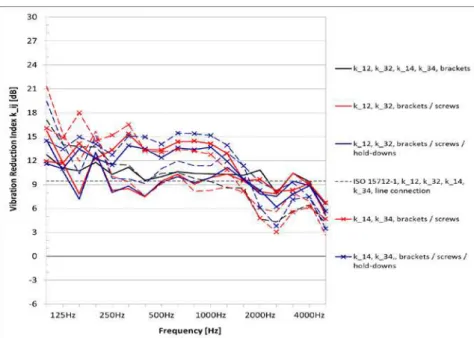
In Figure 5 measured k13 and k24 are presented for all connection methods as well as different normalization methods and compared to the empirical values for line connections of ISO 15712-1, Annex E. k13 for transmission in the continuous floor slab are equal for all connection types. At low frequencies they agree well with the estimates for line connections. At higher frequencies k13 decreases and some values are shown as they were below the limit for strong coupling. This indicates that the connectors act as line connections in the low frequency range and at higher frequencies they become a series of point connections that does not affect transmission of structural power in the continuous CLT slab very much. The geometry and loss factor normalized data has a slightly bigger spread at high frequencies than the only geometry normalized data. At low frequencies this data tends to be greater than the geometry normalized data, whereas at low frequencies they are smaller. k24 for transmission between the discontinuous walls exceeds the estimates for the line connection, as coupling by the connectors is weaker. Also the junction attenuation changes with connection methods, i.e. the smallest coupling is when the lower wall is connected with screws and the upper wall is connected with angle brackets. k24 with only angle brackets is about 2-3 dB smaller in the whole frequency range, so acoustically screws couple less than brackets. When hold-downs were installed k24 decreases by more than 10 dB in most of the frequency range. Also for k24 the loss factor normalized data tends to be higher at low frequencies and smaller at high frequencies than the geometry normalized data.
Figure 5: Vibration Reduction Indices kFf for floor-wall junction with different connection methods – solid lines: geometry normalized kFf, dashed lines: loss factor and geometry normalized kFf
In Figure 6 measured kij between the floor slab and the upper and lower walls are presented for the two normalization methods and different connections as well as the estimates for a line connection according to ISO 15712-1, Annex E. For the case with brackets connecting the upper and lower wall only one kij data set is shown as the coupling between both walls and the floor slab were equal. Only two sets are shown, for the cases with screws connecting the lower wall and angle brackets the upper wall, as transmission to the upper wall was similar to the first case and to the lower wall with screws was about 5-6 dB less in the mid-frequency range. Thus, again it is demonstrated that coupling due to the screws was less than due to the brackets. If the hold-downs are added, kij’s for coupling between the walls and floor do not change significantly and therefore do not affect junction attenuation for these paths. This gives additional evidence that the hold-downs introduce only an additional flanking path between the two walls by-bypassing the floor. The difference between the geometry normalized data and the loss factor normalized data is similar to Figure 5. Further, the general trend shown in Figure 6 is that at low frequencies kij are slightly greater than the estimates for line connections according to ISO 15712-1 and at high frequencies they are smaller. This again demonstrates that at low frequencies the panel connections are more similar to line connections than at high frequencies
were the connectors act as a series as point connections.
Figure 6: Vibration Reduction Indices kDf or kFd for floor-wall junction with different connection methods – solid lines: geometry normalized kDf or kFd, dashed lines: loss factor and geometry normalized kDf or kFd
4. Prediction of Flanking Transmission
As the next step the airborne and impact flanking sound insulation across the floor-wall junction were predicted with the ISO15712 prediction model using the input data presented above. A situation with two rooms side-by-side that are separated by a 5.00 m wide and 2.50 m high 3-ply CLT wall is considered. The 5-ply CLT floor slab in the source and receive rooms are both 4.00 m long and the elements are continuous across the junction. The considered floor-wall junction is the same as tested and described in Section 3 with angle brackets used as connectors. The flanking sound insulation was predicted using both approaches of ISO 15712 described in Section 2. The first considers only the geometry for transfer of input data from the lab to the field situation as suggested for internal loss factors >0.03, and the second considers both geometry and loss factor. Since it was shown in Section 2.2 that the internal loss factors of CLT are well above this limit in most of the frequency range both methods should give the similar results. The disadvantage of the second prediction approach of the total loss factor also is that the connection details at all other junctions of the flanking elements have to be known. Here it is considered that all floor wall junctions are X-junctions with 3-ply walls and continuous CLT floor slabs. For the separating CLT wall the same junction details are assumed at the top as at the bottom, the sidewalls are further continuous 3-ply CLT walls where the separating wall butts against to form a T-junction and is connected with angle brackets spaced 0.60 m. The input data for the wall-wall junctions was measured using the methods as described above. The element sound transmission loss data was corrected to remove the non-resonant transmission component for both approaches.
The prediction results are presented in Figure 7 in the graph on the left for airborne sound transmission and on the right for impact sound transmission. For both excitation types the sound insulation along the floor-floor path is about 10 dB less than for the floor-wall for the geometry normalized approach in the whole frequency range. This is due to the strong transmission across the junction in the continuous CLT slab. The floor-floor path achieves a single number rating of Flanking STC 48 or RFf,w = 48 dB for airborne and Flanking IIC 29 and Ln,Ff,w = 81 dB. Note that IIC-ratings are analogously to airborne ratings where lower values represent worse performance than higher values, whereas it is vice-versa for Ln,Ff,w. The floor-wall path achieves 7 point higher ratings for airborne and 8 point higher values for impact.
The loss factor and geometry normalized prediction results show a slightly different behavior for the two paths. For the floor-wall path similar results were obtained with both normalization approaches, the difference is maximum 3 dB for some mid-frequency bands for airborne as well as impact sound insulation. The airborne single number ratings are 1 point higher and the impact ratings
are 3 points than for the geometry normalization case. For the floor-floor path the loss factor and geometry normalized approach achieves 10 dB higher values at high frequencies about than for the geometry normalized approach. This is reflected also in the single number ratings for impact sound insulation that are 7 points higher because the rating is driven in the mid- and high frequency range. For airborne sound insulation the single number ratings of both approaches differ only by 2 points, because the ratings are driven by the sound transmission loss in the low frequency range.
Figure 7: Rooms side-by-side case, Flanking sound insulation across the CLT floor-wall junction predicted with ISO 15712 prediction model (solid lines: geometry adjusted, dashed lines: loss factor and geometry
adjusted), left: airborne sound insulation, right: impact sound insulation
Figure 8: Total Loss Factor – Measured for Specimen in Sound Transmission Facility and predicted for field situation according to ISO 15712-1
The cause for the different trend in the two approaches is due to the total loss factors of the elements that are presented in Figure 8. The total loss Factor of the wall in the lab during measurement of TL is equal to the one predicted in the field situation, whereas for the floor slab the predicted data is much higher in the mid- and high frequency range. This is due to the high structural losses at the floor junctions due to the continuous slab. The edge losses are much smaller for the separating 3-ply wall as the elements are butted against continuous flanking elements and the losses through the connectors are much smaller. The effect is greater for the floor-floor path than for the floor-wall path because the difference in the loss factors is included for both coupled elements as well as twice in the prediction of the junction coupling.
Prediction results as well as total loss factors clearly indicate that even if the condition for an internal loss factor of 0.03 or greater is fulfilled the prediction using only the area normalization might under estimate the flanking sound transmission for cases with strong edge losses, like for the continuous CLT floor-slab.
5. Summary and Conclusions
In this paper the prediction methods of ISO 15712 are outlined and applied for Cross Laminated Timber (CLT) construction in North America. Since the ISO 151712 is using ISO terms and in North America ASTM-Standards are used for testing of building elements where possible these quantities were used as input data. Further, methods were outlined that were applied to transfer the measured input data of the element performance (Sound Transmission Loss (TL) and Normalized Impact Sound Pressure Level (NISPL)) from the lab situation to the field situation that is predicted. The non-resonant transmission component of the TL was removed utilizing the radiation efficiencies for airborne and structure-borne excitation. It was shown that this correction is only significant for elements with a coincidence frequency in the mid or high frequency range, like 3-ply CLT panels with a coincidence frequency of 800 Hz. For the 5-ply CLT panels with a coincidence frequency of about 200 Hz the correction for the non-resonant transmission component did not change the results significantly. Further, CLT elements have a comparable high internal loss factor (greater than 0.03) and the ISO 15712 standards suggest that the loss factor correction that requires a rather tedious prediction of the total loss factors for the field situation is not necessary and only the geometry of the lab has to be adjusted to the field situation.
The vibration reduction indices kij’s that are also necessary as input data were measured at floor-wall junction mock-ups. Different connection methods were tested and it was found that junction transmission in the continuous floor slab is strongest and independent of the connection methods of the walls. Transmission from the upper to the lower wall or to the floor slab is weaker and depends on the wall connection details. The normalization of the direction averaged velocity level difference to the vibration reduction index was done using geometry only and loss factor. In this case the differences were only marginally different. The prediction of flanking airborne and impact sound insulation for a floor-wall junction in a rooms side-by-side case was done also using only geometry and also the loss factor. In this case the differences were small for the floor-wall path, but bigger at mid and high frequencies for the floor-floor path. This is due to the higher total loss factor of the floor slabs that have great edge losses due to the small junction attenuation in the continuous floor slab at the junctions.
Nevertheless, this study was investigating effects in the prediction methods and validation through comparisons with apparent sound insulation measurements in buildings or room mock-ups are necessary, to fully understand which approaches are best suited.
ACKNOWLEDGEMENTS
The presented work was conducted as part of a client funded research project on mid-rise wooden construction. The authors acknowledge the support of Canadian Wood Council, FPInnovations and the Provinces of Quebec and Ontario.
REFERENCES
[1] Schramm, M., Dolezal, F., Rabold, A., Schanda, U. “Stossstellen im Holzbau – Planung, Prognose und Ausführung” Proceedings of DAGA 2010, Berlin, 2010.
[2] Dolezal, F., Bednar, T., Teibinger, M. “Flankenübertragung bei Massivholzkonstruktionen Teil 1: Verbesserung der Flankendämmung durch Einbau elastischer Zwischenschichten und Verifizierung der Andwendbarkeit von EN 12354” Bauphysik 3, Heft , 2008
[3] Dolezal, F., Bednar, T., “Schall-Längsleitung bei Massivholzkonstruktionen” Proceeedings of DAGA 2008, Dresden, 2008
[4] Homb, A., “Flanking Transmission Measurements in a Cross Laminated Timber Element Building”, Proceedings of EURONOISE 2012, Prague, 2012
[5] Guigou-Carter, C., Villot, M., Wetta, R., “Prediction Method Adapted to Wood Frame Lightweight Construction”, Building Acoustics, Volume 13, Number 3, p.173, 2006