READ THESE TERMS AND CONDITIONS CAREFULLY BEFORE USING THIS WEBSITE.
https://nrc-publications.canada.ca/eng/copyright
Vous avez des questions? Nous pouvons vous aider. Pour communiquer directement avec un auteur, consultez la
première page de la revue dans laquelle son article a été publié afin de trouver ses coordonnées. Si vous n’arrivez pas à les repérer, communiquez avec nous à PublicationsArchive-ArchivesPublications@nrc-cnrc.gc.ca.
Questions? Contact the NRC Publications Archive team at
PublicationsArchive-ArchivesPublications@nrc-cnrc.gc.ca. If you wish to email the authors directly, please see the first page of the publication for their contact information.
NRC Publications Archive
Archives des publications du CNRC
This publication could be one of several versions: author’s original, accepted manuscript or the publisher’s version. / La version de cette publication peut être l’une des suivantes : la version prépublication de l’auteur, la version acceptée du manuscrit ou la version de l’éditeur.
Access and use of this website and the material on it are subject to the Terms and Conditions set forth at
Sound transmission through gypsum board walls Warnock, A. C. C.; Quirt, J. D.
https://publications-cnrc.canada.ca/fra/droits
L’accès à ce site Web et l’utilisation de son contenu sont assujettis aux conditions présentées dans le site LISEZ CES CONDITIONS ATTENTIVEMENT AVANT D’UTILISER CE SITE WEB.
NRC Publications Record / Notice d'Archives des publications de CNRC:
https://nrc-publications.canada.ca/eng/view/object/?id=22916302-75be-44e5-a7e9-b3b7ee485fe3 https://publications-cnrc.canada.ca/fra/voir/objet/?id=22916302-75be-44e5-a7e9-b3b7ee485fe3
A.C.C. Warnock and J.D. Quirt
Institute for Research in Construction, National Research Council of Canada, M27 Montreal Road, Ottawa, Ontario, Canada, K1A 0R6
RÉSUMÉ
Les principaux facteurs de réduction de la perte de transmission sonore dans les murs creux constitués de feuillets isolés ou liés par un dispositif élastique sont la masse des plaques de plâtre et la largeur de la lame d’air, mais on peut réaliser des gains importants, aux basses fréquences, en déterminant soigneusement l’espacement des poteaux et le type d’absorbant acoustique. Les avantages qu’il y a à utiliser des absorbants phoniques opposant une grande résistance à
l’écoulement sont manifestes aux hautes fréquences mais non pas aux basses fréquences, qui déterminent la CTS (classe de transmission sonore) et R’w. Il faudrait pousser les recherches afin d’établir clairement ce qui se passe dans le cas de ces matériaux denses.
INTRODUCTION
This paper describes additional findings from a project to study sound transmission through cavity walls constructed from gypsum board using industry-standard details and carefully
selected materials1.
The project was initiated because of the increased sound insulation required in the 1990 National Building Code of Canada (NBCC), the removal the minimum weight requirements for gypsum wallboard in Standard CAN/CSA-A82.27-M91, and the realization that much of existing published data is obsolete or unsuitable. By making all the measurements in a single laboratory, differences among laboratories are avoided and details of specimen construction could be controlled closely. The full report of the study2, in terms of STC only, provides for builders and regulators a reliable and consistent assembly of sound transmission class (STC) data.
About 400 wall systems were tested to examine many parameters but only a few issues can be discussed in this paper. A more detailed report is in preparation.
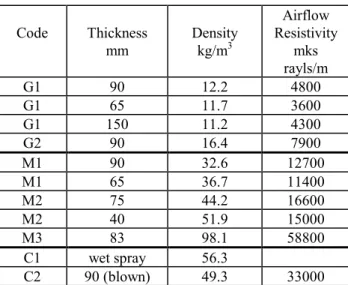
Table 1: Properties of sound absorbing materials. The letters G and M in the code denote glass and mineral fibre batt materials. The letter C stands for cellulose which was sprayed on to one surface or blown into the cavity. Code Thickness mm Density kg/m3 Airflow Resistivity mks rayls/m G1 90 12.2 4800 G1 65 11.7 3600 G1 150 11.2 4300 G2 90 16.4 7900 M1 90 32.6 12700 M1 65 36.7 11400 M2 75 44.2 16600 M2 40 51.9 15000 M3 83 98.1 58800 C1 wet spray 56.3 C2 90 (blown) 49.3 33000
NRCC-38990
2
MATERIALS AND STRUCTURES
Stud systems tested included a single row of 90 mm wood studs (with and without 13 mm resilient metal channels), 65, 90 and 150 mm non-load-bearing steel studs, staggered 90 mm wood studs, a double row of 90 mm wood studs, double rows of 40 and 65 mm steel studs and load-bearing steel studs with 13 mm resilient metal channels. The average properties of the seven sound absorbing materials used are listed in Table 1. In some walls, two thicknesses of the batts were used. The thickness of sprayed-on cellulose varied with the type of structure being
measured.
Type X fire-rated and conventional gypsum board were used in two standard thicknesses, 12.7 and 15.9 mm. Board density ranged from 7.3 to 11.5 kg/m2. Bending stiffnesses for the boards were measured by another agency who found the average value of Young's modulus to be 2.3 x 10⁹ N/m2.
DEPENDENCE OF STC AND R’
WON MATERIALS AND STRUCTURE
The major factors that control sound transmission through walls have long been known. This project revealed the significance of other factors that had not been considered very important. To provide an overview, multiple regression analyses were made for the single number ratings STC3 and R’w4 as dependent variables and factors such as mass, cavity depth, airflow resistance as
independent variables. Only 360 walls, those with a single cavity containing sound absorbing material and having the two layers independent or resiliently connected, were included in the analysis. For STC and R’w the regression equations found were
STC= −69 8 33 5+ ⋅ Mg+32 2⋅ d− ×7 10− ⋅R+0 017⋅Soc 10 10 4 . . log . log . , r2 = 0.903 and R'w= −60 3 29 5. + . log⋅ 10 Mg+32 2. ⋅log10d−2 1 10. × −4⋅R+9 2 10. × −3⋅Soc, r2 = 0.924 Here Mg is the total mass per unit area of gypsum board (kg/m2), d is the cavity depth (mm), R is
the flow resistance of the sound absorbing material (mks rayls), and Soc is the stud spacing
(mm). The standard errors of the estimates are 2.0 and 1.6 dB respectively. At frequencies below 500 Hz, the same physical factors accounted for most of the variance. Above 500 Hz, stud spacing was not a significant factor. Simple multiple correlation with these variables failed at higher frequencies because of gypsum board stiffness effects and other factors. This is of little importance if only STC or R’w are considered. Transmission loss (TL) contours for common
cavity walls using lightweight materials are such that the ratings are controlled by TLs at
frequencies below 500 Hz. The variance for STC is probably slightly larger because of the 8 dB limitation which makes STC overly sensitive to random variations in measured TL around 125 Hz.
Dependence of TL on weight and cavity depth was expected. Some dependence on stud spacing was also expected from the earlier work in this project where pronounced resonances were seen when gypsum board was directly attached to wood studs. The next section discusses stud spacing.
What is surprising in the equations above, is the negative dependence on the flow resistance of the sound-absorbing material. For a 90 mm thickness of the minimum and maximum values of flow resistance in Table 1, the expected change in STC is about 3; for R’w, the expected change
EFFECTS OF STUD SPACING
Attaching gypsum board to studs creates smaller sub-panels with a width determined by the stud spacing. The edge conditions and the radiation from these sub-panels will depend on stud properties and the spacing of the screws attaching the gypsum board. In general, the greater the distance between studs or resilient metal channels, the greater the sound transmission loss at the lower frequencies. Figure 1 shows improvements for three systems with layers of 16 mm gypsum board on each face. The curve labeled SS90 shows the mean improvement for 90 mm steel stud walls when the stud spacing is changed from 400 to 600 mm. The curve labeled DWS shows the improvement with double stud walls for the same change in stud spacing. The curve labeled WS&RC shows the improvement when both stud and resilient metal channel spacings are changed from 400 mm to 600 mm. Resonance effects are pronounced around 125 Hz in each case. Similar results were found for other types of gypsum board. STC and R’w are often
controlled by TL values around 125 Hz, so increased stud and channel spacings can lead to dramatic rating increases. Even with resilient steel studs and double wood studs, there is a benefit to having larger stud separations.
Wood Studs with Resilient Channels.
Measurements with two layers of gypsum wallboard on one side and one on the other showed small but consistent improvements in TL when the channels were attached to the single layer of gypsum board. However, the STC ratings were the same no matter which side of the studs the channels were attached to, and, in fire resistance tests, the assembly with 2 layers of gypsum board attached to the channels gave a better fire resistance rating.
EFFECTS OF SOUND
ABSORBING MATERIAL.
The previous paper reported a positive correlation between airflow resistance and transmission loss from 500 to 2000 Hz. The reason for the negative correlation found here between STC and R’w and airflow resistance can be found be examining Figures 2 and 3. The
plots show differences in TL as a function of airflow resistance relative to the case where the cavity contained 90 mm of sound absorbing material G1. A set of differences was calculated for a single stud and gypsum board arrangement with different sound absorbing materials. The figures combine several sets of differences. By referring to a standard absorption condition for each construction type, differences in TL should be due only to the sound absorbing material. Reference to Table 1 shows that different locations on the flow resistance axis correspond to different materials, especially at the right hand side of the plots. Clumps of points are identified in Figure 2 for mineral and cellulose fibre. Figure 2 shows that the mineral fibre and cellulose fibre materials tend to give lower transmission loss values at 125 Hz. Similar relationships are
63 125 250 500 1000 2000 4000 -4 -3 -2 -1 0 1 2 3 4 5 6 7 SS90 DWS600-400 WS & RC R e la ti ve T L , d B Frequency, Hz
Figure 1: Improvements in transmission loss due to changes in stud or resilient metal channel spacing.
NRCC-38990
4
found for other low frequencies. This leads to lower STC and R’w ratings. For some of these
materials as flow resistance increased, so did density and rigidity and there might well have been transmission through the structure of the material. In addition, the very dense M3 material seemed to increase the effective rigidity of the non-load-bearing steel studs.
At higher frequencies, transmission loss increases with increasing flow resistance as found in the previous work1. Figure 3, for 2 kHz, marks sets of differences with different symbols and shows some outliers (open circles) in the upper left corner. These outliers come from
measurements made on double wood stud systems and show clear, consistent trends at the higher frequencies with improvements due to increasing airflow resistance significantly higher than for other systems. Double wood stud systems are physically connected only around the edges of the specimen through the mounting frame. In all the other wall systems, there is coupling through resilient metal studs or channels. These paths may allow significant sound energy to bypass the airborne path through the sound absorbing material and reduce its effectiveness. This needs further investigation. 0 1000 2000 3000 4000 5000 -10 -5 0 5 M3 C2 C1,C2 125 Hz T L r e G1 c a s e , d B
Airflow resistance, mks rayls 0 1000 2000 3000 4000 5000
-5 0 5 10 15 20 2000 Hz T L r e G1 c a s e , d B
Airflow Resistance, mks rayls
Figure 2: Transmission loss at 125 Hz relative to a cavity containing 90 mm of G1.
Figure 3: Transmission loss at 2000 Hz relative to a cavity containing 90 mm of G1.
SUMMARY
While the most important factors controlling sound transmission loss in cavity walls constructed with isolated or resiliently coupled leaves are the gypsum board mass and the depth of the cavity, there are some important gains to be made at the lower frequencies by carefully selected stud spacing and the type of sound absorbing material. The benefits available from using sound absorbing materials with higher flow resistivity are quite apparent at the higher frequencies but are not evident at the low frequencies that determine STC and R’w. The sound absorbing
materials tested were selected from commercial materials sold for use in wall and floor cavities. The data presented here suggest that there are factors other than airflow resistance to be
REFERENCES
1
Quirt and A.C.C. Warnock, INCE 93, p971, 1993.
2
Final Report for the Gypsum Board Wall Consortium. IRC internal report IR 693
3
ASTM E413
4