https://doi.org/10.4224/20393376
READ THESE TERMS AND CONDITIONS CAREFULLY BEFORE USING THIS WEBSITE.
https://nrc-publications.canada.ca/eng/copyright
Vous avez des questions? Nous pouvons vous aider. Pour communiquer directement avec un auteur, consultez la première page de la revue dans laquelle son article a été publié afin de trouver ses coordonnées. Si vous n’arrivez pas à les repérer, communiquez avec nous à [email protected].
Questions? Contact the NRC Publications Archive team at
[email protected]. If you wish to email the authors directly, please see the first page of the publication for their contact information.
Archives des publications du CNRC
For the publisher’s version, please access the DOI link below./ Pour consulter la version de l’éditeur, utilisez le lien DOI ci-dessous.
Access and use of this website and the material on it are subject to the Terms and Conditions set forth at NEF validation study: (3) final report
Bradley, J. S.
https://publications-cnrc.canada.ca/fra/droits
L’accès à ce site Web et l’utilisation de son contenu sont assujettis aux conditions présentées dans le site
LISEZ CES CONDITIONS ATTENTIVEMENT AVANT D’UTILISER CE SITE WEB.
NRC Publications Record / Notice d'Archives des publications de CNRC:
https://nrc-publications.canada.ca/eng/view/object/?id=f07ea19e-e398-46cc-93a5-a6ce700bd143 https://publications-cnrc.canada.ca/fra/voir/objet/?id=f07ea19e-e398-46cc-93a5-a6ce700bd143
Bradley, J.S.
www.nrc.ca/irc/ircpubs A-1505.6
( 3)
Fin a l Re por t
Cont ract Report A- 1505.6( Final)
This report was j oint ly funded by:
I nst it ut e for Research in Const ruct ion, Nat ional Research
Council
and
Transport Canada
This r epor t m ay not be r epr oduced in whole or in par t wit hout t he wr it t en consent of bot h t he client and t he Nat ional Resear ch Council Canada
NEF VALIDATION STUDY: (3) FINAL REPORT
The contents of this report are the results of analyses carried out by the Acoustics Laboratory of the Institute for Research in Construction at the National Research Council of Canada. While they are thought to be the best interpretation of the available data, other interpretations are possible, and these results may not reflect the interpretation and policies of Transport Canada.
SUMMARY
This is the summary of the final report of a project to evaluate the validity of the NEF measure of aircraft noise. This final report is
intended to directly respond to the specific requirements of the original proposal. A database of references and two technical reports have already been sent to Transport Canada as part of this project. Summaries of the previous technical reports are included in the
Introduction of this report. The highlights of this final report include:
General Recommendations
• Upgrade (and provide ongoing support for) the continuing development of the NEF_1.7 program.
• Establish and publish noise criteria for all major Canadian airports in terms of NEF values and supplementary single event noise criteria.
• Undertake a major Canadian survey of response to aircraft noise to include: isolated single event type problems, various smaller
airport situations, tests of various time-of-day weightings, evaluation of the long term effectiveness of additional home
insulation, and to provide a comprehensive calibration of the NEF measure.
• Support updating of the CMHC document on new housing and aircraft noise.
• Consider adopting an A-weighted NEF measure.
• Encourage all levels of government to follow a uniform national approach to the management of airport noise in Canada.
Acceptable Aircraft Noise Level Criteria
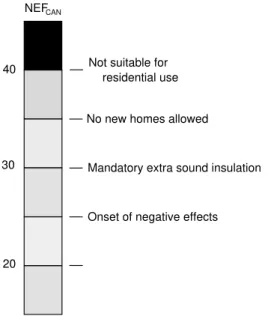
• It is proposed that the following noise level criteria thresholds, which are essentially the same as current recommendations, be adopted in terms of NEFCAN values: NEFCAN 25, the onset of
negative effects of aircraft noise; NEFCAN 30, homes should include
additional sound insulation; NEFCAN 35, no new homes should be built. (NEFCAN refers to NEF values calculated by Transport Canada’s NEF_1.7 program).
• Supplementary single event noise criteria should also be adopted to control noise problems involving small numbers of unusually loud events. Initial proposals were based on previous sleep
interference studies and new considerations of speech interference by aircraft noise.
Historical Development of the NEF Measure
• The NEF measure evolved from the older CNR measure, initially intended for general community noise problems.
• The development was based on a pragmatic common sense
approach using specific consulting community noise case studies.
• The basic concepts did not come from systematic studies and there was never any thorough attempt to calibrate the NEF measure in terms of negative human responses.
Details of the NEF Measure
• The equal energy principle for adding multiple events that is incorporated in the NEF measure is widely accepted and is used in almost all other aircraft noise measures.
• The EPNL metric, which determines the frequency response of the NEF measure, is probably a slightly more accurate predictor of adverse human responses, but it makes NEF values more difficult to measure and hence it is more difficult to validate NEF
calculations.
• The NEF measure incorporates the largest night-time weighting in common use. There are arguments for a smaller night-time
weighting and for the addition of an evening weighting.
• The prediction of the number of operations for future Peak Planning Days could be improved. Errors in forecasting future operations could lead to errors of up to 2 dB in NEFCAN values and
up to 30 % in contour areas. Smaller errors would more typically occur.
• The NEF_1.7 program has archaic input and output procedures, needs to be thoroughly validated, and needs ongoing support for both technical improvements and for improving the user
friendliness of the software in coordination with the improvements of computer hardware.
Users’ Evaluations
• Most users seem to be familiar and comfortable with the NEF measure.
• Many users say that the NEF_1.7 program is not user friendly and lacks sufficient detail in the description of flight paths.
• We do not know how to combine the impact of aircraft noise with other types of community noise such as road traffic noise.
• Too much attention to complaint data can distract us from a rational approach to aircraft noise management.
• Because Transport Canada does not have authority over all aspects of the problem, there is a need for a coordinated effort to manage airport noise and related land use planning that includes all levels of government and is carried out uniformly across the country.
Changes and Special Cases
• Excess ground attenuation algorithms in the NEF_1.7 program are in need of modification because they over-estimate the size of
calculated NEF contours. New procedures must be based on, or validated in terms of, the measured attenuations of aircraft noise.
• There is a need to be able to include more complex approach and departure flight paths to correctly model current operations as well as to include the normal dispersion about the nominal flight path in the NEF_1.7 program.
• There is only limited information on changes of responses to aircraft noise over time from European studies. These show no change of dose-response curves over time.
• Although there are many smaller airports in Canada, the negative impact of these airports on residents is not well understood. The evidence suggests that disturbance may be less at smaller airports but larger where there are significant numbers of general aviation operations.
• Land use planning needs to be in terms of more stable maximum long term goals. It should be based on standard noise level criteria
and it should be applied in a coordinated manner by all levels of government.
CONTENTS
1.0 Introduction...7
1.1 The Final Report ...7
1.2 Summary of Contract Report A1505.3, “NEF Validation Study: (1) Issues Related to the Calculation of Airport Noise Contours” ...8
1.3 Summary of Contract Report A1505.5, “NEF Validation Study: (2) Review of Aircraft Noise and Its Effects” ...10
2.0 The Historical Development of the NEF Measure...13
2.1 History of the CNR and NEF Measures ...13
2.2 The Introduction of the NEF Measure in Canada ...17
2.3 The Development of Other Early Airport Noise Measures...18
3.0 Evaluation of Details of the NEF Calculation Procedure ...21
3.1 Equal Energy Principle ...21
3.2 EPNL Metric...23
3.3 Night-Time Weightings...25
3.4 Forecasting the Number, Type, and Mix of Aircraft...26
3.5 The NEF_1.7 Program ...28
3.6 Comparisons with Other Approaches ...30
4.0 Evaluation of Users’ Experiences with the NEF Procedure ...33
4.1 The NEF_1.7 Computer Program ...33
4.2 The NEF Noise Measure and Its Use ...34
4.3 The Planning Process ...35
4.4 Use of Complaint Data ...37
4.5 Coordination Among Various Levels of Government...37
4.6 Experience in Other Countries ...38
5.0 Evaluation of Effects of Changes and Special Cases ...41
5.1 Excess Ground Attenuation ...41
5.2 Flight Path Details...42
5.3 Changes in Aircraft Type ...42
5.4 Changes Over Time ...43
5.5 Smaller Airports ...44
5.6 Quieter Sites ...44
5.7 Combined Effects...45
6.0 Aircraft Noise Level Criteria ...49
6.1 Limits in Terms of NEF Values...49
6.2 Limits in Terms of Single Event Noise Measures...52
7.0 Conclusions...55
7.1 Components of the Overall Problem...55
7.2 Acceptability of the NEF Measure...55
7.3 Gaps in Our Knowledge ...57
1.0 INTRODUCTION 1.1 The Final Report
This is the final report of a project to re-evaluate the use of the Noise Exposure Forecast measure (NEF) to manage aircraft noise in Canada. The initial proposal for this project indicated that all aspects of the use of the NEF measure should be examined. Specific topics to be considered were grouped into four major areas:
(a) the historical development of the NEF measure, (b) various specific features of the NEF measure, (c) user’s experiences with the NEF measure, and (d) the effects of various changes and special cases.
Because the work on this project has been extended considerably beyond the originally intended scope, the bulk of the technical results have been provided to Transport Canada in two previous technical reports[1,2]. Summaries of each of these previous reports are included later in this chapter. The present report is intended to respond directly to the issues in the original proposal under the four headings given above. Frequent references are made to the two earlier technical reports to avoid extensive repetition of material.
The activities of this project included a literature review, analyses of various human response studies, as well as extensive calculation studies with airport noise calculation programs. A large number of technical references related to aircraft noise and its effects on people were acquired and a computer database of these references was created. Copies of this database, sorted by author and by topic, were provided to Transport Canada. More up-to-date information was obtained by direct discussions with people working on various aspects of the overall airport noise
problem in a number of countries. To evaluate Transport Canada’s NEF_1.7 program, extensive calculation studies were performed that included comparisons with two American aircraft noise calculation programs. The results of these studies were provided in the first
technical report[1]. Extensive analyses of a large number of studies were performed to evaluate current knowledge concerning the effects of
aircraft noise on residents near airports. This produced new
relationships between annoyance and aircraft noise, and between speech disturbance and aircraft noise. New proposals for acceptable noise level criteria were also produced and included in the second technical report[2]. These new proposals clarify but do not significantly change existing
This final report is intended to respond to the issues in the original
proposal on a point-by-point basis. Thus, the headings of each section are mostly those of the original proposal. In some cases, additional headings have been added to reflect the full scope of the work of the project. An additional chapter summarizes new proposals for acceptable noise level criteria developed as part of this work. The technical details of the two previous reports are usually not repeated in this report.
The initial proposal refers to “the calibration of the NEF model”. The “model” refers to an assumed model relating community response to aircraft noise levels measured in terms of NEF values. The “calibration” of this model suggests that studies of community response to aircraft noise have been used to quantify human response to aircraft noise as measured in terms of NEF values. As discussed in Chapter 2, there has never been such a “calibration” and to refer to such a “model” is an exaggeration of the true nature of the history of the development of the NEF measure.
There is certainly a need for such a calibration relevant to Canadian situations. However, it is important to appreciate both the history of the development of the NEF measure, as well as its validity as used today. The three reports of this project are intended to examine in detail various aspects of the NEF measure as currently used. It is hoped that they will stimulate the development of an improved, more uniform, and more technically correct approach to managing airport noise in Canada.
1.2 Summary of Report A1505.3, “NEF Validation Study: (1) Issues Related to the Calculation of Airport Noise Contours”
The NEF_1.7 program is a critical part of the management of airport noise in Canada, and it is extremely important that its validity and accuracy are as good as is reasonably possible. The use of millions of dollars worth of land near each airport is often determined by the noise level contours from this program. Similarly, the acceptability of land near airports for residential use is determined from the calculated noise contours produced by the NEF_1.7 program. The analyses of this report suggest that improving the detail of the flight path description and developing a more correct excess ground attenuation calculation procedure would considerably improve the NEF_1.7 program. It is therefore essential that the required continuing development of the NEF_1.7 program receive the necessary financial and technical support. The analyses of Contract Report A1505.3 were focused on the errors associated with calculating noise levels around airports. The related
problems of determining acceptable noise level limits and the practical application of these limits were considered in Contract Report A1505.5. These two reports formed the technical background for this final report evaluating the use of the NEF measure to quantify airport noise levels near Canadian airports.
Some of the major technical findings of Contract Report A1505.3 are as follows:
• The NEF_1.7 program is similar to other models such as the Integrated Noise Model (INM) and NoiseMap used in U.S.A. Compared to these two models, NEF_1.7 uses simpler flight path descriptions and a different excess ground attenuation calculation. More sophisticated simulation type models are being developed that are potentially more accurate.
• Comparisons of the NEF_1.7, INM, and NoiseMap programs using the same input data from four Canadian airports showed that the NEF contours from the NEF_1.7 program were 60 to 80% larger and NEF values at particular locations were 3 to 4 dB higher. However, it is not known which calculation model agrees best with measured aircraft noise levels. When the complete Canadian approach of using a Peak Planning Day with the NEF_1.7 program was compared with the American approach of using a mean
planning day and the INM model, even larger differences resulted.
• Errors in estimating the expected future total aircraft operations could typically lead to 1 dB errors in NEF values and 12% errors in contour areas. Errors in estimating the number of night time operations would usually be about half as large. Other errors in the estimated input data for future conditions would have smaller overall effects but often quite significant local effects.
• The detail in which the horizontal ground track and the vertical profile of the flight path are described influence the accuracy of the calculations. It is particularly important that the expected
horizontal dispersion of aircraft about the nominal flight track be included in airport noise contour calculations.
• Differences in the calculation of the excess ground attenuation are the major cause of differences in the contours produced by the NEF_1.7 program and the two American programs. Evidence from European research and limited measurements of modern civil aircraft suggest that the most appropriate excess ground
attenuation is intermediate to the NEF_1.7 procedure and the SAE procedure used in the INM and NoiseMap. Data from more
extensive experimental studies are required to determine a better excess ground attenuation calculation procedure.
• A-weighted SEL values and PNL weighted EPNL values can be related with standard errors of less than 2 dB. Ldn and NEF values
were found to relate with errors of less than 1 dB.
• Approximate conversions between various airport noise measures were systematically derived. The largest scatter in these
relationships is caused by different frequency weightings and time of day weightings.
1.3 Summary of Report A1505.5, “NEF Validation Study: (2) Review of Aircraft Noise and Its Effects”
Airports can be both an asset and a liability to nearby communities. Much of the negative impact of an airport is directly due to aircraft noise. Thus, the trade-offs between the costs and the benefits that an airport provides are very strongly related to the details of exposures to aircraft noise.
Contract Report A1505.5 reviewed:
• how people react to aircraft noise,
• how we evaluate aircraft noise exposures,
• various counter measures to reduce aircraft noise problems, and
• determined acceptable noise level limits.
This was the second of two reports intended to provide a comprehensive technical basis for evaluating the use of the NEF measure to quantify aircraft noise in Canada. The first report, A1505.3, considered issues related to the calculation of airport noise contours. Contract Reports A1505.3 and A1505.5 formed the technical background for this final report to Transport Canada reviewing all aspects related to the use of the NEF measure.
Some of the major technical findings of Contract Report A1505.5 were as follows:
• The current form of the NEF measure and related accepted noise level limits have evolved based mostly on intuitive arguments from various practical consulting case studies.
• Aircraft noise is very unlikely to lead to permanent noise induced hearing impairment in populations living near airports.
• There is limited evidence of medical effects related to our
but this evidence comes from studies by one research team at a single airport.
• When peak outdoor levels exceed 80 dBA, sleep indoors can be disturbed.
• New calculations from the details of aircraft fly-overs more accurately relate outdoor single event levels, SEL, and building facade noise reductions to speech intelligibility. When aircraft noise SEL exceeds 90 dBA, indoor speech communication can be degraded.
• The Schultz dose-response curve considerably underestimates the percentage of highly annoyed residents near major airports.
• The Perceived Noise Level more accurately reflects human response to noise than the A-weighting, but the difference in prediction accuracy is only 0.5 dB.
• Summing the effect of combinations of levels and numbers of events on an energy basis is as good as any other approach.
• The 12 dB night-time weighting incorporated in the NEF measure is larger than in other aircraft noise measures. There is evidence to suggest that smaller night-time weightings are more correct and that evening weightings are also important.
• There is no evidence that attitudes to aircraft noise change over time independent of noise levels.
• There is little information concerning the negative effects of aircraft noise near smaller airports and the effects of general aviation activities. In previous studies, the effects of airport size and types of aviation activity have usually been confused.
• Reduction of aircraft noise at the source most effectively and universally controls airport noise problems. Although possible reductions over the next few years will be small, it is important to encourage the continuing development of quieter aircraft.
• Various counter measures can be used to provide immediate reductions in noise exposures near airports. Such
countermeasures must be tailored to the operational and geographical details of each airport.
• Better techniques are needed to provide improved sound insulation of buildings against aircraft noise, and the perceived benefits of such insulation need to be thoroughly evaluated.
• Almost all major developed countries have their own aircraft noise measure, their own set of acceptable noise limits, and their own particular approach to controlling airport noise problems.
• A new set of acceptable aircraft noise level limits have been derived from the best available technical information. These thresholds correspond to: NEFCAN 25 the onset of negative effects, NEFCAN 30 extra sound insulation required, and NEFCAN 35 the maximum acceptable level for constructing new homes. (Where NEFCAN refers to the NEF values calculated by the Transport Canada NEF_1.7 program). These new proposals are essentially the same as existing recommendations[3].
REFERENCES
1. Bradley, J.S., "NEF Validation Study: (1) Issues Related to the Calculation of Airport Noise Contours", NRC Contract Report to Transport Canada, A1505.3 (1993).
2. Bradley, J.S., "NEF Validation Study: (2) Review of Aircraft Noise and Its Effects", NRC Contract Report to Transport Canada, A1505.5 (1994).
3. Pilon, C., “Land Use in the Vicinity of Airports”, Transport Canada Report, TP 1247, March (1989)
2.0 THE HISTORICAL DEVELOPMENT OF THE NEF MEASURE
The Noise Exposure Forecast (NEF) is a single number rating of overall aircraft noise. It combines the noise levels of individual aircraft and the numbers of aircraft to give a single number rating of the average
negative impact of the aircraft noise. The current NEF metric evolved from the earlier Composite Noise Rating (CNR) which was initially developed for general community noise situations and later modified to evaluate aircraft noise. While these measures were being developed in the United States, other early airport noise measures were being developed in Europe. In the United Kingdom, the Noise and Number Index (NNI) was introduced in the early 1960’s. Shortly after this, the Störindex (Q) was introduced in Germany, and the Psophique Index (Ip)
in France. The development of these aircraft noise measures in the early 1960's was a direct result of the public reaction to the widespread
introduction of jet engine powered civil aircraft.
2.1 History of the CNR and NEF Measures (see also Chapter 2 of [1])
(a) CNR as a Community Noise Measure
There were five major steps in the development of the NEF measure from the initial versions of the Composite Noise Rating (CNR)[2]. The CNR was first proposed by Rosenblith and Stevens in 1952. The initial concept was to rate general community noise. This was modified somewhat by the same team from Bolt Beranek and Newman in 1955. In 1957, a new scheme was proposed for considering aircraft noise in terms of a CNR rating. This aircraft noise CNR method was further modified in the early 1960's so that it was based on the perceived noise levels. The full NEF concept was proposed in 1967.
These early developments were engineering proposals that were not systematically tested. They were based on concepts intuitively suggested by experiences with various consulting case studies. Responses were described in terms of “community response” that generally included references to complaints, and threats of legal actions. Such concepts pre-date scientific annoyance surveys and an understanding that complaint data is not a reliable measure of community response.
The initial version of CNR for general community noise was proposed by Rosenblith and Stevens in 1952[3]. It was based on octave band noise measurements that were given an equivalent sound pressure level (SPL) in the 300-600 Hz octave frequency band (an older system of octave bands
that is no longer used). This equivalent SPL was obtained by plotting the measured octave band spectrum on a system of level ranking contours that were similar to equal loudness contours. The level rank contours were in 5 dB intervals and hence the resulting CNR values were also in 5 dB intervals. A number of corrections were then made to better approximate the expected negative community response. These related to: the presence or absence of pure tone components, impulsive or non-impulsive sounds, repetition of the sound, background noise levels, time of day, and expected community adaptation to the noise. CNR values were determined from noise levels and associated corrections for the data from 11 case studies of community noise problems. The CNR values were then compared with a six item scale describing the estimated community response. This scale varied from “no annoyance” to “vigorous legal
action”. The scheme was a sensible first attempt, but apparently did not relate well to the 11 case study results[2].
The original community noise CNR scheme was modified by Stevens, Rosenblith, and Bolt in 1955[4]. Changes to the consideration of the repetitive sounds brought the procedure closer to an equal energy approach, and corrections for seasonal variations were introduced. The descriptive scale of community response was reduced from six to five items, and the labels attached to each step were changed. The new scale referred only to “complaints” and “community reaction”. The revised procedure was said to be successful for predicting changes in community response but less successful on an absolute basis.
(b) CNR as a Measure of Aircraft Noise
In the late 1950’s, the U.S. Air Force began developing procedures for evaluating noise levels and for land use planning around air bases. This led to a new version of the CNR concept specifically for aircraft noise and an associated scheme to predict aircraft noise levels. The scheme
proposed by Stevens and Pietrasanta in 1957[5] evaluated aircraft noise in terms of its equivalent level in the 300-600 Hz octave band. It no longer included tone and impulsiveness corrections, but corrected for repetitions in a true energy equivalent manner. Seasonal corrections and background noise level corrections were retained. The day/night
correction was expanded to be a day/evening/night correction with 5 and 10 dB relative adjustments for the evening and night periods,
respectively. The scale describing community response was reduced to three steps where the extremes were labeled “no concern” and
“unquestionably unacceptable”.
A procedure for calculating noise levels from aircraft on the ground (ground run-up noise) and aircraft in flight was also developed[6]. The
procedure used the combination of the maximum pass-by level and the effective duration of the pass-by to estimate the total energy received from a single aircraft pass-by. That is, the contribution of each aircraft was essentially described in terms equivalent to a sound exposure level (SEL). The calculations included estimates of the directivity of aircraft as well as profiles of aircraft height versus distance from the start of the take-off. The contributions of multiple aircraft were added on an energy basis. No consideration was given to excess ground attenuation.
The use of the CNR measure to evaluate aircraft noise was further modified in 1962 to include the use of Perceived Noise Levels developed by Kryter[7]. Kryter developed a set of equal noisiness functions for sounds in various frequency bands that was quite similar to the Stevens loudness calculation procedure. From the complete spectrum of a noise, a single value termed the Perceived Noise Level, in PNdB, was intended to rank the noise in terms of how noisy it would be perceived. However, the resulting rankings were quite similar to the earlier level ranking contour scheme.
At about the same time, a new airport noise planning document was produced for the U.S. Air Force[8]. It included aircraft noise contours in terms of PNdB as well as other improvements. Several simplifications were also made. Time-of-day weightings were reduced to a single 10 dB night-time weighting. Corrections for background noise levels and community attitudes were dropped. Again, by using data from case studies, the resulting CNR values were related to the previous three-category scale describing expected community response. These three categories were essentially: no complaints, some complaints, and
vigorous complaints. The separations between the three regions were set in terms of the sum of the average maximum perceived noise level,
<PNLmax>, and 10 times the logarithm of the number of aircraft, N, i.e. <PNLmax> + 10•log(N)
Initially, the separation between the lower and middle categories was set for this sum equal to 112 and the division between the middle and upper region at 122. In order to “give airports the benefit of the doubt”[2], this last value was increased to 127. To obtain values that were multiples of 5 (because of the desire for 5 dB steps), these values were normalized to a base case of 10 to 30 operations per day by subtracting 12 dB from each. The resulting CNR values of 100 and 115 divided the three regions of the estimated community response scale. A similar table with 20 dB lower CNR values was devised for ground run-up noises.
Reports published in 1967[9,10] introduced the Noise Exposure Forecast (NEF) as a development from the earlier CNR scheme for aircraft noise. The new NEF procedure included new developments associated with perceived noise levels, removed the limitation of doing all calculations in 5 dB steps, but included no new information on community response to aircraft noise. At the same time, procedures for calculating expected aircraft noise in terms of the new NEF measure were also improved. The perceived noise level concept had been extended to include corrections for the presence of pure tones and for the influence of the duration of each aircraft pass-by. The combination of these two
additional factors resulted in a new measure referred to as the Effective Perceived Noise Level (EPNL). Performing all calculations in 5 dB steps was intended as a simplification to make calculations easier, but led to unnecessary errors. The NEF calculation also included an arbitrary constant so that the resulting NEF values were quite different than the corresponding CNR values. NEF values were related to the three levels of community response by assuming an approximate equivalence of NEF 40 to CNR 115 and NEF 30 to CNR 100. These approximations were obtained from comparisons of calculated CNR and NEF values[2]. Thus, the conversions would be influenced by possible errors in these early calculation algorithms.
Bishop and Horonjeff’s[9] proposal included a night-time weighting that resulted in night-time operations being counted as 12.2 dB more
significant than day-time operations. The weighting was chosen so that with the same number of operations per hour during the night-time hours as during day-time hours, the night-time NEF would be 10 dB greater than the day-time NEF. Because there were 9 night-time hours and 15 day-time hours, the number of night-time operations was multiplied by 10(15/9) = 16.67, which is equivalent to 12.2 dB. No evidence was presented to support the choice of this particular night-time weighting and no other aircraft noise measure has ever used this night-time weighting.
NEF is defined as follows and is summed over all aircraft types and all flight paths:
NEF = <EPNL> +10•log(Nd + 16.7•Nn) - 88
where <EPNL> is the mean EPNL of aircraft fly-overs; Nd and Nn are the numbers of day-time and night-time operations, respectively.
By the late 1960’s, the complete NEF measure had been developed to the form that is used today. At no point was the formulation influenced by
any scientific survey of residents’ responses to aircraft noise. (Of course, subjective laboratory studies were involved in the development of the EPNL measure that is a part of the NEF measure.) The implied principle of energy summation and the night-time weighting were not based on any systematic studies. Expected community response was described in very general terms of complaints. These descriptions were based on consulting experiences from a limited number of specific cases of
community noise problems. Although Borsky's[11] early survey results had already indicated that complaint data were not a reliable measure of community response, there was no attempt to develop a noise measure or acceptable noise level criteria from such systematic surveys of responses to aircraft noise.
The NEF measure has been used in Canada, Australia, Yugoslavia, and Hong Kong. However, in Australia the time-of-day weightings were changed as a result of a major subjective survey of residents near Australian airports. The NEF measure was not widely used in the United States. In the early 1970’s, the political requirement for a single environmental noise measure led to the adoption of the day-night sound level (Ldn) in the United States.
2.2 The Introduction of the NEF Measure in Canada
The CNR system was initially used by Transport Canada as a tool for land use planning around airports[13]. Tabular calculations of CNR values were described with a 10 dB night-time weighting. A table of expected community response was also given that was similar to that described above. Thus, initially the American CNR system for aircraft noise was adopted without obvious changes.
The same Transport Canada report[13] also describes the NEF system and compares it with the older CNR method. The critical CNR values of 100 and 115 were again approximated as NEF 30 and NEF 40,
respectively. The table of expected community response from this
report[13] is in terms of NEF values and is duplicated here in Table 2.1. This table is very similar to the earlier American tables from which it was derived. Table 2.1 was included in early versions of the CMHC document “New Housing and Aircraft Noise”[14]. This same table is also used in more recent CMHC and Transport Canada documents[15,16].
NEF Range Expected Response
> 40 Repeated and vigorous individual complaints are likely. Concerted group and legal action might be expected. 35-40 Individual complaints may be vigorous. Possible group
action and appeals to authorities.
30-35 Sporadic and repeated individual complaints. Group action is possible.
<30 Sporadic complaints may occur. Noise may interfere occasionally with certain activities of the resident.
Table 2.1. Relation of expected community response to NEF values from reference [13].
The CMHC documents on airport noise were one result of a three-party collaboration on airport noise problems during the early 1970’s in
Canada. The National Research Council, Canada Mortgage and Housing, and Transport Canada pooled their efforts to develop a rational approach to airport noise problems. The National Research Council carried out measurements of the sound attenuation of a test house constructed with the support of CMHC. Transport Canada provided the aircraft noise sources. All three parties worked together to produce the above table of acceptable values. The details of this table were a compromise to address several different concerns. There was the desire to ensure that people would be protected from high levels of aircraft noise. There were also concerns about the accuracy of NEF calculations at lower NEF values. Finally, there was also the concern that excessively restrictive limits would eliminate large areas of land from possible residential
development with CMHC backed mortgages.
The currently used descriptions of expected community response were derived from the original CNR descriptions based on general impressions of community response for a small number of specific consulting case studies. These descriptions have not been influenced by more modern systematic community surveys of residents near airports. They have not been influenced by studies of any Canadian subjects. Thus, there has never been any serious attempt to calibrate values of the NEF measure with the negative effects on residents near Canadian airports.
2.3 The Development of Other Early Airport Noise Measures
The Noise and Number Index (NNI) was derived from the results of the first major survey of residents around London’s Heathrow airport. While the CNR and NEF were developed on the basis of a simple energy
summation, the NNI introduced the concept of different trade-offs between the noise levels of individual aircraft and the numbers of aircraft. The NNI is defined as follows:
where <PNLmax> is the mean of the maximum perceived noise levels of the aircraft pass-bys, in PNdB, and N is the total number of aircraft pass-bys. With this noise measure, doubling the number of operations results in a 4.5 dB increase in NNI values, which is greater than the 3 dB increase that would result from a simple energy summation approach. It has been suggested[2] that a simple energy summation measure would have been practically as successful in relating to the response data in the original London survey as was the NNI measure. The suitability of the simple energy summation approach will be considered in more detail in section 3.1.
The German Störindex (Q)[12], developed after the NNI, also weighted the influence of the number of operations more than for a simple energy summation. The Q measure was based on a doubling of operations causing a 4 dB increase in the noise measure. Q is defined as follows:
Q = 13.3•log(Στ•10(Lmax/13.3)
/T)
where τ is the duration of the pass-by, Lmax is the maximum A-weighted
sound level during the pass-by, and T is the time period over which the Q value is calculated. The summation is made over the τ and Lmax values of
all aircraft operations in the time period T. The measure was originally based on maximum PNdB levels.
The French Psophique Index (Ip) was developed in the late 1960’s. It is a
simple energy summation type measure based on aircraft levels in PNdB. Although it originally included a complicated two-part night-time
correction, it now has a simple 10 dB night-time weighting. It is currently defined as follows:
Ip = <PNLmax> + 10•log(Nd +10•Nn) - 32
where Nd and Nn are the number of operations during the day and night periods, respectively. Values of this measure were initially related to residents’ responses from the results of a large survey near four French airports.
REFERENCES
1. Bradley, J.S., "NEF Validation Study: (2) Review of Aircraft Noise and Its Effects", NRC Contract Report to Transport Canada, A1505.5 (1994).
2. Galloway, W.J. and Bishop, D.E., "Noise Exposure Forecasts: Evolution, Evaluation, Extensions, and Land Use Interpretations", FAA Report FAA-NO-70-9 (August 1970).
3. Rosenblith, W.A. and Stevens, K.N., "Handbook of Acoustic Noise Control, Vol. 2, Noise and Man", WADC TR-52-204, Wright Patterson Air Force Base, Ohio (1953). 4. Stevens, K.N., Rosenblith, W.A., and Bolt, R.H., "A Community’s Reaction to Noise:
Can It be Forecast?", Noise Control, Vol. 1, pp. 63-71 (1955).
5. Stevens, K.N. and Pietrasanta, A.C., "Procedures for Estimating Noise Exposure and Resulting Community Reactions from Air Base Operations", WADCTN-57-10, Wright Patterson Air Force Base, Ohio (1957).
6. Stevens, K.N., Galloway, W.J., and Pietrasanta, A.C., "Noise Produced on the Ground by Jet Aircraft in Flight", J. Acoust. Soc. Am., Vol. 28, 163 (1956). 7. Kryter, K.D., "Scaling Human Reactions to Sound from Aircraft", J. Acoust. Soc.
Am., Vol. 31, pp. 1415-1429 (1959).
8. Galloway, W.J. and Pietrasanta, A.C., "Land Use Planning Relating to Aircraft Noise", Technical Report No. 821, Bolt Beranek, and Newman Inc. (October 1964). 9. Bishop, D.E. and Horonjeff, R.D., "Procedures for Developing Noise Exposure
Forecast Areas for Aircraft Flight Operations", FAA Report DS-67-10, Washington (August 1967).
10. SAE Research Committee R.2.5, "Technique for Developing Noise Exposure Forecasts", FAA Report DS-67-14 (August 1967).
11. Borsky, P.N., "Community Reactions to Air Force Noise", WADD Technical Report 60-689, Wright Patterson Air Force Base (March 1961).
12. Brück, W., Grützmacher, M., Meister, F.J., and Müller, E.A., "Flüglarm", Göttingen (May 1965).
13. Kingston, R.J., Beaton, J.F. and Rohr, R.J.J., "A Description of the CNR and NEF Systems for Estimating Aircraft Noise Annoyance", Report R-71-20, Canadian Air Transportation Administration, Ottawa (October 1971).
14. "New Housing and Aircraft Noise", NHA 5059, Central Mortgage and Housing Corporation (1972).
15. "New Housing and Airport Noise", Canada Mortgage and Housing Corporation, Ottawa (1981).
16. Pilon, C., "Land Use Planning in the Vicinity of Airports", Transport Canada Report TP-1247 (March 1989).
3.0 EVALUATION OF DETAILS OF THE NEF CALCULATION PROCEDURE
This chapter reviews several specific issues associated with the NEF measure. These include: the equal energy approach, the EPNL metric, and time-of-day weightings which are at the heart of the NEF measure. Also included are: evaluation of the forecasting of aircraft operations, a critique of the NEF_1.7 program, and comparisons with other types of aircraft noise measures.
3.1 Equal Energy Principle (See also Section 4.2 [1])
Residents near airports are exposed to varying numbers of aircraft, each producing different levels of noise at a particular resident’s home. Many noise measures have been devised to predict the combined disturbance of these multiple aircraft noise events. The most common basic hypothesis concerning the combination of noise levels and numbers of noise events is that annoyance is proportional to the total energy of the aircraft noise events. Thus, many noise measures are of a form that is similar to the following,
% Highly Annoyed α <SEL> + K•log(N) (3.1) where <SEL> is the integrated sound exposure level for an average aircraft and N is the total number of such events.
If K is exactly 10, then the summation, <SEL>+10•log(N), corresponds to the total energy of the aircraft noise events.
Other values of K have been incorporated into aircraft noise measures. The Noise and Number Index, NNI, has a K value of 15. The German Störindex, Q (now referred to as an aircraft noise equivalent level, Leq(FLG)) includes a K of 13.3. Both were derived from early aircraft noise surveys and have been widely used. These K values greater than 10 suggest that the number of operations is relatively more important than the noise levels of each aircraft.
Deciding whether the above relationship, expression (3.1), is appropriate, and the correct value of K, has been considered using both field and laboratory subjective studies. Laboratory experiments can provide more precise subjective evaluations than field studies, but cannot duplicate all of the influences of the real situation in the subject’s home. Thus, the level of annoyance cannot be absolutely correct. While field studies can include realistic settings, they are notorious for producing subjective response data that are only weakly correlated with noise measures. Using this type of data, it is very difficult to reliably differentiate
between two noise measures, having different K values, as predictors of annoyance.
Rice[2] reviewed laboratory studies on this subject that had been carried out in the United States and the United Kingdom. He concluded that an equal energy approach could satisfactorily explain many of the results, although it may not always be the correct explanation.
Rylander et al.[3] produced the most controversial field study results concerning the trade-off between levels and numbers of events. Their results suggested that the percentages very annoyed were related to the numbers of operations. However, a re-analysis of this data[1] suggested that an equal energy measure such as Ldn was an equally satisfactory predictor of responses.
Fields[4] reviewed the results from 14 surveys of various types of noise. He calculated optimum K values from the results of each of these
surveys. His calculations resulted in a wide range of K values usually with large standard errors. Fields found a mean K value of 5 from these studies. However, the data were not precise enough to conclude that a K value of 10 was not optimum.
The NNI measure, that incorporates a K of 15, has been used in
Switzerland for a number of years, even though the Swiss aircraft noise survey in 1971[5] found a K value of 8 to be best. The Swiss use of NNI seems to be based on the use of NNI in the United Kingdom. However, a more recent survey in the United Kingdom[6] designed specifically to evaluate the relative merits of NNI and Leq measures concluded that a K value of 9 or 10 would be best.
The original studies that led to measures such as NNI are no longer considered to be representative. Laboratory studies cannot predict absolute annoyance because they do not reproduce the complete realistic long term experience of living in a home exposed to aircraft noise. It is unlikely that field studies can be accurate enough to precisely define an optimum value of K. Thus, the practical solution is to use a K value of 10 because it is within the range of possible optimum values and because the simplicity of the equal energy approach is so appealing.
This lack of precise knowledge as to the correct value of K is important because of the expected changes in operations at Canadian airports over the next few years. Both the average noise levels of aircraft and the numbers of operations are expected to change. With the introduction of quieter Chapter 3 aircraft, average aircraft noise levels will be reduced. However, the expected increase in the numbers of operations will
resulting combination of reduced aircraft noise levels and increased numbers of operations is acceptable will depend on the true nature of the trade-off between the number of events and aircraft noise levels. With currently available knowledge, we can only use the equal energy
approach (K = 10) with the expectation that it is sufficiently close to the way people react to aircraft noise.
3.2 EPNL Metric (See also Section 4.1[1])
The human hearing system is not equally sensitive to all frequencies of sound. When rating sounds that are a mix of various frequencies, it is therefore necessary to weight the relative importance of the different frequency components of the sounds. This has been done by calculation schemes as well as by electronic frequency weighting networks. The various schemes have been designed to approximate one of the sets of equal perception contours which can be thought of as the frequency response of our hearing system.
The system of equal loudness contours can be used to rate the loudness of single frequency sounds[7]. More complex systems have been developed by Stevens[8,9] and Zwicker[10] to determine the loudness of sounds that include a mixture of different frequencies. These loudness schemes require relatively complicated calculations from the individual 1/3 octave sound levels to determine the overall loudness of the sound.
Kryter[11] devised a similar system for rating the ‘noisiness’ of complex sounds. This is based on a set of equal noisiness contours that are quite similar to equal loudness contours. From the 1/3 octave levels and the equal noisiness contours, the noisiness of each band is determined, and from these the overall Perceived Noise Level, PNL, is calculated. Critics have suggested that for every adjective describing sound there could be further sets of equal perception contours. For example would equal annoyance contours be similar to equal noisiness contours?
Tone corrections are usually added to Perceived Noise Levels to account for the expected additional annoyance of sounds with strong pure tone components. The addition of the pure tone corrections adds further complexity to the calculated noise measures.
A simpler approach to the frequency weighting of sounds is to use a simple frequency weighting network to electronically filter sounds. The oldest of these weighting networks is the A-weighting which dates from the 1930’s and is intended to be an approximation to an equal loudness contour. The D- and E-weightings were intended to approximate equal noisiness contours. In current practice, the A-weighting is almost
universally used as a simple single number rating of all types of sounds and the other weighting networks are rarely used.
The major difference between the calculation schemes and weighting networks is that the shapes of weighting networks do not vary with sound level. The equal loudness and equal noisiness contours are not parallel, but get closer together at lower frequencies. This more correctly approximates the response of the hearing system and represents the changing frequency response of the hearing system with changing sound level. Ignoring this changing response with sound level is one reason why weighting networks are less accurate predictors of negative responses to sounds.
The relative merits of the various frequency weighting networks and calculation schemes have been considered in a number of studies. The Perceived Noise Level, calculated from equal noisiness contours, is a more complex procedure specifically developed to evaluate the noisiness of aircraft sounds. It is usually found to more accurately predict negative responses to aircraft noise. On the other hand, frequency weighting networks are much simpler to use, but provide less accurate ratings of expected negative responses. For the relative rating of groups of sounds with similar spectra and similar sound levels, the simpler frequency weighting networks should be most successful.
There is still some uncertainty as to which measure is the most accurate predictor of responses in general, and in particular of responses to
aircraft noises. The results of various studies suggest that Perceived Noise Levels are a little more accurate than A-weighted levels, but that tone corrections do not improve the prediction of subjective responses. It is not clear that this small improvement in prediction accuracy, relative to A-weighted levels, is of practical importance, or whether it is worth the added complexity of calculating Perceived Noise Levels.
It is interesting to note that A-weighted and Perceived Noise Levels of Chapter 3 aircraft were found to be related to each other with a standard deviation of only 1.6 dB[12]. Thus, if one limited the question to the consideration of modern civil jet aircraft, the similarity of the noise spectra would probably lead to smaller differences in prediction accuracy between the various frequency weighting schemes.
For the precise certification of aircraft, it is arguable that the extra accuracy of the Perceived Noise Level frequency weighting system is justified, although tone corrections should probably not be included. For the rating of noise levels in areas near airports, integrated A-weighted noise levels are thought to be sufficiently accurate. The difference in
prediction accuracy between A-weighted levels and Perceived Noise Levels is less than 0.5 dB and only about 0.3 dB for tone corrected PNL values. This error is much smaller than the accuracy of predicting noise levels around airports and quite tiny compared to the errors in predicting the expected annoyance of residents near airports. The magnitude of the error may be an over-estimate in that if only modern jet aircraft noises were considered, the differences in prediction accuracy would be expected to be smaller.
3.3 Night-Time Weightings (See also Section 4.3[1])
It has generally been assumed that noises during the evening and night-time hours are more disturbing and annoying than those during the day time. There is a long history of the addition of arbitrary time-of-day weightings to aircraft noise measures (see also Chapter 2). Although some early measures used a 5 dB night-time weighting, a 10 dB weighting has most commonly been used. Some measures have also incorporated a separate evening weighting that has most commonly been 5 dB. By arbitrarily assuming that the integrated exposure over the nine night-time hours should be 10 dB greater than the integrated exposure over the 15 day-time hours, the NEF measure obtained a 12.2 dB night-time weighting. None of these night-time-of-day weightings was derived from a rigorous scientific study of subjective responses to noise.
The existing time-of-day weightings are simply a consensus of various “common sense” type arguments from groups responsible for the development of the various noise measures. For example, lower noise levels are assumed to be required at night because sleep is more sensitive to disturbance by noise than most day-time activities. While some have challenged these “common sense” type arguments, the evidence in the literature is not conclusive.
The results of surveys are limited by the input data. In particular, at almost all locations night-time noise levels are highly correlated with day-time noise levels. That is, sites that are more noisy during the day time are usually more noisy at night too. At the same time responses are usually only weakly correlated with noise measures. Thus, it has not been possible to accurately determine the combination of day and night-time noise levels that best predicts subjective responses.
Various practical and “common sense” arguments suggest that some time-of-day weightings are necessary. Existing survey results tend to confirm that some form of time-of-day weighting is required. As a result of a major Australian study, the NEF measure was modified there to include an evening weighting and a reduced night-time weighting[13].
Several other studies have suggested that an evening weighting is more important than a night-time weighting. The tentative support for an additional evening weighting and lower night-time weightings are counter to the NEF measure which incorporates the largest night-time weighting in common use.
3.4 Forecasting the Number, Type, and Mix of Aircraft (See also Chapter 3[12]).
In order to predict future aircraft noise levels, it is first necessary to predict the details of future aircraft operations. It is necessary to know: the total number of aircraft operations, the number of operations for each aircraft type, the portion of the operations that are during the night-time hours, the stage length of each departing flight, the runway use, and the flight paths to be followed. Errors in each of these input variables will influence the resulting NEF values and the contour areas. In some cases, the average NEF values will change, while in others there may be larger local effects where there are increases in some locations and decreases at others. The magnitude of the various possible errors were examined in detail in Chapters 3 and 5 of reference [12].
Transport Canada’s Air Statistics and Forecast group forecast expected future total operations at major airports. In analyzing the accuracy of their predictions they found an average error of 11% over a ten-year period and up to a 21% error in a single year. These estimates were averages for Canada’s top 77 airports[14]. At individual airports, larger errors in the predicted total number of operations could occur.
Transport Canada calculates NEF values for the number of operations occurring on a Peak Planning Day (PPD) that is approximately a 95th percentile day. Further errors are incurred estimating the number of operations for future PPD’s from expected future total operations. Values for the number of operations for a PPD are approximated by determining the number of operations for the seven busiest days of the three busiest months. These estimates of the number of operations per PPD from several years of data at a particular airport are extrapolated to predict future values of the number of operations per PPD. This was found to be an inaccurate cumbersome procedure prone to errors[12]. Standard errors of up to 40 operations per day were found. By combining a number of years of data from several airports, a single equation was derived that more simply and more reliably predicts the number of operations for a future PPD.
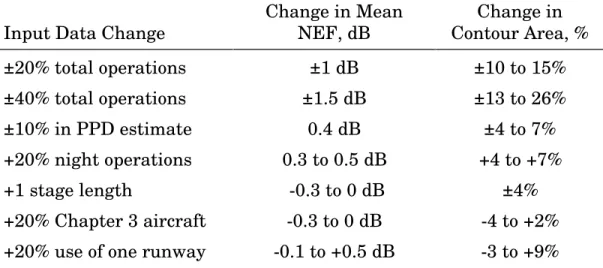
The effect of various errors in the input data were determined using the NEF_1.7 program[12] and are summarized in Table 3.1. The average
changes in NEF values within each NEF contour for three quite different airports were assessed and Table 3.1 gives the range of changes that were found. Errors in the total number of operations have the largest effect. One dB changes in NEF values and 10 to 15% changes in contour areas are quite likely to occur as a results of errors in the estimated total number of operations. The current procedures for predicting the number of operations for future PPD’s could lead to further errors corresponding to as much as 0.4 dB in average NEF values and 4 to 7% in contour areas. Because these two sources of error could be multiplicative, the total error in the estimated number of operations for a future PPD could be larger. It seems unlikely that the combination of these two errors would exceed a 40% error in the predicted total number of operations corresponding to an average error of 1.5 dB in NEF values and 13 to 26% in contour areas.
Input Data Change
Change in Mean NEF, dB Change in Contour Area, % ±20% total operations ±1 dB ±10 to 15% ±40% total operations ±1.5 dB ±13 to 26% ±10% in PPD estimate 0.4 dB ±4 to 7% +20% night operations 0.3 to 0.5 dB +4 to +7% +1 stage length -0.3 to 0 dB ±4% +20% Chapter 3 aircraft -0.3 to 0 dB -4 to +2% +20% use of one runway -0.1 to +0.5 dB -3 to +9%
Table 3.1. Summary of expected errors in NEF values and contour areas for various changes in the input data.
Changes in the other input data included in Table 3.1 tend to produce smaller average changes in NEF values but sometimes larger local effects. Typically, average NEF values changed by up to 0.5 dB and contour areas by 4 to 7%. Errors in each of these other input variables would usually be independent of each other. Thus, several errors are not likely to all add in the same direction. However, at particular locations errors in expected runway use and aircraft stage length moved the contours by up to 1500 feet (460 m) and changed particular NEF values by up to 1.5 dB.
As a typical worst case, errors of up to 2 dB in average NEF values and up to 30% in contour areas seem quite possible.
3.5 The NEF_1.7 Program (see also [12], particularly Chapters 3 and 5)
The NEF_1.7 program is the primary tool for managing aircraft noise near Canadian airports. It is used to manage the use of land that is worth many millions of dollars. Therefore, it is essential that this program be as technically accurate and efficient to use as possible. However, its archaic user-interface makes it cumbersome to use, and its accuracy has not been adequately verified. Neither its algorithms nor its accuracy are well documented, and more support is required to continue the development of this essential tool.
(a) Technical Accuracy
The excess ground attenuation routines included in the NEF_1.7 program are thought to lead to overestimation of NEF contour areas. Extensive experimental studies of the propagation of aircraft noise are required to develop and validate improved algorithms for excess ground attenuation. Flight paths are not modeled in enough detail to accurately represent actual conditions. The numbers of segments of the horizontal flight track and the vertical take-off profile are too limited. The normal dispersion of aircraft about the nominal flight track is not included in the NEF_1.7 program.
The algorithms on which the program is based are not documented. They should be fully documented so that the validity of the current program can be better assessed and so that improvements can be more easily made.
Some European groups are developing much more sophisticated simulation type aircraft noise models that more precisely model the movement of aircraft and the propagation of sound from them. Work is proceeding to include the effects of the directionality of each aircraft type, irregular terrain, and meteorological effects.
There is a real danger that the NEF_1.7 program may soon become technically obsolete.
(b) Efficiency of Use
The NEF_1.7 program has an archaic user interface that seems to be the result of a quick conversion from the original main frame version that included card input. Use of the program is unnecessarily cumbersome and time consuming. The program would benefit from a smart front end that would help the user with data entry.
The input aircraft noise data are not included in external files, but are combined with the compiled program. Thus, the user has no access to this data and cannot easily add revised aircraft noise data.
The program does not include sufficiently refined contour plotting routines. Such routines should be included and should plot to modern printers such as postscript laser printers.
In the United States, new versions of the INM program have been announced that will include a more sophisticated user interface and the ability to combine contours with other graphical information.
(c) Support
Although Transport Canada have done their best to maintain the NEF_1.7 program, more support is required for the maintenance and development of this software. The technical basis of the calculations, the user interface, and the range of features that the program includes need ongoing maintenance and development. This is not a question of a one-off fix up, but a need for a major change in philosophy and a recognition of the importance of this computer program.
As one small example of the current problems, an experimental version of the program was found to run many times faster than the standard
version. This same considerable speed increase could be available to all users if enhanced support for this software were available.
Areas requiring full-time support and some example activities are: (1) technical development of the program: Excess ground
attenuation routines being developed in various countries need to be evaluated and an improved algorithm needs to be incorporated in the NEF_1.7 program.
(2) software development: The user interface, the speed and efficiency of the program need to be upgraded to meet the standards of modern commercial software and to match the capabilities of current computer hardware.
(3) technical support for users: Those developing the software
should be available to provide assistance for users of the software to ensure that results are correct and are efficiently obtained. (4) new developments: The process of estimating the number of
operations for future PPD’s could be completely automated. This would require procedures to acquire the operational statistics
electronically and software to estimate operations for future PPD’s.
(5) verification: The accuracy of the current program and all future modifications must be experimentally validated.
3.6 Comparisons with Other Approaches (See also Chapter 6[1])
Almost every country with major airports uses a different aircraft noise measure to manage noise problems in areas around their airports. Although these different noise measures look very different, they all combine the noise levels of individual aircraft and the number of noise events to get an overall integrated measure of aircraft noise. Many of these measures were compared in detail in a previous report[12] and procedures were developed to convert from NEF and Ldn values to each of
the other measures.
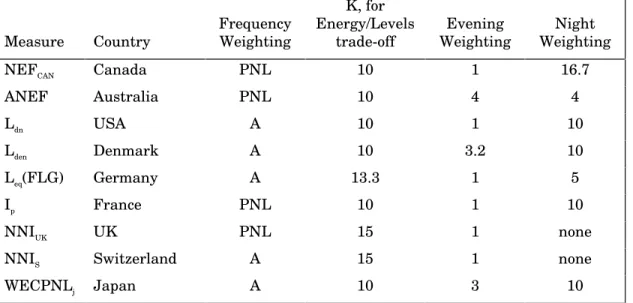
There are only three basic elements that differ between the various aircraft noise measures. These are:
• the frequency weighting of sounds,
• the levels versus number of events trade-off, and
• time-of-day weightings. Measure Country Frequency Weighting K, for Energy/Levels trade-off Evening Weighting Night Weighting
NEFCAN Canada PNL 10 1 16.7
ANEF Australia PNL 10 4 4 Ldn USA A 10 1 10 Lden Denmark A 10 3.2 10 Leq(FLG) Germany A 13.3 1 5 Ip France PNL 10 1 10 NNIUK UK PNL 15 1 none
NNIS Switzerland A 15 1 none
WECPNLj Japan A 10 3 10
Table 3.2. Summary of principal components of aircraft noise measures used in various countries.
Table 3.2 summarizes how each of these basic components vary among nine different aircraft noise measures.
(a) Frequency Weighting
The frequency weighting of the aircraft noises are either A-weighted or PNL-weighted. No other frequency weightings are in common use. The United Kingdom has recently stopped using the NNIUK measure that
included a PNL weighting. This leaves only Canada, Australia, and France that use aircraft noise measures that include PNL weighted levels. Japan and Switzerland use approximate A-weighted equivalents to PNL levels in their aircraft noise measures. For modern Chapter 3 aircraft, A-weighted and PNL weighted noise levels are very closely related, with a standard error of only 1.6 dB[12]. A major drawback of using PNL-weighted aircraft noise measures is that it is very difficult to measure PNL-weighted levels and hence it is very expensive to validate NEF calculations with measurements.
(b) Levels Versus Number of Events Trade-off
Table 3.2 lists values of the K parameter from expression 3.1. A value of 10 corresponds to an equal energy trade-off. That is, when K = 10, the influence of levels and number of events are summed according to the total noise energy. Most of the noise measures listed in Table 3.2 use an energy summation approach with a K value of 10. As mentioned above, the NNIUK measure is no longer used. Although the Swiss still use an
NNIS measure with K = 15, their own data suggests that an energy summation approach would be better. The value of K = 13.3 continues to be used in the German noise measure because it is fixed in legislation rather than because of a strong technical argument.
(c) Time-of-day Weightings
The time-of-day weightings shown in Table 3.2 are the equivalent linear weightings and not weightings in decibels. The 16.7 used in the NEF measure is the largest night-time weighting in common use. There were no sound technical arguments for this weighting when it was introduced and it has never been supported by studies of subjective responses to aircraft noise. A night-time weighting of 10 is commonly used and some jurisdictions also include an evening weighting of about 3. These are based more on pragmatic arguments than on the results of scientific evaluations of responses to aircraft noise. Only the Australian time-of-day weightings were the result of an extensive community noise study. The Australian survey and other published studies suggest the need for a substantial evening weighting and reduced night-time weightings.
REFERENCES
1. Bradley, J.S., "NEF Validation Study: (2) Review of Aircraft Noise and Its Effects", NRC Contract Report to Transport Canada, A1505.5 (1994).
2. Rice, C.G., "Trade-Off Effects of Aircraft Noise and Number of Events", Proceedings of Third International Congress on Noise as a Public Health Problem, Freiburg, pp. 495-510 (1978), (ASHA Report No. 10 (1980)).
3. Rylander, R., Björkman, M., Ahrlin, U., "Aircraft Noise Annoyance Contours: Importance of Overflight Frequency and Noise Level", J. Sound Vibr., Vol. 69, No. 4, pp. 583-595 (1980).
4. Fields, J.M., "The Effect Of Numbers of Noise Events on People's Reaction to Noise: An Analysis of Existing Survey Data", J. Acoust. Soc. Am., Vol. 75, No. 2, pp. 447-467 (1984).
5. Anon, "Sozio-psychologische Fluglärmuntersuchung in Gebiet der drei Schweizer Flughäfen: Zurich, Geneva, and Basel", Argbeitsgemeinshaft für sozio-psychologische Fluglärmuntersuchung, Bern (June 1973).
6. Brooker, P., Critchley, J.B., Monkman, D.J., and Richmond. C., "United Kingdom Noise Index Study: Main Report", DR Report 8402, Civil Aviation Authority, London (January 1985).
7. International Standards Organization, "Normal Equal-loudness Contours for Pure Tones and Normal Threshold of Hearing Under Free Field Listening Conditions", Recommendation R 226 (1961).
8. Stevens, S.S., "Procedures for Calculating Loudness: Mark VI", J. Acoust. Soc. Am., Vol. 33, No. 11, pp. 1577-1585 (1961).
9. Stevens, S.S., "Perceived Level of Noise by Mark VII and Decibels (E)", J. Acoust. Soc. Am., Vol. 51, No. 2, pp. 575-601 (1972).
10. Zwicker, E., "Ein Verfahren zur Berechnung der Lautstarke", Acustica, Vol. 10, No. 1, pp. 304-308 (1960).
11. Kryter, .D., "Scaling Human Reactions to the Sound from Aircraft", J. Acoust. Soc. Am., Vol. 31, No. 11, pp. 1415-1429 (1959).
12. Bradley, J.S., "NEF Validation Study: (1) Issues Related to the Calculation of Airport Noise Contours", NRC Contract Report to Transport Canada, A1505.3 (1993).
13. Bullen R.B., and Hede, A.J., "Time of Day Corrections in Measures of Aircraft Noise Exposure", J. Acoust. Soc. A., Vol. 73, No. 5, pp. 1624-1630 (1983).
14. Anon, "Transport Canada Aviation Forecasts, 1990-2003", Transport Canada Report TP 7960 (1990).