13
C-Metabolic Flux Analysis of Recombinant Yeasts
for Biofuels Applications
by
Thomas M. Wasylenko
B.S.E. Chemical Engineering, Princeton University, 2008
ARCHVES
MASSACHUSETTS INSTITUTEOF TECHNOLOLGY
JUN 22 2015
LIBRARIES
SUBMITTED TO THE DEPARTMENT OF CHEMICAL ENGINEERING IN PARTIAL FULFILLMENT OF THE REQUIREMENTS FOR THE DEGREE OF
DOCTOR OF PHILOSOPHY IN CHEMICAL ENGINEERING AT THE
MASSACHUSETTS INSTITUTE OF TECHNOLOGY JUNE 2015
C 2015 Massachusetts Institute of Technology. All rights reserved.
Signature redacted
S ign ature o f auth or ...
Department of Chemical Engineering March 13, 2015
Signature redacted
Ce tfe y... .,. . ... ... .I u s/Grego Stephanopoulos Willard Henry Dow Professor Of Chemical Engineering and Biotechnology Thesis Supervisor
Signature redactedf
Accepted by... . .... ... 4Richard rz Edwin R. Gilliland Professor of Chemical Engineering
13
C-Metabolic Flux Analysis of Recombinant Yeasts
for Biofuels Applications
by
Thomas M. Wasylenko
Submitted to the Department of Chemical Engineering on March 13, 2015 in partial fulfillment of the
requirements for the degree of
Doctor of Philosophy in Chemical Engineering
Abstract
Fossil fuels have powered the transportation industry since the Industrial Revolution. However, rising transportation energy demand and new knowledge about the environmental impact of burning fossil fuels have motivated the development of technologies for sustainable production
of renewable, carbon-neutral liquid fuels. To that end, biological systems may be leveraged to fix carbon dioxide and to catalyze the conversion of renewable feed stocks to fuel molecules. Today, the gasoline additive ethanol and biodiesel are produced by yeast fermentation of sugars derived from cornstarch and sucrose and transesterification of vegetable oils, respectively. However ethanol has many drawbacks as a fuel additive, and both biofuels are currently produced from edible feed stocks. For biofuels to contribute significantly to meeting total transportation energy demand, processes for production of fuel molecules from non-food feed stocks must be engineered. Two promising solutions are fermentation of sugars derived from "woody," lignocellulosic biomass and production of fuels from volatile fatty acids (VFAs) such as acetate, which can be produced by fermentation of organics in municipal solid waste and sewage or syngas. The production of biofuels from lignocellulosic material or VFAs will require metabolic engineering of biocatalysts to improve yields, productivities, and final titers. These metabolic engineering efforts can be facilitated by 3C-Metabolic Flux Analysis (MFA), a method for elucidating the otherwise unobservable intracellular metabolic fluxes in biological systems.
We first developed protocols for extraction and LC-MS/MS analysis of intracellular metabolites, which provides data that may be used for metabolic flux estimation. We then performed an analysis of both the measurement and modeling errors associated with using these data for flux determination. Finally, we applied 13C-MFA to two industrially relevant systems: 1) Fermentation of xylose, a sugar present in lignocellulosic biomass, to ethanol in Saccharomyces
cerevisiae, and 2) overproduction of fatty acids that may be transesterified to biodiesel from
either glucose or acetate in the oleaginous yeast Yarrowia lipolytica. These experiments identified a potential bottleneck in xylose fermentation in S. cerevisiae and the primary source of NADPH for fatty acid biosynthesis in Y. lipolytica, and also suggested potential strategies for
Thesis Supervisor: Gregory Stephanopoulos
Acknowledgments
Graduate school has been a long journey, and I'd like to thank the many, many people who have helped me along the way. My thesis advisor Prof. Gregory Stephanopoulos has provided me with ample resources and, just as importantly, a great deal of freedom to use them as I have seen fit and grow as a researcher. I am inherently a detail-oriented person, and Greg's tremendous vision has helped me learn to see the "big picture" and understand the motivation for my work. Finally his enthusiasm is unmatched; I can honestly say that every time I have had an individual meeting with Greg, I have come out more excited about my research than I was when I went in. I am also grateful to those who have served on my thesis committee-Gerry Fink, Joanne Kelleher, Narendra Maheshri, and Kris Prather-for their support, encouragement, and helpful questions and suggestions.
I thank Rosangela dos Santos for her administrative assistance, which keeps the Stephanopoulos lab running smoothly, has simplified my life (and those of everyone else in the lab) considerably, and allows us to devote more time and attention to our research.
The Stephanopoulos Lab is a large lab with high turnover, and consequently I have had the privilege to interact with many talented individuals who have made the lab a fun and exciting place. Curt Fischer trained me when I first joined the lab. Jason Walther introduced me to the metranCL flux estimation software and showed me the basics of intracellular metabolite extractions. Takashi Yamamoto worked with me to set up the Liquid Chromatography-Tandem Mass Spectrometry (LC-MS/MS) system for measurement of phosphorylated metabolites.
Working with Takashi, an experienced researcher, early in my graduate school career was a great opportunity which allowed me to learn first-hand how to conduct good research. Hang Zhou developed the xylose-consuming Saccharomyces cerevisiae strain characterized in Chapter 5 and taught me about that strain and about techniques for working with yeast. Simon Carlsen helped me with yeast molecular biology. Sarah Fendt and Marjan de Mey taught me about using 13
C-labeled metabolite extracts as internal standard to greatly improve the precision of my metabolite pool size measurements. Hamid Rismani-Yazdi and Brian Pereira helped me when I was struggling with culturing S. cerevisiae anaerobically. KJ Qiao and Andy Silverman showed me the ropes when I transitioned to working with Yarrowia lipolytica. I had the pleasure of working with Woo Suk Ahn and Moritz Wolf on Y. lipolytica flux estimation, described in Chapters 6 and 7. Each directly generated data that were used in this thesis. Mark Keibler shared with me a Flux Balance Analysis code he had written, which I used for the analysis of Y. lipolytica acetate metabolism in Chapter 7. The technical expertise of all of these people (and their willingness to share it) saved me countless hours and a great deal of frustration. Each one of them truly contributed to making this thesis what it is.
I also want to thank the people who made my time in the Stephanopoulos lab enjoyable, even if they didn't contribute directly to my research. Brian Pereira and Haoran Zhang were my
"mentors" who helped me cope with the ups and downs of grad school. I could always count on Haoran to help me out in a pinch, and I lost track of how many Legal Seafoods dinners I owe him long ago. Vikram Yadav was my bay-mate early on, and we had good times, spirited debates, and some very competitive games of lab mini-golf. It was always a pleasure talking to
Adel Ghaderi, and I learned a great deal about science, philosophy, and many things in between in discussions with him. Mark Keibler and Sagar Chakraborty often kept me company late into the night during my 24-hour time courses, and Mark always kept me up-to-date on the latest in cancer metabolism and obscure news. It has been a pleasure to watch Steven Edgar, Ben Woolston, Zhe Zhang, David Emerson, and Alkis Chatzivasileiou grow as scientists, and although I am leaving the lab I look forward to seeing the great papers I know they will publish. I shared a lot of fun times with my Davis Square roommates Andrew Hilmer and Nate Vacanti (and Andrew's now-wife Jingqing) and my lunch crew Caroline Ahrens, Rose Kanasty, Yuko Kida, Micah Sheppard, and Nate. They also commiserated with me during the inevitable lows of research and helped me to keep things in perspective.
I thank my parents Michael and Lydia Wasylenko for their unconditional love, guidance, and support which made it possible for me to get to and get through MIT, and my "golden ticket," my wife Theresa, for putting up with my probably insufferable ego during the highs and my definitely insufferable moodiness and complaining during the (much more common) lows. I cannot imagine the last four years without her.
When I think about all those who have helped me during my time at MIT, I believe it is truly a miracle that I have had so many wonderful people come into my life in such a short time. And so finally, I thank God, who has sustained me over the past six-plus years. Scripture assures me that all He has created is good (Gen 1:31). Even Yarrowia.
Contents
1 Introduction 20
1.1 The Need for New Biofuel Technologies... 20
1.1.1 Lignocellulosic Feed Stocks... 21
1.1.2 Alternative Fuel Molecules... 23
1.2 13C-Metabolic Flux Analysis... 25
1.3 1C-MFA Mathematical Formulation... 28
1.4 Thesis Overview: 1 3C-MFA of Recombinant Yeasts for Biofuels Applications... 32
1.5 R eferences... . . 33
2 Methods for Metabolite Extraction and LC-MS/MS Analysis 41 2 .1 Introdu ction ... 4 1 2.2 Materials and Methods... 46
2.2.1 Optimization of Compound Parameters... 46
2.2.2 Optimization of Source/Gas Parameters... 46
2.2.3 Liquid Chromatography-Tandem Mass Spectrometry... 47
2.2.4 Strain and Culture Conditions... 49
2.2.5 Comparison of Quenching Methods... 50
2.2.6 Comparison of Metabolite Extraction Protocols with GC-MS... 51
2.2.6.1 Hot Ethanol Extraction... 51
2.2.6.2 Chloroform-Methanol-Water Extraction... 51
2.2.7 Comparison of Hot Ethanol and Chloroform-Methanol-Water Extraction
Protocols with LC-MS/MS... 53
2.2.8 Measurement of Mass Isotopomer Distributions (MIDs) of Metabolites Labeled to Natural Abundance... 53
2.2.9 Validation of Protocols by Measurement of Metabolite Ratios... 54
2.2.10 Gas Chromatography-Mass Spectrometry (GC-MS) Analysis of TMS D erivatives... 54
2.2.11 Gas Chromatography-Mass Spectrometry (GC-MS) Analysis of TBDMS D erivatives... 55
2.3 Results and Discussion... 55
2.3.1 Optimization of Compound Parameters... 55
2.3.2 Optimization of Source/Gas Parameters... 58
2.3.3 Liquid Chromatography-Tandem Mass Spectrometry... 62
2.3.4 Comparison of Quenching Methods... 63
2.3.5 Comparison of Metabolite Extraction Protocols with GC-MS... 67
2.3.6 Comparison of Hot Ethanol and Chloroform-Methanol-Water Extraction Protocols with LC-MS/MS... 70
2.3.7 Measurement of Mass Isotopomer Distributions (MIDs) of Metabolites Labeled to Natural Abundance... 72
2.3.8 Validation of Quenching and Extraction Protocols by Measurement of M etabolite R atios... 73
2 .4 C on clu sion s... 75
3 Modeling of Propagation of Error in Mass Spectrometry Mass Isotopomer
Distribution Data 80
3.1 Introduction ... 80
3.2 E rror M odel... 83
3.3 M aterials and M ethods... 87
3.3.1 Simulation of Noisy MS Labeling Data... 87
3.3.2 Strain and Culture Conditions... 88
3.3.3 Protein H ydrolysis... 88
3.3.4 Gas Chromatography/Mass Spectrometry (GC-MS)... 89
3 .4 R esu lts... . . 89
3.4.1 Simulation of Noisy MS Labeling Data... 89
3.4.2 Analysis of E. coli Protein Hydrolysates by GC-MS... 95
3.5 D iscussion ... 97
3 .6 R eferen ces... 100
4 Kinetic Isotope Effects Significantly Influence Intracellular Metabolite 13C Labeling Patterns and Flux Determination 103 4 .1 Introduction ... 103
4.2 Modeling Isotopic Fractionation at the Pyruvate Node... 104
4 .3 R esu lts... 1 16 4 .4 D iscu ssion ... 122
5 Metabolomic and 13C-Metabolic Flux Analysis of a Xylose-Consuming Saccharomyces
cerevisiae Strain Expressing Xylose Isomerase 131
5.1 Introdu ction ... 13 1
5.2 M aterials and M ethods... 135
5.2.1 Strain and Culture Conditions... 135
5.2.2 A nalytical M ethods... 136
5.2.3 Determination of Optical Density-Dry Cell Weight Correlations... 137
5.2.4 Estimation of Extracellular Fluxes...137
5.2.5 Preparation of Uniformly 13C-Labeled Cell Extract for Internal S tan d ard ... 13 9 5.2.6 Metabolite Extractions for Pool Size Measurements and 13C-Metabolic F lux A nalysis... 139
5.2.7 Gas Chromatography/Mass Spectrometry (GC-MS)...140
5.2.8 Liquid Chromatography/Tandem Mass Spectrometry (LC-MS/MS)... 141
5.2.9 Quantification of Metabolite Pool Sizes... 141
5.2.10 Metabolic Flux Estimation... 142
5.3 R esults and D iscussion... 144
5.3.1 Determination of Optical Density-Dry Cell Weight Correlations... 144
5.3.2 Estimation of Extracellular Fluxes...145
5.3.3 Metabolite Pool Size Measurements and Metabolic Flux Estimation... 147
5.3.4 Pentose Phosphate Pathway... 154
5.3 .5 G lycolysis... 155
5.3.7 Incomplete Activation of Fermentation Program... 157
5.3.8 Lower Glycolysis as a Potential Bottleneck in Xylose Metabolism... 161
5 .4 R eferen ces... 165
6 The Oxidative Pentose Phosphate Pathway is the Primary Source of NADPH for Lipid Overproduction from Glucose in Yarrowia lipolytica 180 6 .1 Introdu ction ... 180
6.2 M aterial and M ethods... 185
6.2.1 Strains and Culture Conditions... 185
6.2.2 Extracellular Metabolite Quantification... 186
6.2.3 Dry Cell Weight Measurements...187
6.2.4 L ipid A nalysis... 187
6.2.5 Estimation of Extracellular Fluxes...188
6.2.6 Metabolite Extractions... 189
6.2.7 Gas Chromatography-Mass Spectrometry (GC-MS) Analysis of Metabolite E x tracts... 19 0 6.2.8 Liquid Chromatography-Tandem Mass Spectrometry (LC-MS/MS)...191
6.2.9 Gas Chromatography-Mass Spectrometry (GC-MS) Analysis of G lu co se ... 19 1 6.2.10 Metabolic Flux Estimation...192
6 .3 R esu lts...194
6.3.1 Fermentation Profiles and Establishment of Metabolic Steady State... 194
6.3.3 Metabolic Flux Estimation...200
6 .4 D iscu ssion ... 2 0 7 6.5 R eferences...2 10 7 1C-Metabolic Flux Analysis and Flux Balance Analysis of Lipid Production from Acetate in Yarrowia lipolytica 220 7.1 Introduction ... 220
7.2 Materials and Methods... 222
7.2.1 Strain and Culture Conditions...222
7.2.2 Extracellular Metabolite Quantification... 223
7.2.3 Dry Cell Weight Measurements...223
7.2.4 Analytical Methods...223
7.2.5 Estimation of Extracellular Fluxes...223
7.2.6 Metabolic Flux Estimation...224
7.2.7 Flux Balance Analysis... 225
7.3 R esults and D iscussion... 226
7.3.1 Fermentation Profiles and Metabolic Steady State...226
7.3.2 Estimation of Extracellular Fluxes...229
7.3.3 Metabolic Flux Estimation...229
7.3.4 Flux Balance Analysis... 232
7.3.5 Stoichiometric Analysis of NADPH Production Pathways... 242
7.4 C onclusions... 246 7.5 R eferen ces...24 8
8 Conclusions and Recommendations for Future Work 252 8.1 C onclusion s... 252
8.2 Recommendations for Future Work... 254
8.3 R eferen ces...256
A Saccharomyces cerevisiae Xylose Flux Estimation Details 258
B Yarrowia lipolytica Glucose Flux Estimation Details 286
List of Figures
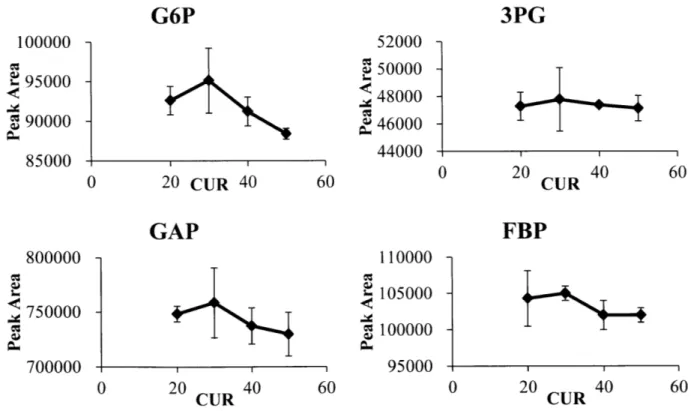
2-1 Curtain Gas (CUR) optim ization... 59
2-2 IonSpray V oltage (IS) optim ization... 60
2-3 Ion Source Gas 1 (GS1) optimization...60
2-4 Ion Source Gas 2 (GS2) optimization...61
2-5 Collision G as (CA D ) optim ization... 61
2-6 Comparison of quenching solutions using the pipetting method for washing pellets... 65
2-7 Comparison of methods for washing cell pellets with pure methanol quenching solution ... . ... 66
2-8 Comparison of extraction protocols by GC-MS with TBDMS derivatives... 68
2-9 Comparison of extraction protocols by GC-MS with TMS derivatives... 69
2-10 Comparison of hot ethanol and chloroform-methanol-water extraction protocols by L C -M S /M S ... 7 1 2-11 Validation of LC-MS/MS method for measuring metabolite labeling patterns... 73
3-1 Results of Monte Carlo simulations used to validate MS data error model in the case of proportional error only in ion counts (a1 = 0, a2 = 0.01, N = 3)... 91
3-2 Results of Monte Carlo simulations used to validate MS data error model in the case of constant error only in ion counts (a1 = 0.003, a2 = 0, N = 3)... 92
3-3 Results of Monte Carlo simulations used to validate MS data error model in the case of both proportional and constant errors in ion counts (a1 = 0.003, a2 = 0.01, N = 3)... 92
3-4 Results of Monte Carlo simulations used to validate MS data error model with double proportional error only in ion counts (a1 = 0, a2 = 0.02, N = 3)... 93
3-5 Results of Monte Carlo simulations used to validate MS data error model with double
constant error only in ion counts (a1 = 0.006, a2 = 0, N = 3)... 93
3-6 Results of Monte Carlo simulations used to validate MS data error model with double proportional and constant errors in ion counts (a1 = 0.006, a2 = 0.02, N = 3)... 94
3-7 Results of Monte Carlo simulations used to validate MS data error model in the case of proportional error only in ion counts (a, = 0, a2 = 0.01, N = 6)... 94
3-8 Results of Monte Carlo simulations used to validate MS data error model in the case of constant error only in ion counts (a1 = 0.003, a2 = 0, N = 6)... 95
3-9 GC-MS measurement errors in MID mole fractions of proteinogenic amino acids labeled to natural abundance... 96
4-1 The pyruvate node m odel system ... 106
4-2 Typical results for errors associated with neglecting isotope effects as a function of
f.
117 4-3 Expected errors associated with isotope effects at low values off...121
5-1 DCW vs. OD600 for each set of culture conditions... 145
5-2 Metabolite pool sizes for metabolites in Glycolysis and the PPP...148
5-3 Metabolite pool sizes for metabolites in the TCA Cycle...149
5-4 Metabolite pool sizes and ratios for select cofactors... 150
5-5 Best-fit metabolic flux distributions in xylose-consuming S. cerevisiae strain under four sets of conditions... 15 1 5-6 Weighted Sums of Squared Residuals from flux estimations with different models... 152
5-7 Confidence intervals for select fluxes...153
6-1 Cycle for shuttling acetyl-CoA from the mitochondria to the cytosol for fatty acid sy n th esis...184
6-2 Extracellular metabolite fermentation profiles... 197
6-3 Fatty acid fermentation profiles... 198
6-4 Final fatty acid distribution profiles...199
6-5 Estimated metabolic flux distributions... 203
6-6 Select flux confidence intervals... 205
6-7 Mass isotopomer distributions (MIDs) of illustrative metabolites from the 1,2- C2 -glucose labeling experim ent... 206
7-1 Extracellular metabolite fermentation profiles... 227
7-2 Fatty acid fermentation profiles... 228
7-3 Final fatty acid distribution profile... 228
7-4 Estimated metabolic flux distribution in strain MTYL065 on acetate... 233
7-5 Results of Flux Balance Analysis with base model...237
7-6 Results of Flux Balance Analysis with malic enzyme as only source of NADPH... 238
7-7 Results of Flux Balance Analysis with malic enzyme as only source of NADPH and m alate/oxaloacetate shuttling... 239
7-8 Results of Flux Balance Analysis with addition of cytosolic NADP-dependent isocitrate dehydrogenase... 240
7-9 Results of Flux Balance Analysis with cytosolic NADP-dependent isocitrate dehydrogenase and irreversible mitochondrial NAD-dependent isocitrate dehydrogenase... 24 1 7-10 Maximum theoretical oleate yields as calculated by Flux Balance Analysis under different assumptions about NADPH sources... 242
B-i Linear regressions for Estimation of Extracellular Fluxes: Strain MTYL037, natural abundance glucose culture...287 B-2 Linear regressions for Estimation of Extracellular Fluxes: Strain MTYL037, 20% U-13C
6
-glucose culture... 288 B-3 Linear regressions for Estimation of Extracellular Fluxes: Strain MTYL037, 1,2-
13C2-glucose culture... 289 B-4 Linear regressions for Estimation of Extracellular Fluxes: Strain MTYL065, natural
abundance glucose culture...290
B-5 Linear regressions for Estimation of Extracellular Fluxes: Strain MTYL065, 20% U-13C 6
-glu co se cu lture ... 29 1 B-6 Linear regressions for Estimation of Extracellular Fluxes: Strain MTYL065, 1,2- 13C
2
-glucose culture... 292 C-1 Linear regressions for Estimation of Extracellular Fluxes... 306
List of Tables
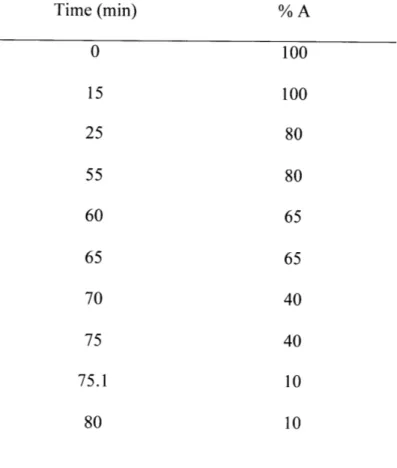
2-1 Solvent gradient for slow LC-MS/MS method... 48
2-2 Solvent gradient for fast LC-MS/MS method...49
2-3 Optimal Metabolite Compound Parameters... 57
2-4 Optimal Source/Gas parameter values... 62
2-5 Typical metabolite retention times (in minutes) for fast and slow HPLC methods... 63
2-6 Measurement of key metabolite ratios for validation of quenching, extraction, and LC-M S/LC-M S m ethods... 75
4-1 Predicted Isotopomer Flux Fractions... 113
5-1 Conversion factors for converting OD60 0 to DCW, kcw ... 144
5-2 Specific growth rates and specific metabolite consumption and production rates under different conditions... 146
6-1 Acetyl-CoA, Glycerol-3-Phosphate, and NADPH requirements for biosynthesis of each of the five principal fatty acids in Y. lipolytica... 189
6-2 Extracellular flux values used for 13C-MFA...200
7-1 Extracellular flux values used for '3C-MFA...229
7-2 A T P balance...23 1 A-1 Model Metabolic Reaction Network for 13C-MFA... 258
A-2 Measured and Simulated Mass Spectrometry Data... 262
A-3 Best-Fit Fluxes and Flux Confidence Intervals... 275
B-i Model Metabolic Reaction Network for 13C-MFA... 293
B-2 Measured and Simulated Mass Spectrometry Data... 295
C-1 Model Metabolic Reaction Network for '3C-MFA... 307
C-2 Measured and Simulated Mass Spectrometry Data... 309
C-3 Best-Fit Fluxes and Flux Confidence Intervals... 313
Chapter 1
Introduction
1.1 The Need for New Biofuel Technologies
Today the global economy relies heavily on fossil fuels to meet demand for transportation energy. However in coming years this demand is expected to increase dramatically due to world population growth and improved standard of living in nations with rapidly growing economies, including China and India. Moreover, the burning of fossil fuels increases the concentration of carbon dioxide in the atmosphere and may contribute to climate change. Consequently, there is great interest in development of technologies for production of liquid fuels from plant biomass. Such technologies could help meet rising demand for transportation fuel and diversify the transportation energy supply to protect against volatility in the market. Moreover, since the carbon in plant biomass is derived from atmospheric carbon dioxide through photosynthesis, biofuels are renewable and can theoretically be "carbon neutral" in so far as the burning of biofuels does not result in a net increase in the amount of carbon dioxide in the atmosphere.
Ethanol is presently the most widely used biofuel, because it can be produced at high yield, productivity, and titer by fermentation of hexose sugars obtained from cornstarch or sucrose (sugarcane). The yield, productivity, and titer metrics are important because they determine the cost of feed stock, the capital costs (i.e. number and size of reactors and other units), and cost of
downstream processing (i.e. separations and purifications) to produce a given amount of ethanol per unit time. However, there are two major drawbacks associated with these "first generation" processes for bioethanol production. The first is that corn and sugarcane are important food crops. Consequently they are relatively expensive feed stocks and represent a major fraction of the total cost of ethanol production. The high feed stock price makes it difficult for first generation bioethanol to be economically competitive with fossil fuels. Moreover arable land is a finite resource, and the use of food crops for fuel production could potentially compete with the food supply and drive up food prices. The second major drawback is that ethanol itself is not an ideal fuel moleculc. Ethanol has relatively low energy density and is hygroscopic. The consequences are that ethanol-gasoline blends have inferior fuel economy and can absorb water, which can result in phase separation of the fuel. Phase separation leads to a whole host of problems in the existing fuel infrastructure, as does ethanol's corrosive nature. Thus, broadly speaking there are (at least) two major challenges to improving on first generation ethanol processes. The first is to develop strategies for economical production of liquid biofuels from non-food crop feed stocks. The second is to engineer the production of fuel molecules superior to ethanol at high yield, productivity, and titer.
1.1.1 Lignocellulosic Feed Stocks
An alternative to cornstarch and sucrose feed stocks is lignocellulosic biomass. Lignocellulosic material is "woody" biomass which can be obtained from agricultural residues (e.g. bagasse, corn stover, rice straw, and wheat straw) or dedicated fuel crops (e.g. miscanthus and switchgrass) which can be grown to yields of biomass per acre far superior to those of corn and sugarcane and can often be cultivated on low quality soil that is not suitable for production of
food crops. Consequently, their production is not expected to compete with the food supply (at least not directly). The United States Department of Energy has estimated that by mid-century the United States could sustainably produce 1.3 billion tons of dry biomass, equivalent to approximately one-third of the nation's current petroleum consumption, while still meeting food, feed, and export needs (Perlack et al., 2005).
However, conversion of lignocellulosic biomass to liquid fuels is difficult. This material consists primarily of three fractions: cellulose (a polymer of glucose), hemicellulose (polysaccharides composed of many sugars but especially rich in the pentose sugar xylose), and lignin (a polymer of aromatics). Production of liquid fuels requires the hydrolysis of the cellulose and hemicellulose fractions to their constituent sugars, which can be converted to fuel molecules by fermentation. However, the three primary components of woody biomass are interwoven and covalently cross-linked into a complex structure, making lignocellulosic material notoriously recalcitrant. In addition, the structure of cellulose makes its hydrolysis significantly more difficult than that of cornstarch, even in a purified form. Thus, while lignocellulosic feed stocks are much less expensive than food crops, their conversion to fermentable sugars requires significantly more time and money.
There are also obstacles to the cost-effective fermentation of sugar monomers derived from lignocellulosic biomass to fuel molecules. Hydrolysis of lignocellulosic material generates compounds such as furan derivatives, weak acids, and phenolics which inhibit microbial biocatalysts (Almeida et al., 2007). In addition, the yeasts used in first generation processes to effect the conversion of hexose sugars to ethanol generally cannot metabolize pentose sugars
including xylose, which is the major component of hemicellul-ose. Production of lignocellulosic fuels cannot be cost-effective if the pentose sugars are not utilized (Stephanopoulos, 2007; Carroll and Somerville, 2009). Yeasts capable of pentose fermentation have been engineered in recent years (Hahn-Hagerdal et al., 2007; van Maris et al., 2007; Wisselink et al., 2009), but productivities are still significantly lower than those obtained in glucose fermentations. Thus, yeast strains with superior ability to utilize xylose are still needed. Xylose fermentation in
Saccharomyces cerevisiae is the subject of Chapter 5 of this thesis.
1.1.2 Alternative Fuel Molecules
The disadvantages of ethanol as a fuel molecule were discussed above. In recent years there have been efforts to engineer microbial biocatalysts for production of superior targets, including higher alcohols (Atsumi et al., 2008; Avalos et al., 2013; Sheppard et al., 2014), fatty acids (Steen et al., 2010), and alkanes (Schirmer et al., 2010). Relative to ethanol these molecules are more energy dense, more hydrophobic, and less corrosive. However at present the most widely used biofuel after ethanol is biodiesel. Biodiesel is today produced by transesterification of
vegetable oils (e.g. rapeseed, palm, and soybean), animal fats, and waste oils, with vegetable oils accounting for the majority of biodiesel production (Gui et al., 2008). However, these first generation technologies for production of biodiesel from food oils have the same drawbacks as processes for production of ethanol from food crops described above. In order to produce enough biodiesel to meet a significant portion of demand for transportation energy without competing with the food supply, alternative sources of oil will be required.
It has been proposed that oils for biodiesel production could be derived from oleaginous microbes capable of accumulating lipids to high fractions of total biomass (Li et al., 2008; Meng et al., 2009; Ageitos et al., 2011). Some algae are capable of producing lipids from carbon dioxide via photosynthesis (Chisti, 2007), however because these microbes require light only low cell densities can be achieved. "Single cell oil" could also be produced by an oleaginous yeast, such as Yarrowia lipolytica (Tai and Stephanopoulos, 2013). A cost-effective process will require a biocatalyst capable of producing lipids at high yield, productivity, and titer, with the titer being determined by both cell density and lipid content (i.e. the fraction of the total cell mass which is lipid). Lipid overproduction from glucose in Y. lipolytica is the subject of Chapter 6 of this thesis.
As with ethanol, lipids could be produced by conversion of hexose sugars, but other feed stocks can also be envisioned. Several recent studies (Fei et al., 201la, 2011 b; Christophe et al., 2012; Fontanille et al., 2012) have explored the possibility of producing single cell oil from volatile fatty acids (VFAs), which can be obtained by fermentation of organics present in municipal solid waste and sewage sludge (Sans et al., 1995a, 1995b; Morgan-Sagastume et al., 2011) or syngas (Hu et al., 2013). A process for conversion of VFAs to biodiesel would address both challenges discussed above, generating a superior fuel molecule from an inexpensive feed stock. Production of lipids from acetate, the most abundantly available VFA, is the subject of Chapter 7.
1.2
1C-MetabolicFlux Analysis
The following section is adapted from (Wasylenko and Stephanopoulos, 2013).
As discussed above, economical production of biofuels will require engineering of microbes with novel capabilities such as rapid utilization of xylose and overproduction of lipids at high yield, productivity, and final titer. Strain development for biofuels applications can be informed by metabolic flux estimation. Cells assimilate carbon, energy, and reducing power for growth and other essential processes through the reactions of central carbon metabolism. The magnitudes of the fluxes through these central metabolic reactions are tightly controlled, and represent the functional output of transcriptional, translational, and post-translational regulatory processes (Nielsen, 2003; Sauer, 2006). Consequently, in microbial systems knowledge of the distributions of metabolic flux in different strains or under different conditions has proven to be extremely powerful in basic physiological studies (Fischer and Sauer, 2005; Gombert et al., 2001). More importantly for the work in this thesis, experimentally determined metabolic flux distributions can be informative in biotechnological applications, for instance in understanding the genetic manipulations and metabolic rearrangements that might lead to increased production of a desired compound (Wittmann and Heinzle, 2002) or how metabolism changes over the course of a fermentation (Antoniewicz et al., 2007b).
Determination of intracellular metabolic fluxes is experimentally challenging. Direct measurement of these metabolic fluxes is impossible so that mathematical models are required to estimate the intracellular flux distribution from other directly measurable quantities (Schmidt et
al., 1999a). In the metabolite balancing approach, measured rates of consumption and production of extracellular metabolites (referred to as "extracellular flux measurements"), known stoichiometry of intracellular reactions, and a pseudo-steady state assumption on intracellular metabolite concentrations are used to construct a mass balance constraint for each metabolite in the metabolic network (Vallino and Stephanopoulos, 1993). However, in most systems of interest the number of unknown fluxes to be estimated exceeds the number of metabolites for which a mass balance equation can be written so that the resulting system of linear equations is underdetermined and an infinite number of solutions for the metabolic flux distribution exist. Optimization methods can be used to find the flux distribution that optimizes a specified objective function, the most commonly chosen objective function being maximum growth rate (Varma and Palsson, 1994). However, in many instances it is unclear that the flux distribution that maximizes growth rate will approximate the true flux distribution in the cell, especially for genetically engineered strains (Segre et al., 2002; Fischer and Sauer, 2005), so that determining an appropriate objective function can be difficult. Moreover, the purely stoichiometric models used in metabolite balancing often rely on assumptions about redox cofactor usage and energy yields which are difficult to verify and can introduce significant errors into the estimated flux distributions (Marx et al., 1996; Schmidt et al., 1998).
Additional constraints on the metabolic flux distribution can be obtained through the application of isotopic tracers, substrates which are selectively "labeled" with rare, stable isotopes. The most commonly used stable isotope label is 13
C. The 13C atoms from the tracer may be incorporated into any of the carbon atom positions of an intracellular metabolite. For a metabolite with n carbons in its backbone, there are 2n possible carbon labeling patterns, each of
which corresponds to a different combination of 12C and 13C atoms at the various carbon atom
positions. These 2' species are referred to as the "isotopic isomers," or "isotopomers," of the metabolite. For each metabolite, the set of 2' mole fractions describing the fraction of the total metabolite pool with each possible 13C labeling pattern is referred to as the "isotopomer distribution" of that metabolite. If an appropriate choice is made for the tracer, these isotopomer distributions will be functions of the intracellular metabolic fluxes, so that information about metabolite labeling patterns can be used to add constraints to the stoichiometric models described above. Such information can in principle be obtained using 1H nuclear magnetic resonance (NMR) (Marx et al., 1996), 13C NMR (Sauer et al., 1997; Schmidt et al., 1999a;
Szyperski, 1995), or mass spectroscopy (MS) (Christensen and Nielsen, 1999; Dauner and Sauer, 2000), although in practice MS has become the technology of choice for determination of 13C labeling patterns because its sensitivity and precision greatly exceed those of NMR (Christensen et al., 2002; Wittmann and Heinzle, 1999). The supplementation of a stoichiometric model with additional constraints derived from measured isotopic labeling patterns typically yields a system that is significantly overdetermined, allowing for the determination of a unique flux solution without identification of an appropriate objective function or inclusion of often unreliable cofactor balances and assumed energy yields.
Over the past 20 years, rigorous quantitative methods have been developed for the estimation of the metabolic fluxes through central carbon metabolism using such stoichiometric models augmented with 13C labeling data (Marx et al., 1996; M1lney et al., 1999; Schmidt et al., 1999a, 1999b; Wiechert et al., 1999, 1997; Wiechert and de Graaf, 1997). Flux estimation is achieved through an iterative procedure in which a putative metabolic flux distribution is generated and
the 13C label distributions in intracellular metabolites that would result from this flux distribution
are predicted. The putative metabolic fluxes are refined until the predicted 13C metabolite labeling data match as closely as possible the 13C labeling data obtained from experiment. The metabolic flux distribution that minimizes the lack-of-fit between simulated and measured 13C
metabolite labeling data is considered to be the best estimate for the true intracellular metabolic fluxes. This process of estimating intracellular metabolic fluxes from stoichiometric relations and 13C-labeling data is referred to as 13C-Metabolic Flux Analysis (MFA).
The key step in these flux estimation algorithms is the prediction of the 13C labeling state that will result from a putative flux distribution. This typically involves the solution of a large set of isotopomer balance equations. Although the presence of bimolecular reactions results in non-linearities in these isotopomer balance equations, methods have been developed for the transformation of systems of non-linear isotopomer balance equations to cascades of systems of linear equations with the same information content so that the labeling state resulting from a specified flux distribution can always be determined (Antoniewicz et al., 2007a; Wiechert et al.,
1999).
1.3
1C-MFAMathematical Formulation
This section presents the mathematical formulation of 13C-MFA and the notation used throughout this thesis. For the work described in this thesis, MS was used for measurement of metabolite 13C labeling patterns. In some cases (especially with GC-MS), carbon-carbon bonds are broken during the MS ionization process and a fragment with only a subset of the carbons in
the metabolite backbone is detected. In this section, the term "metabolite" will be used to describe a metabolite fragment detected by MS, whether or not the fragment contains all of the carbon atoms present in the unfragmented metabolite.
MS resolves the isotopomers of a metabolite by molecular mass. In general, a metabolite isotopomer with i 13C atoms will have a mass of M + i, where M is the molecular mass of the metabolite when all the carbon atoms are 12C. Isotopomers of a metabolite with the same number of 13C atoms cannot be distinguished by MS, even if the 13C atoms are in different positions. Consequently, for MS 13C labeling analysis it is useful to define the concept of a "mass isotopomer," which is a set of all isotopomers of a metabolite with the same molecular mass (and equivalently, the same number of 13C atoms). In general, a metabolite with n carbons
will have n + 1 mass isotopomers (i = 0, 1, 2, ... , n). For each metabolite, the set of n + 1 mole
fractions describing the fraction of the total metabolite pool with each possible molecular mass will be referred to as the "Mass Isotopomer Distribution" (MID). (As an aside, the foregoing analysis ignores the effects of naturally occurring heavy isotopes of carbon and other elements in the metabolite. The presence of these naturally occurring heavy isotopes results in a "skewing"
of the measured metabolite MIDs. Methods for correction for these effects are well-known, and so in the following these effects can be ignored without loss of generality (Fernandez et al., 1996; Wittmann and Heinzle, 1999; van Winden et al., 2002).)
The intracellular metabolite labeling state can be represented by a set of mole fractions
j
in which each mole fraction y is equal to the fraction of a metabolite pool with a certain 13C-labeling pattern. In the work in this thesisY
will represent the set of all metabolite MID molefractions measured by MS in a given experiment, but the following analysis could also apply to labeling data acquired by NMR. In the previous section it was noted that for a given tracer j is a single-valued function of the metabolic fluxes v:
S= f()(1.1)
and this function can always be evaluated by solving a set of balance equations. "C-MFA requires that the labeling state of the intracellular metabolites be measured in a Carbon Labeling Experiment (CLE). The metabolite labeling measurements will be referred to as Ymeas. The flux estimation algorithm seeks to determine the flux distribution j which minimizes the difference between j and ymeas
At metabolic steady state the rate of consumption must be equal to the rate of production for every intracellular metabolite. Thus the metabolic flux distribution is constrained by a set of metabolite mass balances which can be expressed using the stoichiometric matrix S:
S -i,= (1.2)
As noted above, the number of fluxes to be estimated generally exceeds the number of mass balance constraints (i.e. S has more columns than rows) so that this system of equations is underdetermined. A unique flux distribution can be obtained by solving an optimization problem: min s. t. (1.3) S A C v=b *v ci g (;)
where A, b, C, and d can be chosen to impose equality or inequality constraints on the flux distribution (e.g. fixing a flux to a specified value or placing upper and lower bounds on specified fluxes). In Flux Balance Analysis (FBA) (Orth et al., 2010) the objective function g(i) is obtained from theory and is often chosen to solve for the flux distribution which maximizes the biomass yield on the carbon source. For instance, if the specific growth rate [ is fixed with an equality constraint, the objective function could be the carbon source uptake flux. Conversely, if the carbon source uptake flux is fixed then the objective function could be chosen to be g (i) = -y.
In "C-MFA, the objective function g(ii) is the lack-of-fit between measured and simulated datasets. If the lack-of-fit is quantified by the sum of squared residuals between the model and data, the 13C-MFA problem formulation can then be written as:
m in 1Ymeas _
f(i)11
2 (1.4)1;
s.t. S -v=
Generally the rates of consumption and production of extracellular metabolites can also be calculated in the CLE by measuring the extracellular concentrations of substrates and products over time (e.g. by HPLC) and computing the time derivatives of the extracellular concentrations. In this case, the calculated "extracellular flux" data are also used in determining the most likely flux distribution. The formulation of the 1 3C-MFA problem including both metabolite labeling and extracellular flux data is:
(yfmeas _ 2 (Vkmeas - V)2(1.5)
kEEF k)
s.t. S-v=O
where EF is the subset of fluxes which are extracellular fluxes (i.e. fluxes in which a substrate crosses the cell membrane from the extracellular medium to the cytosol or a product crosses the cell membrane from the cytosol to the extracellular medium) measured in the CLE, Vkmeas is the value of flux k measured in the CLE, c- 2 is the variance (squared standard deviation) of ymeas, and o-k2 is the variance of Vkmeas. The formulation in equation (1.5) is used for all the
13C-MFA in this thesis.
1.4 Thesis Overview:
1C-MFAof Recombinant Yeasts for Biofuels
Applications
This thesis describes the application of 13C-MFA to two yeast systems relevant for biofuel production. First a method for Liquid Chromatography-Tandem Mass Spectrometry (LC-MS/MS) analysis of phosphorylated metabolites and an optimized method for extraction of intracellular metabolites were developed in order to facilitate acquisition of metabolite pool size and 13C-labeling data for the 13C-MFA studies (Chapter 2). Next an analysis of the expected measurement (Chapter 3) and modeling (Chapter 4) errors in 13C-labeling data was undertaken in order to determine the precision with which metabolic fluxes can be modeled with these data.
Finally, using the methods described in Chapter 2 and insights gained from the work described in Chapters 3 and 4, 13C-MFA was applied to the two systems of interest. In Chapter 5, the
metabolism of a xylose-consuming S. cerevisiae strain was investigated on glucose and on xylose under both aerobic and anaerobic conditions in order to identify potential bottlenecks in the anaerobic fermentation of xylose to ethanol. In Chapters 6 and 7, 13C-MFA was applied to the oleaginous yeast Y. lipolytica on glucose and acetate carbon sources, respectively, in order to study the metabolic rearrangements required for lipid overproduction in biodiesel applications and to determine the primary source of NADPH for lipid biosynthesis. FBA was also used to explore potential strategies for improving lipid yield on acetate. Conclusions and recommendations for future work are described in Chapter 8.
1.5 References
Ageitos, J.M., Vallejo, J.A., Veiga-Crespo, P., Villa, T.G., 2011. Oily yeasts as oleaginous cell factories. Appl. Microbiol. Biotechnol. 90, 1219-1227. doi:10.1007/s00253-011-3200-z
Almeida, J.R., Modig, T., Petersson, A., Hahn-Hagerdal, B., Liden, G., Gorwa-Grauslund, M.F., 2007. Increased tolerance and conversion of inhibitors in lignocellulosic hydrolysates
bySaccharomyces cerevisiae. J. Chem. Technol. Biotechnol. 82, 340-349. doi:10.1002/jctb.1676
Antoniewicz, M.R., Kelleher, J.K., Stephanopoulos, G., 2007a. Elementary metabolite units (EMU): a novel framework for modeling isotopic distributions. Metab. Eng. 9, 68-86. doi: 10.101 6/j.ymben.2006.09.001
Antoniewicz, M.R., Kraynie, D.F., Laffend, L.A., Gonzailez-Lergier, J., Kelleher, J.K., Stephanopoulos, G., 2007b. Metabolic flux analysis in a nonstationary system: fed-batch
fermentation of a high yielding strain of E. coli producing 1,3-propanediol. Metab. Eng. 9,
277-292. doi:10.1016/j.ymben.2007.01.003
Atsumi, S., Hanai, T., Liao, J.C., 2008. Non-fermentative pathways for synthesis of branched-chain higher alcohols as biofuels. Nature 451, 86-89. doi:10.1038/nature06450
Avalos, J.L., Fink, G.R., Stephanopoulos, G., 2013. Compartmentalization of metabolic pathways in yeast mitochondria improves the production of branched-chain alcohols. Nat. Biotechnol. 31, 335-341. doi:10.1038/nbt.2509
Carroll, A., Somerville, C., 2009. Cellulosic biofuels. Annu. Rev. Plant Biol. 60, 165-182. doi: 10.1 146/annurev.arplant.043008.092125
Chisti, Y., 2007. Biodiesel from microalgae. Biotechnol. Adv. 25, 294-306. doi: 10.1016/j .biotechadv.2007.02.001
Christensen, B., Gombert, A.K., Nielsen, J., 2002. Analysis of flux estimates based on (13)C-labelling experiments. Eur. J. Biochem. FEBS 269, 2795-2800.
Christensen, B., Nielsen, J., 1999. Isotopomer analysis using GC-MS. Metab. Eng. 1, 282-290. doi:10.1006/mben.1999.0117
Christophe, G., Deo, J.L., Kumar, V., Nouaille, R., Fontanille, P., Larroche, C., 2012. Production of Oils from Acetic Acid by the Oleaginous Yeast Cryptococcus curvatus. Appl. Biochem. Biotechnol. 167, 1270-1279. doi:10.1007/s12010-011-9507-5
Dauner, M., Sauer, U., 2000. GC-MS analysis of amino acids rapidly provides rich information for isotopomer balancing. Biotechnol. Prog. 16, 642-649. doi: 10.102 1/bpOO0058h
Fei,
Q.,
Chang, H.N., Shang, L., Choi, J., 201 la. Exploring low-cost carbon sources for microbial lipids production by fed-batch cultivation of Cryptococcus albidus. Biotechnol. Bioprocess Eng. 16, 482-487. doi: 10.1007/si2257-010-0370-yFei,
Q.,
Chang, H.N., Shang, L., Choi, J., Kim, N., Kang, J., 2011 b. The effect of volatile fatty acids as a sole carbon source on lipid accumulation by Cryptococcus albidus for biodiesel production. Bioresour. Technol. 102, 2695-2701. doi: 10.101 6/j.biortech.2010.10.141Fernandez, C.A., Des Rosiers, C., Previs, S.F., David, F., Brunengraber, H., 1996. Correction of 13C mass isotopomer distributions for natural stable isotope abundance. J. Mass Spectrom. JMS 31, 255-262. doi:10.1002/(SICI)1096-9888(199603)31:3<255::AID-JMS290>3.0.CO;2-3
Fischer, E., Sauer, U., 2005. Large-scale in vivo flux analysis shows rigidity and suboptimal performance of Bacillus subtilis metabolism. Nat. Genet. 37, 636-640. doi:10.1038/ng1555
Fontanille, P., Kumar, V., Christophe, G., Nouaille, R., Larroche, C., 2012. Bioconversion of volatile fatty acids into lipids by the oleaginous yeast Yarrowia lipolytica. Bioresour. Technol.
114, 443-449. doi:10.1016/j.biortech.2012.02.091
Gombert, A.K., Moreira dos Santos, M., Christensen, B., Nielsen, J., 2001. Network
identification and flux quantification in the central metabolism of Saccharomyces cerevisiae under different conditions of glucose repression. J. Bacteriol. 183, 1441-145 1.
Gui, M.M., Lee, K.T., Bhatia, S., 2008. Feasibility of edible oil vs. non-edible oil vs. waste edible oil as biodiesel feedstock. Energy 33, 1646-1653. doi: 10.101 6/j.energy.2008.06.002
Hahn-Hagerdal, B., Karhumaa, K., Fonseca, C., Spencer-Martins, I., Gorwa-Grauslund, M.F., 2007. Towards industrial pentose-fermenting yeast strains. Appl. Microbiol. Biotechnol. 74, 937-953. doi:10.1007/s00253-006-0827-2
Hu, P., Rismani-Yazdi, H., Stephanopoulos, G., 2013. Anaerobic C02 fixation by the acetogenic bacterium Moorella thermoacetica. AIChE J. 59, 3176-3183. doi:10. 1002/aic. 14127
Li,
Q.,
Du, W., Liu, D., 2008. Perspectives of microbial oils for biodiesel production. Appl. Microbiol. Biotechnol. 80, 749-756. doi:10.1007/s00253-008-1625-9Marx, A., de Graaf, A.A., Wiechert, W., Eggeling, L., Sahm, H., 1996. Determination of the fluxes in the central metabolism of Corynebacterium glutamicum by nuclear magnetic resonance spectroscopy combined with metabolite balancing. Biotechnol. Bioeng. 49, 111-129.
doi: 10.1002/(SICI) 1097-0290(19960120)49:2<111::AID-BIT 1>3.0.CO;2-T
Meng, X., Yang, J., Xu, X., Zhang, L., Nie,
Q.,
Xian, M., 2009. Biodiesel production from oleaginous microorganisms. Renew. Energy 34, 1-5. doi:10. 1016/j.renene.2008.04.014M611ney, M., Wiechert, W., Kownatzki, D., de Graaf, A.A., 1999. Bidirectional reaction steps in metabolic networks: IV. Optimal design of isotopomer labeling experiments. Biotechnol.
Bioeng. 66, 86-103.
Morgan-Sagastume, F., Pratt, S., Karlsson, A., Cime, D., Lant, P., Werker, A., 2011. Production of volatile fatty acids by fermentation of waste activated sludge pre-treated in full-scale thermal hydrolysis plants. Bioresour. Technol. 102, 3089-3097. doi: 10.101 6/j.biortech.2010.10.054
Nielsen, J., 2003. It is all about metabolic fluxes. J. Bacteriol. 185, 7031-7035.
Orth, J.D., Thiele, I., Palsson, B.O., 2010. What is flux balance analysis? Nat. Biotechnol. 28, 245-248. doi:10.1038/nbt.1614
Perlack, R.D., Wright, L.L., Turhollow, A.F., Stokes, B.J., Erbach, D.C., 2005. Biomass as a Feedstock for a Bioenergy and Bioproducts Industry: The Technical Feasibility of a Billion-Ton Annual Supply. Oak Ridge National Laboratory.
Sans, C., Mata-Alvarez, J., Cecchi, F., Pavan, P., Bassetti, A., 1995a. Volatile fatty acids production by mesophilic fermentation of mechanically-sorted urban organic wastes in a
plug-flow reactor. Bioresour. Technol. 51, 89-96. doi: 10.1016/0960-8524(95)95 866-Z
Sans, C., Mata-Alvarez, J., Cecchi, F., Pavan, P., Bassetti, A., 1995b. Acidogenic fermentation of organic urban wastes in a plug-flow reactor under thermophilic conditions. Bioresour. Technol. 54, 105-110. doi:10.1016/0960-8524(95)00098-4
Sauer, U., 2006. Metabolic networks in motion: 13C-based flux analysis. Mol. Syst. Biol. 2. doi:10.1038/msb4100109
Sauer, U., Hatzimanikatis, V., Bailey, J.E., Hochuli, M., Szyperski, T., Wtithrich, K., 1997. Metabolic fluxes in riboflavin-producing Bacillus subtilis. Nat. Biotechnol. 15, 448-452. doi: 10.1038/nbt0597-448
Schirmer, A., Rude, M.A., Li, X., Popova, E., del Cardayre, S.B., 2010. Microbial biosynthesis of alkanes. Science 329, 559-562. doi: 10.1 126/science. 1187936
Schmidt, K., Nielsen, J., Villadsen, J., 1999a. Quantitative analysis of metabolic fluxes in
Escherichia coli, using two-dimensional NMR spectroscopy and complete isotopomer models. J. Biotechnol. 71, 175-189.
Schmidt, K., Norregaard, L.C., Pedersen, B., Meissner, A., Duus, J.O., Nielsen, J.O., Villadsen, J., 1999b. Quantification of intracellular metabolic fluxes from fractional enrichment and
13C-13C coupling constraints on the isotopomer distribution in labeled biomass components. Metab. Eng. 1, 166-179. doi:10.1006/mben.1999.0114
Schmidt, Marx, de Graaf AA, Wiechert, Sahm, Nielsen, Villadsen, 1998. 13C tracer experiments and metabolite balancing for metabolic flux analysis: comparing two approaches. Biotechnol. Bioeng. 58, 254-257.
Segre, D., Vitkup, D., Church, G.M., 2002. Analysis of optimality in natural and perturbed metabolic networks. Proc. Natl. Acad. Sci. U. S. A. 99, 15112-15117.
doi: 10. 1073/pnas.232349399
Sheppard, M.J., Kunjapur, A.M., Wenck, S.J., Prather, K.L.J., 2014. Retro-biosynthetic screening of a modular pathway design achieves selective route for microbial synthesis of 4-methyl-pentanol. Nat. Commun. 5, 5031. doi: 10.1038/ncomms603 1
Steen, E.J., Kang, Y., Bokinsky, G., Hu, Z., Schirmer, A., McClure, A., Del Cardayre, S.B., Keasling, J.D., 2010. Microbial production of fatty-acid-derived fuels and chemicals from plant biomass. Nature 463, 559-562. doi: 10.1038/nature08721
Stephanopoulos, G., 2007. Challenges in engineering microbes for biofuels production. Science 315, 801-804. doi:10. 126/science.1139612
Szyperski, T., 1995. Biosynthetically directed fractional 13C-labeling of proteinogenic amino acids. An efficient analytical tool to investigate intermediary metabolism. Eur. J. Biochem. FEBS 232, 433-448.
Tai, M., Stephanopoulos, G., 2013. Engineering the push and pull of lipid biosynthesis in oleaginous yeast Yarrowia lipolytica for biofuel production. Metab. Eng. 15, 1-9.
doi: 10.1016/j.ymben.2012.08.007
Vallino, J.J., Stephanopoulos, G., 1993. Metabolic flux distributions in Corynebacterium glutamicum during growth and lysine overproduction. Biotechnol. Bioeng. 41, 633-646. doi: 10.1002/bit.260410606
Van Maris, A.J.A., Winkler, A.A., Kuyper, M., de Laat, W.T.A.M., van Dijken, J.P., Pronk, J.T., 2007. Development of efficient xylose fermentation in Saccharomyces cerevisiae: xylose
isomerase as a key component. Adv. Biochem. Eng. Biotechnol. 108, 179-204. doi:10.1007/10_2007 057
Van Winden, W.A., Wittmann, C., Heinzle, E., Heijnen, J.J., 2002. Correcting mass isotopomer distributions for naturally occurring isotopes. Biotechnol. Bioeng. 80, 477-479.
doi: 10.1002/bit. 10393
Varma, A., Palsson, B.O., 1994. Stoichiometric flux balance models quantitatively predict growth and metabolic by-product secretion in wild-type Escherichia coli W3 110. Appl. Environ. Microbiol. 60, 3724-3731.
Wasylenko, T.M., Stephanopoulos, G., 2013. Kinetic isotope effects significantly influence intracellular metabolite (13) C labeling patterns and flux determination. Biotechnol. J. 8, 1080-1089. doi: 10.1002/biot.201200276
Wiechert, W., de Graaf, A.A., 1997. Bidirectional reaction steps in metabolic networks: I. Modeling and simulation of carbon isotope labeling experiments. Biotechnol. Bioeng. 55,
101-117. doi:10.1002/(SICI)1097-0290(19970705)55:1<101::AID-BIT12>3.0.CO;2-P
Wiechert, W., Mbllney, M., Isermann, N., Wurzel, M., de Graaf, A.A., 1999. Bidirectional reaction steps in metabolic networks: III. Explicit solution and analysis of isotopomer labeling
systems. Biotechnol. Bioeng. 66, 69-85.
Wiechert, W., Siefke, C., de Graaf, A.A., Marx, A., 1997. Bidirectional reaction steps in metabolic networks: II. Flux estimation and statistical analysis. Biotechnol. Bioeng. 55,
118-135. doi:10.1002/(SICI)1097-0290(19970705)55:1<118::AID-BIT13>3.0.CO;2-I Wisselink, H.W., Toirkens, M.J., Wu,
Q.,
Pronk, J.T., van Maris, A.J.A., 2009. Novelevolutionary engineering approach for accelerated utilization of glucose, xylose, and arabinose mixtures by engineered Saccharomyces cerevisiae strains. Appl. Environ. Microbiol. 75, 907-914. doi:10.1 128/AEM.02268-08
Wittmann, C., Heinzle, E., 2002. Genealogy profiling through strain improvement by using metabolic network analysis: metabolic flux genealogy of several generations of lysine-producing corynebacteria. Appl. Environ. Microbiol. 68, 5843-5859.
Wittmann, Heinzle, 1999. Mass spectrometry for metabolic flux analysis. Biotechnol. Bioeng. 62, 739-750.
Chapter 2
Methods for Metabolite Extraction and LC-MS/MS Analysis
2.1 Introduction
13C-Metabolic Flux Analysis (MFA) requires accurate and precise metabolite labeling data for
flux estimation. The earliest 13C-MFA studies employed NMR to quantify 13C labeling of amino acids obtained from protein hydrolysates (Szyperski, 1995; Marx et al., 1996). The pathways for biosynthesis of these proteinogenic amino acids are well known, and consequently the amino acid labeling information can be used to infer the labeling patterns of central carbon metabolite precursors (Szyperski, 1995; Maaheimo et al., 2001).
The principal advantage of using proteinogenic amino acids to obtain labeling data is that protein is very abundant so that relatively little biomass is required to obtain sufficient signal with either NMR or Mass Spectrometry (MS). However, there are several drawbacks associated with using proteinogenic amino acids as proxies for their central carbon metabolite precursors. The most obvious is that labeling information can only be obtained for metabolites which are substrates for amino acid biosynthesis. Data for other metabolites in the metabolic network are not available with this approach. The second major disadvantage is that this approach requires that the flux analysis be conducted while the cells are in a metabolic steady state and are actively synthesizing protein (i.e. during exponential growth in a batch culture or in a chemostat). For the protein labeling patterns to accurately reflect those of the central carbon metabolite precursors, the steady state must be maintained until nearly all the protein in the system has been synthesized in