HAL Id: hal-01197628
https://hal.archives-ouvertes.fr/hal-01197628
Submitted on 27 May 2020
HAL is a multi-disciplinary open access archive for the deposit and dissemination of sci-entific research documents, whether they are pub-lished or not. The documents may come from teaching and research institutions in France or abroad, or from public or private research centers.
L’archive ouverte pluridisciplinaire HAL, est destinée au dépôt et à la diffusion de documents scientifiques de niveau recherche, publiés ou non, émanant des établissements d’enseignement et de recherche français ou étrangers, des laboratoires publics ou privés.
root architecture adaptation to nitrate supply in a
[i]Medicago truncatula[/i] highly branched root mutant
Virginie Bourion, Chantal Martin, Henri de Larambergue, Françoise Jacquin,
Gregoire Aubert, Marie-Laure Magniette, Sandrine Balzergue, Geoffroy
Lescure, Sylvie Citerne, Marc Lepetit, et al.
To cite this version:
Virginie Bourion, Chantal Martin, Henri de Larambergue, Françoise Jacquin, Gregoire Aubert, et al.. Unexpectedly low nitrogen acquisition and absence of root architecture adaptation to nitrate supply in a [i]Medicago truncatula[/i] highly branched root mutant. Journal of Experimental Botany, Oxford University Press (OUP), 2014, 65 (9), pp.2365-2380. �10.1093/jxb/eru124�. �hal-01197628�
This paper is available online free of all access charges (see http://jxb.oxfordjournals.org/open_access.html for further details)
ReseaRch PaPeR
Unexpectedly low nitrogen acquisition and absence of root
architecture adaptation to nitrate supply in a Medicago
truncatula highly branched root mutant
Virginie Bourion1,*, Chantal Martin1, Henri de Larambergue1, Françoise Jacquin1, Grégoire Aubert1,
Marie-Laure Martin-Magniette2,3,4,5,6, Sandrine Balzergue4,5,6, Geoffroy Lescure7, Sylvie Citerne7,
Marc Lepetit8, Nathalie Munier-Jolain1, Christophe Salon1 and Gérard Duc1
1 INRA, UMR1347 Agroécologie, BP 86510, F-21065 Dijon, France 2 INRA, UMR518 MIA, F-75231 Paris, France
3 AgroParisTech, UMR MIA, F-75231 Paris, France 4 INRA, UMR1165 URGV, F-91057 Evry, France 5 UEVE, UMR URGV, F-91057 Evry, France
6 CNRS, ERL8196 UMR URGV, F-91057 Evry, France
7 Institut Jean-Pierre Bourgin, UMR1318 INRA/AgroParisTech, F-78026 Versailles, France
8 USC1342 INRA, UMR113 IRD-CIRAD-SupAgro-UM2, Symbioses Tropicales et Méditerranéennes, Campus de Baillarguet, TA A-82/J,
F-34398 Montpellier Cedex 5, France
*To whom correspondence should be addressed. E-mail: virginie.bourion@dijon.inra.fr Received 11 July 2013; Revised 18 February 2014; Accepted 25 February 2014
Abstract
To complement N2 fixation through symbiosis, legumes can efficiently acquire soil mineral N through adapted root architecture. However, root architecture adaptation to mineral N availability has been little studied in legumes. Therefore, this study investigated the effect of nitrate availability on root architecture in Medicago truncatula and assessed the N-uptake potential of a new highly branched root mutant, TR185. The effects of varying nitrate supply on both root architecture and N uptake were characterized in the mutant and in the wild type. Surprisingly, the root architecture of the mutant was not modified by variation in nitrate supply. Moreover, despite its highly branched root architecture, TR185 had a permanently N-starved phenotype. A transcriptome analysis was performed to identify genes differentially expressed between the two genotypes. This analysis revealed differential responses related to the nitrate acquisition pathway and confirmed that N starvation occurred in TR185. Changes in amino acid content and expression of genes involved in the phenylpropanoid pathway were associated with differences in root architecture between the mutant and the wild type.
Key words: Amino acids, highly branched root mutant, Medicago truncatula, nitrogen acquisition, nitrogen limitation,
phenylpropanoid, root architecture.
Introduction
Nitrogen is one of the most limiting resources for plant growth. Legumes have a natural ability to use atmospheric N2 as the main N source, via symbiosis in nodules with
Rhizobiaceae spp. However, N nutrition can still limit yield
and seed quality in legumes, especially under abiotic or biotic stress conditions. In these conditions, the fixation of N2 is
impacted and cannot totally fulfil N demand (Salon et al., 2001), and the poorly developed root systems of N2-fixing
This is an Open Access article distributed under the terms of the Creative Commons Attribution License (http://creativecommons.org/licenses/by/3.0/), which permits unrestricted reuse, distribution, and reproduction in any medium, provided the original work is properly cited.
© The Author 2014. Published by Oxford University Press on behalf of the Society for Experimental Biology.
at INRA Avignon on November 25, 2014
http://jxb.oxfordjournals.org/
legumes are unable to explore a large soil volume (Bourion
et al., 2007). In this context, the genetic improvement of root system development is a target for increasing legume yield performance.
Up to now, the molecular determinants of root develop-ment in legumes have been little characterized. The naturally occurring genetic variability of root development in legumes has been investigated (Kraft and Boge, 2001; McPhee, 2005;
Bourion et al., 2010), but few genes involved in root
devel-opment have been characterized (Yendrek et al., 2010; Jin
et al., 2012). A complex tuning of root versus nodule devel-opment seems to operate in legumes, as mutants impaired in the autoregulation of nodulation display shorter root length or enhanced lateral root (LR) number (Wopereis et al., 2000;
Krusell et al., 2002; Schnabel et al., 2005; Schnabel et al., 2011;
Jin et al., 2012). Hormones have been shown to be involved
in their common molecular pathways; particularly auxin (de
Billy et al., 2001; Jin et al., 2012), cytokinin (Gonzalez-Rizzo
et al., 2006; Frugier et al., 2008; Plet et al., 2011), and abscisic acid (Bright et al., 2005; Liang et al., 2007; Yendrek et al.,
2010).
The paramount importance of hormones in the regulation of root growth and development has been thoroughly investi-gated in Arabidopsis (Peret et al., 2009). Auxin delivery, which promotes LR initiation, is regulated by the auxin-influx car-rier AUX1 and auxin-efflux transporters PINs and PGP/ MDR (Muday and DeLong, 2001; Marchant et al., 2002). Auxin transport remains necessary for root elongation (Wu
et al., 2007). Interacting effects of auxin and cytokinin dis-rupt LR initiation by interfering with PIN gene expression and the associated auxin-gradient formation (Laplaze et al., 2007). Cytokinin has been shown to reduce the root elonga-tion rate through an ethylene-induced producelonga-tion (Benkova
and Hejatko, 2009; Ruzicka et al., 2009), whereas gibberellin
antagonizes the negative effects of ethylene on root growth
(Fu and Harberd, 2003; Ubeda-Tomas et al., 2008).
In addition, root growth and development are known in
Arabidopsis to be modulated by external NO3–
availabil-ity. The localized stimulatory effect of external nitrate on LR elongation has been shown to involve both ANR1 and NRT1.1, which act together as a NO3– sensor, promoting
auxin transport (Zhang and Forde, 1998; Remans et al.,
2006a; Krouk et al., 2010; Gojon et al., 2011). Evidence of
roles for cytokinin and abscisic acid in the root architectural response to nitrate have been presented (Walch-Liu et al.,
2006a; Kiba et al., 2011; Ruffel et al., 2011). A systemic
regu-lation of the root architecture by the plant N status has been described (Zhang et al., 1999; Remans et al., 2006b), involv-ing feedback repression of root development by products of N assimilation (Walch-Liu et al., 2006b; Gifford et al., 2008). The modulation of the root system architecture in response to N supply is also known to depend on the plant C alloca-tion within the root system (Brun et al., 2010), and LR ini-tiation level has been shown to be related to the C:N ratio
(Zhang and Forde, 2000; Malamy and Ryan, 2001; Malamy,
2005). Transcriptomic analyses have confirmed that many genes involved in N assimilation or C primary metabolism are responsive to variation of nitrate supply (Wang et al., 2003;
Scheible et al., 2004; Bi et al., 2007). Transcriptomic studies
of legumes subjected to variation in nitrate supply are con-sistent with those obtained in Arabidopsis (Ruffel et al., 2008;
Omrane et al., 2009).
This study describes a new highly branched root Medicago
truncatula mutant and showed its unexpectedly low nitrogen
acquisition and absence of root architecture adaptation to nitrate supply.
Materials and methods
Plant material
M. truncatula cv. Jemalong J5 was used as the wild-type reference (WT) and for backcrosses of the mutant TR185. The mutant was selected after gamma-ray mutagenesis on J5 (Sagan et al., 1995) and displayed a phenotype with highly branched roots and few small nodules (Salon et al., 2009). The mutation was stable over four generations of selfing. Genetic analyses revealed that the highly branched root architecture of TR185 is determined by a single reces-sive mutation (Supplementary Table S1 available at JXB online). Plant growth conditions
Scarified seeds of both genotypes were surface sterilized for 7 min with 3% sodium hypochlorite and rinsed seven times with sterile water. Seeds were then placed on sterilized plastic boxes filled with 1 l of 4% (w/v) Kalys agar HP 696 gel. Boxes were left in the dark for 4 days of cold treatment at 4 °C followed by 4 days of germi-nation at 20 °C. Germinated seeds were transferred to hydroponic culture tanks filled with an aerated nutrient solution. The basal nutrient solution (Ruffel et al., 2008) was supplemented with 1 mM KNO3 (LN; low nitrate) or 10 mM KNO3 (HN; high nitrate) as the
N source. Rhizobium inoculation was performed neither in LN nor HN condition. The two nitrate levels were determined on the basis of previous studies of nitrogen nutrition on M. truncatula (Moreau
et al., 2008): for non-nodulating plants: optimal N nutrition was
achieved with 10 mM nitrate supply, whereas the N-nutrition index represented only 35% of the optimum at 0.625–1.25 mM nitrate supply. Both nutrient solutions had an initial pH of 6.6 and were renewed every week. Measurements in the hydroponic culture tanks before renewing the solution indicated a slight increase of the pH to 7.2 after 4 weeks, irrespective of N supply. Plants were grown in a growth chamber under a 16/8 light/dark cycle (24/19 °C), mean photosynthetically active radiation 200 μmol photons m–2 s–1, and
70% relative humidity. Each tank contained six WT and six TR185 plants. On one shelf of the growth chamber, nutrient solution in the tanks was supplemented by 1 mM KNO3 (LN); on the other shelf,
the concentration of KNO3 in the solution was 10 mM (HN). Three
successive experiments in the growth chamber were performed on the two different genotypes. Each experiment constituted a biologi-cal replicate. In each experiment, plants were collected at five succes-sive dates from 7 to 28 days after the transfer of germinated seeds into the tanks.
Plant measurements, ecophysiological modelling, and grafting At each of the five dates, six plants of each genotype were collected both in one LN and one HN tank. Length of the primary root (PRL) was measured. The first-to-third-order lateral roots were counted, allowing the calculation of total lateral root number (LRN). No nodule was found in any root observed. Then, the shoot and root systems were carefully spread separately onto transparent sheets and scanned as digital images with an A3 colour scanner (Epson, Tokyo, Japan). Total leaf area (LeafA), total root length (TRL), and total root surface area per plant were further determined by image analysis using WinRhizo software (Regent Instruments, Quebec,
at INRA Avignon on November 25, 2014
http://jxb.oxfordjournals.org/
Canada). Mean lateral root length (LRL) was then calculated as (TRL – PRL)/LRN. Roots and shoots were ovendried separately at 80 °C for 48 h for shoot, root, and total dry weight determina-tion (SDW, RDW, and TDW). Shoot and root N concentradetermina-tions of ground dried tissues (%ShootN, %RootN) were estimated follow-ing the Dumas’ method, and the total N accumulation in the plant (TotN) calculated. Then, three integrative variables, characteriz-ing the relationship between the four state variables LeafA, TDW, RDW, and TotN were calculated (Moreau et al., 2012) to represent efficiency of C or N acquisition. The LeafA is considered as the C source, which is distributed to roots according to root-to-total dry weight ratio (RDW/TDW). The RDW, or more precisely the root surface area, pilots the entrance of N into the plant, according to N-uptake rate (NUR). The TotN accumulated into the plant allows the elaboration of the LeafA, according to efficiency of N conver-sion into leaf area (NLA).
Grafting was performed as described in the ‘cuttings and grafts’ chapter of the Medicago handbook (
http://www.noble.org/medica-gohandbook/). Grafts were initially generated in vitro, and after 3
weeks were potted in attapulgite:clay balls (1:1) in the greenhouse for an additional 7 weeks. Three plants per combination were then care-fully spread onto transparent sheets and scanned as digital images, and LeafA and TRL determined by image analysis. The number of
first lateral roots per length of primary root was also determined for each plant.
For graft experiment and each sampling date, means and SE val-ues were calculated for all variables and ANOVA were performed using XLSTAT software (version 2010.6.03, http://www.xlstat.com). Means were classified using the least significant difference (LSD) range test at the 0.05 probability level.
Metabolic analyses Amino acid content
The levels of the 20 standard amino acids synthesized by plants were measured in TR185 and WT plants. Lyophilized samples (100 mg) were extracted in a three-step ethanol/water procedure, as described
by Loudet et al. (2003). Using the method described by Ikram
et al. (2012), ninhydrin colour reagent was added to the extract and
absorbance read at 570 nm on a spectrophotometer. This result was used to calculate the amino acid content in μmol (g FW)–1.
Lignin content
Lignin content in roots was determined using the acetyl bromide method adapted from Fukushima and Hatfield (2001). To pre-pare the root cell wall, 100 mg dried and ground root samples were
Fig. 1. Highly branched root architecture of the mutant TR185 irrespective of nitrate supply. (A and B) Representative examples of wild-type (WT) and
TR185 plants grown for 14 days in a growth chamber on hydroponic culture tanks filled with nutrient solutions with high (A; 10 mM, HN) or low (B; 1 mM, LN) nitrate supply. Bars, 5 cm. (C–E) Quantification of root architecture from 7 to 28 days after germination: lateral root number per plant (C), lateral root length (D), and total root length per plant (E). Data are mean±SE from three biological replicates of six plants each. Different letters above the columns indicate significant difference based on multiple comparisons (P<0.05, LSD test). The decrease in lateral root length at 28 days after germination in WT plants grown in HN has no biological significance (this figure is available in colour at JXB online).
at INRA Avignon on November 25, 2014
http://jxb.oxfordjournals.org/
extracted sequentially with stirring with water, ethanol, and acetone. An acetyl bromide/acetic acid solution (1:3, v/v) was added to about 5 mg dried extract. Lignins were solubilized whereas polysaccharides were hydrolysed. After the reaction, the excess of acetyl bromide and polybromide ions were destroyed by adding water and hydroxy-lamine chlorhydrate. Lignin content was calculated from absorbance readings at 280 nm, and expressed as mg (g root DW)–1.
Transcriptomic analyses
RNA extraction and Affymetrix GeneChip
Total RNA was extracted from roots using the Plant RNeasy Mini Kit with on-column DNAse digestion (Qiagen). All RNA samples were checked for their integrity on the Agilent 2100 Bioanalyzer (Agilent Technologies, Waldbronn, Germany) according to the man-ufacturer’s instructions. For microarray analyses, 2 μg total RNA were transcribed as described in Rey et al. (2013). The labelled cDNA produced was used to hybridize Affymetrix GeneChip Medicago genome arrays at INRA-URGV (Evry, France). The raw CEL files were imported in R software for data analysis. All raw and normal-ized data are available through the CATdb database (Gagnot et al., 2008; project ‘AFFY_root_dvt_Nitrogen_Medicago’), and from the Gene Expression Omnibus (GEO) repository at the National Center for Biotechnology Information (NCBI) (Barrett et al., 2007; acces-sion number GSE18318).
Statistical analysis of microarray data
The data were normalized with the GC RMA algorithm (Irizarry
et al., 2003) available in the Bioconductor package (Gentleman
and Carey, 2002). We performed a two-way ANOVA on the
nor-malized expression signals, which was modelled as follows: Yijk = μ
+ Gi + Nj + GNij + Eijk, where Y is the normalized expression signal
of a transcript for genotype i at nitrate supply j in replicate k, μ the global mean, Gi the genotypic effect, Nj the nitrate effect, GNij
the genotype×nitrate interaction effect, and Eijk are normally
dis-tributed zero-mean random errors. Due to the limited number of observations, the degree of freedom was too weak to perform tests based on the specific residual variance of each transcript. Thus, a global residual variance was calculated after the removal of the transcripts displaying extreme variation. Three contrasts were con-sidered to classify genes as responsive to the genotype effect inde-pendently of nitrate supply (G), responsive to nitrate supply across both genotypes (N), or not responsive to nitrate supply in the same way in both genotypes (G×N interaction). For each contrast, the test statistic was calculated from the global variance, and P-values were adjusted by the Bonferroni method, which controls the fam-ily-wise error rate (Ge et al., 2003). For a given contrast, a gene is declared differentially expressed if its adjusted P-value is lower than 0.05. A functional classification of the differentially expressed genes was visualized using MapMan version 3.5.0 (http://mapman.
gabipd.org/web/guest/mapman; Thimm et al., 2004; Tellstrom
et al., 2007).
Quantitative reverse-transcription PCR
A set of 18 genes identified as differentially expressed in roots was chosen for validation of Affymetrix genome arrays by quantita-tive reverse-transcription PCR (Supplementary Fig. S1 available at JXB online). Primer sequences are available in Supplementary a b c c a b c c a b c c a b c c a ab b b 0 200 400 600 800 1000 1200 1400 1600 Shoot dr y we ight per plant (mg) A WT-HN WT-LN TR185-HN TR185-LN a b bc c a b c d a bbc c a b c c a ab bc c 0 200 400 600 800 1000 1200 1400 1600 To
tal leaf area per plant (cm²
) B a a a a a b bc c a ab b b a b c c a ab ab b 0 50 100 150 200 250 300 350 7 10 14 21 28 Root dr y we ight per plant (mg)
Number of days from germination
C b b a a b b a a b b a a b b a a c bc ab a 0.00 0.05 0.10 0.15 0.20 0.25 0.30 0.35 7 10 14 21 28 RDW_TDW (mg.m g -1)
Number of days from germination
D
Fig. 2. Dry weight and leaf area of wild-type (WT) and mutant (TR185) plants under high (10 mM, HN) or low (1 mM, LN) nitrate supply from 7 to 28 days
after germination. (A) Shoot dry weight. (B) Total leaf area. (C) Root dry weight per plant. (D) Root-to-total dry weight ratio. Data are mean±SE from three biological replicates of six plants each. Different letters above the columns indicate significant difference based on multiple comparisons (P<0.05, LSD test).
at INRA Avignon on November 25, 2014
http://jxb.oxfordjournals.org/
Table S2 (available at JXB online). For each sample, 1 μg total RNA was treated with RQ1 DNAse (Promega) and reverse tran-scription was carried out using the IScript cDNA synthesis kit (BIO-RAD). Reactions were performed on a LC480 apparatus (Roche) using the GoTaq qPCR Mastermix (Promega). Three technical replicates were performed for each one of the three inde-pendent biological replicates. Relative expression levels were cal-culated according to the relative standard curve method (ΔCT) using Elongation Factor 1 and Ubiquitin genes as reference genes.
Results
Root architecture and N uptake
The highly branched root architecture of TR185 is associated with depressed growth irrespective of nitrate supply and is shoot determined
The root architecture of TR185 was highly branched under both high and low nitrate supply (Fig. 1). This resulted in a significantly higher LRN and significantly lower mean LRL compared with WT, throughout the growth period and irre-spective of nitrate supply (Fig. 1C and D). Despite this, TR185 had a similar total root length as WT plants (Fig. 1E). In WT plants, LRN decreased slightly with decreasing nitrate supply (Fig. 1C). An effect of decreased nitrate supply was
also observed on the LRL of the WT, with a transient signifi-cant decrease at the 7-day stage followed by an increase at the later stages (Fig. 1D).
TR185 displayed significantly lower SDW, RDW, and leaf area (LeafA) than WT as early as the 7- or 10-day stage
(Fig. 2A–C). These differences were associated throughout
the growth period with a higher root-to-total dry weight ratio in TR185 compared with WT (Fig. 2D). Both RDW and SDW of the WT were reduced with LN supply, whereas no significant decrease was observed in TR185.
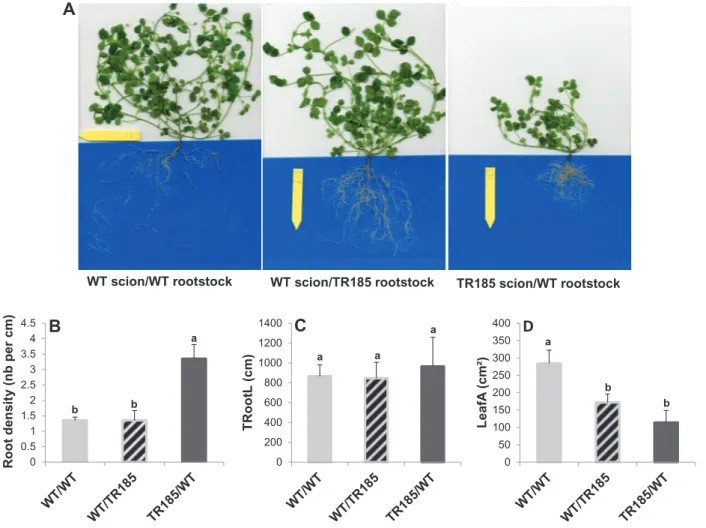
To determine whether the highly branched root archi-tecture of TR185 was shoot or root determined, this study performed grafting experiments (Fig. 3). Analysis of roots in the different grafting combinations revealed that the root architecture phenotype was graft transmissible from shoots
(Fig. 3A–C). The shoot leaf area was also most reduced with
TR185 as the scion (Fig. 3D).
Compared with WT, TR185 has reduced shoot N concentration and N-uptake efficiency
Up to the 14-day stage, %ShootN decreased continuously for both genotypes without significant difference between them (Fig. 4A). From the 21-day stage onwards, %ShootN became significantly lower in TR185 than in WT, and the
A
WT-HN
B
WT scion/WT rootstock WT scion/TR185 rootstock TR185 scion/WT rootstock
a a a 0 200 400 600 800 1000 1200 1400 TRootL (cm) a b b 0 50 100 150 200 250 300 350 400 Leaf A( cm²)
D
C
b b a 0 0.5 1 1.5 2 2.5 3 3.5 4 4.5 Root densit y (nb per cm )Fig. 3. Grafting experiments. (A) Representative 10-week old plants. (B) Lateral roots per length of primary root (root density). (C) Total root length
(TRootL). (D) Total leaf area (LeafA) of 10-week old plants. Data are mean±SE from three plants (this figure is available in colour at JXB online).
at INRA Avignon on November 25, 2014
http://jxb.oxfordjournals.org/
depressing effect of LN was significant for both genotypes. TR185 has lower %Shoot N than WT even when normalized to SDW measures (Supplementary Fig. S2 available at JXB online). Few differences in root N concentration (%RootN) were significant between the two genotypes (Fig. 4B). For both genotypes, %RootN decreased throughout the study period, especially under LN supply.
The N-uptake rate was significantly lower in TR185 than in WT, as soon as the 7-day stage and under both nitrate conditions (Fig. 4C). For both genotypes, NUR decreased throughout the growth period and, at the 28-day stage, was significantly lower under LN supply. Concerning the amount of leaf area produced per N acquired by the roots (NLA), significantly higher values were observed for TR185 from the 21-day stage onwards (Fig. 4D). From that stage, both geno-types had higher NLA values under LN than HN supply.
TR185 has lower ASN and GLN contents than WT
The levels of the 20 standard amino acids synthesized by plants were measured at 14 and 21 days. No differences in total free amino acid or glutamate (GLU) content in shoots were observed between TR185 and the WT or between LN and HN supply at the 14-day stage, whereas differences none significant but simi-lar to that observed in %ShootN appeared at the 21-day stage
(Fig. 5A, B). Six other amino acids did not show any significant
variations at the two stages considered (Supplementary Fig.
S3B–E, H–J available at JXB online). In contrast, significant
differences between the two genotypes in the contents of eight amino acids were observed as soon as the 14-day stage, with lower values for glutamine (GLN), proline (PRO), asparagine (ASN), and alanine (ALA) (Fig. 5C,D,F; Supplementary Fig. S3A available at JXB online) and higher values for threonine (THR), lysine (LYS), valine (VAL), and serine (SER), in TR185 compared with WT (Fig. 5G; Supplementary Fig. S3B,F availa-ble at JXB online). For three amino acids, aspartate (ASP), SER, and cysteine (CYS), a significant effect of N supply was observed
(Fig. 5E; Supplementary Fig. S3F, G available at JXB online).
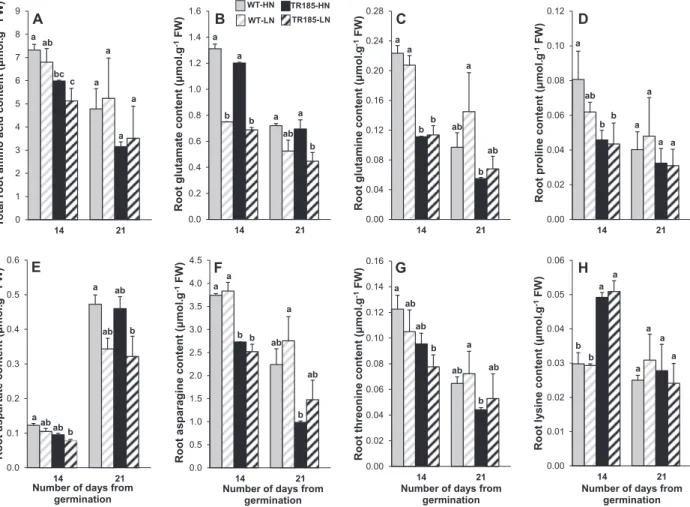
A lower total free amino acid content was observed in the roots of TR185 compared with WT roots (Fig. 6A). However, no sig-nificant differences were observed between TR185 and the WT for their root levels of GLU and ASP, and for both genotypes, the level of these two amino acids was lower under LN than under HN supply (Fig. 6B, E). By contrast, TR185 had a lower level of GLN and ASN, and no significant effect of N supply was observed for these two amino acids (Fig. 6C, F). A genotype effect was also observed for PRO, THR, and LYS, at least at the 14-day stage (Fig. 6D, G, H). Arginine (ARG), histidine (HIS), isoleu-cine (ILE), SER, phenylalanine (PHE), and all the derivatives of a a a a a a a a a cabbc a b b c a ab ab b 2.0 2.5 3.0 3.5 4.0 4.5 5.0 5.5 %S hoot N A WT-HN TR185-HN WT-LN TR185-LN ab b a b a a a a ab b a b b c a c a b a b 2.0 2.5 3.0 3.5 4.0 4.5 5.0 5.5 6.0 6.5 %RootN B a a b b a a b b a a b b a a b b a b bc 0.00 0.01 0.02 0.03 0.04 0.05 0.06 0.07 0.08 0.09 7 10 14 21 28 NUR (µmolN.c m -2.h -1)
Number of days from germination
C a a a a a a a a a a a a c bcab a c ab bc a 0 1 2 3 4 5 6 7 10 14 21 28 NL A (cm².mg-1)
Number of days from germination
D
Fig. 4. N concentration and efficiency of nitrogen accumulation into wild-type (WT) and mutant (TR185) plants under high (10 mM, HN) or low (1 mM,
LN) nitrate supply from 7 to 28 days after germination. (A and B) Shoot N concentration (A; %ShootN) and root N concentration (B; %RootN) estimated following the Dumas method. (C and D) N-uptake rate (C; NUR) and efficiency of N conversion into leaf area (D; NLA). Data are mean±SE from three biological replicates of six plants each. Different letters above the columns indicate significant difference based on multiple comparisons (P<0.05, LSD test).
at INRA Avignon on November 25, 2014
http://jxb.oxfordjournals.org/
pyruvate (ALA, VAL, LEU) did not show any significant varia-tions (Supplementary Fig. S4 available at JXB online).
Transcriptomic analysis
Most genes are differentially expressed in TR185 and WT
Global gene expression profiling of root cells using a micro-array analysis was conducted on both the WT and TR185 under HN and LN. The transcriptomic analysis was per-formed on the 10-day stage, at which the two genotypes were significantly different for most of the traits related to the root architecture or plant growth.
Significant hybridization in at least one root sample was found on 26 754 probe sets among the 61 278 tested (Filter based on signal values >4). Of these, 586 were differentially expressed; among them, 475 were differentially expressed in response to genotype effect (G) independently of nitrate supply, 156 in response to nitrate effect (N) across both genotypes, and 20 in response to G×N effect (Fig. 7A). Several of these genes were responsive to either two or three effects in common. Of the 168 transcripts responding to N or G×N effects, 77 were previously identified by Ruffel et al. (2008) to be regulated in WT roots in response to either local nitrate starvation (65 transcripts) or to systemic signals related to the plant N status (20 transcripts),
with eight in response to both signals (Supplementary Table S3
available at JXB online). Fifty-six of the common transcripts previously found to be upregulated in response to local nitrate starvation by Ruffel et al. (2008) were significantly upregulated in LN compared with HN. Altogether, these results confirmed that the LN treatment resulted in N limitation.
Using the MapMan software, an overall comparison of the main metabolic pathways highlights differential gene expres-sion between TR185 and WT in N acquisition and amino acid synthesis, cell-wall and lipid metabolism, and phenylpro-panoid and flavonoid biosynthetic pathways (Fig. 7B).
Most genes involved in N acquisition and assimilation are upregulated in TR185 compared with WT
Among the annotated transcripts differentially expressed in roots between TR185 and WT, 23 are involved in the N acqui-sition and assimilation pathway (Table 1). One of the most upregulated transcripts in TR185 encodes a putative nitrate transporter of the NRT2 family (Table 1). A transcript encod-ing a putative NRT1 nitrate transporter and two transcripts encoding putative ammonium transporters of AMT1 and AMT2 family were also more highly expressed in TR185. Concerning the ammonium assimilation, a transcript encod-ing a glutamate synthase was upregulated in TR185 under a a a a a a a a 0 2 4 6 8 10 12 14 21 To
tal shoot amino acid content (µmol.g
-1FW ) A a a a a a a a a 0.0 0.5 1.0 1.5 2.0 2.5 3.0 3.5 14 21
Shoot glutamate content (µmol.
g -1FW ) B WT-HN TR185-HN WT-LN TR185-LN a a b b a a a a 0.00 0.05 0.10 0.15 0.20 0.25 0.30 0.35 0.40 14 21 Shoot glutamine content (µmol. g -1FW ) C ab a b b a a a a 0.0 0.1 0.2 0.3 0.4 0.5 0.6 0.7 0.8 0.9 1.0 14 21
Shoot proline content (µmol.
g -1FW ) D ab c a bc a ab ab b 0.0 0.1 0.2 0.3 0.4 0.5 0.6 0.7 0.8 0.9 14 21
Shoot aspartate content (µmol.
g
-1FW
)
Number of days from germination E a a a a a ab ab b 0.0 0.5 1.0 1.5 2.0 2.5 3.0 3.5 4.0 14 21
Shoot asparagine content (µmol.
g
-1FW
)
Number of days from germination F b b a a a a a a 0.00 0.04 0.08 0.12 0.16 0.20 0.24 0.28 14 21
Shoot threonine content (µmol.
g
-1FW
)
Number of days from germination G b ababa a a a a 0.00 0.01 0.02 0.03 0.04 0.05 0.06 0.07 14 21 Shoot ly sinecontent (µmol. g -1FW )
Number of days from germination H
Fig. 5. Total amino acid content and contents of seven amino acids in wild-type (WT) and mutant (TR185) shoots, under high (10 mM, HN) or low (1 mM,
LN) nitrate supply at 14 and 21 days after germination. Data are mean±SE from three biological replicates of six plants each. Different letters above the columns indicate significant difference based on multiple comparisons (P<0.05, LSD test).
at INRA Avignon on November 25, 2014
http://jxb.oxfordjournals.org/
HN supply but downregulated under LN supply. A tran-script encoding a pyrroline-5-carboxylate synthetase, which is involved in conversion of GLU to PRO, was downregu-lated, in TR185 compared with WT, under HN supply and upregulated under LN supply. A transcript encoding a glu-tamate dehydrogenase was more highly expressed in TR185 than in the WT irrespective of nitrate supply. Two transcripts encoding an l-asparagine amidohydrolase involved in ASN
degradation were upregulated in TR185 compared with WT, whereas the expression of a transcript encoding a dihidropico-linate synthase involved in LYS synthesis was downregulated.
A differential expression between TR185 and WT was also observed for genes involved in the synthesis of organic acids which are required for N assimilation. Transcripts involved in starch degradation were upregulated in TR185 compared with WT, irrespective of N supply for those encoding beta-amylase and starch phosphorylase, and under HN supply only for one encoding a phosphoenolpyruvate carboxylase kinase. Differential expressions of transcripts encoding sugar transporters were observed also between TR185 and WT.
Genes involved in cell-wall and lipid metabolism are differentially expressed in TR185 and WT
Twenty-four of the annotated transcripts differentially expressed between TR185 and WT were found to be involved
in cell-wall modification or lipid metabolism (Fig. 7B; Table 2). Most of the transcripts encoding cell-wall-modifying enzymes, such expansins, pectinesterases, and polygalacturonases, were upregulated in TR185. Other notable changes in TR185 con-cerned differential expression of transcripts encoding cell-wall polysaccharide synthases, with downregulation of a cellulose synthase and upregulation of a callose synthase. Lastly, most of the transcripts encoding cell-wall arabinogalactan pro-teins or lipid-binding propro-teins were downregulated in TR185. Concerning the lipid metabolism, the main changes in expres-sion between TR185 and WT were the downregulation of transcripts related to fatty acid elongation and lipid synthesis and the upregulation of a transcript encoding a lipase.
Most genes involved in the phenylpropanoid pathway are upregulated in TR185 compared with WT
Twenty-three of the annotated transcripts differentially expressed between TR185 and WT were found to be involved in the phenylpropanoid and flavonoid pathways
(Fig. 7B; Table 3). A large number of transcripts involved
in lignin synthesis were repressed in TR185 compared with WT, including those encoding HCT and caffeoyl-CoA 3-O-methyltransferase. Conversely, a transcript encoding a chalcone synthase, which is a crucial flavonoid biosynthesis a ab bc c a a a a 0 1 2 3 4 5 6 7 8 9 14 21 To
tal root amino acid content (µmol.
g -1FW) A a b a b a ab a b 0.0 0.2 0.4 0.6 0.8 1.0 1.2 1.4 1.6 14 21
Root glutamate content (µmol.
g -1FW ) B WT-HNWT-LN TR185-HNTR185-LN a a b b ab a b ab 0.00 0.04 0.08 0.12 0.16 0.20 0.24 0.28 14 21
Root glutamine content (µmol.
g -1FW ) C a ab b b a a a a 0.00 0.02 0.04 0.06 0.08 0.10 0.12 14 21
Root proline content (µmol.
g -1FW ) D a ab ab b a ab ab b 0.0 0.1 0.2 0.3 0.4 0.5 0.6 14 21
Root aspartate content (µmol.
g
-1FW
)
Number of days from germination E a a b b ab a b ab 0.0 0.5 1.0 1.5 2.0 2.5 3.0 3.5 4.0 4.5 14 21 Root asparagine content (µmol. g -1FW )
Number of days from germination F a ab ab b ab a b ab 0.00 0.02 0.04 0.06 0.08 0.10 0.12 0.14 0.16 14 21
Root threonine content (µmol.
g
-1FW
)
Number of days from germination G b b a a a a a a 0.00 0.01 0.02 0.03 0.04 0.05 0.06 14 21 Root ly sine content (µmol. g -1FW )
Number of days from germination H
Fig. 6. Total amino acid content and contents of seven amino acids in wild-type (WT) and mutant (TR185) roots, under high (10 mM. [HN]) or low (1 mM.
[LN]) nitrate supply, and at 14 and 21 days after germination. At each date, data are means from three biological replicates of six plants each ± SE. Means followed by different letters are significantly different based on multiple comparisons (LSD test) at p < 0.05.
at INRA Avignon on November 25, 2014
http://jxb.oxfordjournals.org/
enzyme, and numerous transcripts involved in flavonol gly-coside synthesis were upregulated in TR185 compared with WT, independently of nitrate supply. Various transcripts involved in the anthocyanin pathway were also differentially expressed between TR185 and WT; with upregulation of the transcription factor ANL2 and downregulation of an antho-cyan-5-aromatic acyltransferase and a gene similar to tt12, both irrespective of nitrate supply.
Genes involved in hormone metabolism and transport are differentially expressed in TR185 and WT
Twenty-three of the annotated transcripts differentially expressed between TR185 and WT were found to be involved in hormone metabolism or transport (Table 4). The transcripts encoding auxin-induced or -binding proteins, among them an indole-3-acetic acid amido synthetase and an auxin efflux transporter similar to AtPin5, were mostly downregulated in
TR185 compared with WT. A transcript encoding a home-obox transcription factor similar to the transcription factor IFL of AtPIN1 was differentially expressed in response to G×N effect, with a lower expression in TR185 in response to LN only. Differential expression was also observed for vari-ous transcripts involved in the metabolism of cytokinin, with, in TR185 compared with WT, upexpression of a transcript involved in its degradation and downexpression of two tran-scripts possibly involved in its signalling. An upregulation of a gene encoding an ethylene-responsive transcription factor and a downregulation of transcripts involved in gibberellin synthesis or signalling were also observed in TR185. Lastly, two main genes involved in jasmonate metabolism were also differentially regulated between TR185 and WT, with down-regulation of transcripts encoding the lipoxygenase AtLOX1 and upregulation of transcripts encoding the lipoxygenase AtLOX5. 46 5 3 6 418 6 102 N Effect G Effect GxN Effect
A
B
Fig. 7. Comparisons of mutant (TR185) and wild-type (WT) transcriptomes. (A) Venn diagram of transcripts identified as differentially expressed in
roots in response to genotype effect (G), to nitrate supply across both genotypes (N), or to genotype according to nitrate supply (G×N interaction). (B) Overall picture of gene expression changes in roots between TR185 and WT in the main metabolic pathways. This MapMan representation is based on annotations of Medicago_AFFY_09 M. truncatula microarrays. Only transcripts significantly differentially expressed are shown. Differential values are expressed in a log2 scale. Transcripts differentially expressed by more than the threshold value of 1 are shown in colour; red for upregulated and blue for downregulated in TR185; in both cases with a colour scale representing the intensity of up- or downregulation. Absent transcripts are shown in grey.
at INRA Avignon on November 25, 2014
http://jxb.oxfordjournals.org/
Discussion
The size and architecture of the root system determine the surface area of exchange between roots and the soil medium, and both are known to adapt in response to fluctuations of nutrient availability. Among the key nutrients, NO3– is well
known to markedly affect root system architecture. This work reports a new highly branched M. truncatula mutant, TR185, which lacks the capacity to adapt root architecture to nitrate supply and shows an unexpectedly low nitrogen acquisition. TR185 was selected among various gamma-ray mutants because of its highly branched root phenotype and expected enhanced nitrogen acquisition; its numerous young roots, which had not yet developed strong lignin bar-riers, were predicted to exploit more efficiently the soil for uptake of both water and nutrients (Steudle and Peterson,
1998; Naseer et al., 2012). However, the current study
dem-onstrated that TR185 displayed N-limited responses; under both LN and HN supply, TR185 was depressed in shoot and root dry weight and had a preferential dry weight allocation
to roots at the expense of shoots compared with WT. The suboptimal N nutrition of TR185 became evident as the growth cycle progressed, as from the 21-day stage, TR185 had lower %ShootN than the WT at both nitrate condi-tions. Furthermore, its low NUR and high amount of leaf area produced per N acquired were both typical for plants under very low N status (Larigauderie et al., 1994; Moreau
et al., 2012). In Arabidopsis, root N uptake and architecture are both known to be regulated by external N supply and internal N demand. Based on these well-known responses in
Arabidopsis, the current work investigated whether TR185
is impaired in either local acquisition/perception of nitrate availability or in systemic regulation by nitrogen status of the whole plant.
Molecular studies in Arabidopsis have highlighted that nitrate per se is a signal leading to upregulation of N trans-porters and thus N acquisition in plants that have been previ-ously N starved (Lejay et al., 1999; Wang et al., 2003; Scheible
et al., 2004; Bi et al., 2007). The localized stimulatory effect of external nitrate on LR elongation and/or emergence has
Table 1. Differentially accumulated transcripts between TR185 and wild type, annotated as related to N-acquisition pathway
Average Affymetrix GeneChip normalized expression values across three biological replicates for the mutant TR185 and the wild type in high and low N conditions. G, N, and G×N indicate transcripts responsive to genotype, nitrate, and genotype×nitrate effect, respectively (adjusted
P-values <0.05). G* indicates a transcript responsive to G effect only under HN condition. N* indicates a transcript responsive to N effect only for
the wild type. G and G indicate upregulation and downregulation, respectively, in TR185 compared with the wild type.
Target identifier Annotation MHN MLN WTHN WTLN Effect
Putative nitrate transporters
Mtr.44342.1.s1_at NRT2 Nitrate transporter 5.13 4.15 2.76 3.19 G Mtr.47690.1.s1_s_at NRT1 Nitrate transporter 7.10 6.97 6.19 5.81 G Ammonium transporters
Mtr.1706.1.s1_s_at AMT1 transporter 7.78 8.54 6.75 7.43 G Mtr.25576.1.S1_at AMT2 transporter 7.60 7.11 5.89 5.21 G Ammonium assimilation
Mtr.33664.1.s1_at Ferredoxin-dependent glutamate synthase 4.53 3.60 3.58 4.55 G×N Mtr.42847.1.s1_at Pyrroline-5-carboxylate synthetase 8.80 9.58 9.83 8.66 G×N Mtr.43170.1.s1_s_at Glutamate deshydrogenase 11.81 12.07 11.04 10.90 G Mtr.25985.1.s1_at Putative l-asparagine amidohydrolase 14.05 13.66 12.57 12.76 G
Msa.1503.1.s1_at Putative l-asparagine amidohydrolase 12.92 12.80 11.40 11.72 G
Mtr.39486.1.s1_at Dihydrodipicolinate synthase 3.27 4.48 6.19 6.77 G Putative amino acid transporters
Mtr.12447.1.s1_at Proline transporter 9.30 9.68 10.30 10.63 G Mtr.31521.1.s1_at Lysine histidine transporter 8.03 8.52 6.77 6.99 G Mtr.38963.1.s1_at Amino acid transporter 5.82 6.28 4.74 5.43 G Putative peptide transporters
Mtr.7014.1.s1_at NRT1 peptide transporter 9.21 9.63 8.22 8.62 G Mtr.48790.1.s1_at Proton-dependent oligopeptide transporter 5.15 4.42 3.92 3.50 G Organic acid metabolism
Mtr.32662.1.s1_at beta-Amylase 7.24 7.39 6.25 6.30 G Mtr.13958.1.s1_at beta-Amylase 6.87 7.13 5.82 5.73 G Mtr.12555.1.s1_at Starch phosphorylase 5.15 5.07 3.41 3.97 G Mtr.23663.1.S1_at Phosphoenolpyruvate carboxylase kinase 7.45 6.57 5.94 7.53 N* G×N Sugar transporters
Mtr.12578.1.s1_at Malate transporter 10.85 11.33 9.95 10.32 G Mtr.33536.1.s1_at Sugar transporter 5.47 4.89 4.10 5.24 G* Mtr.19796.1.s1_at Glucose transporter 7.65 8.58 8.97 9.37 G Msa.905.1.S1_at Leghaemoglobin MtLb1 6.51 6.64 6.04 4.37 G
at INRA Avignon on November 25, 2014
http://jxb.oxfordjournals.org/
also been thoroughly investigated (Zhang and Forde, 1998;
Remans et al., 2006a; Krouk et al., 2010; Gojon et al., 2011).
Nitrate has been demonstrated to be itself the signal for the stimulation of LR emergence (thus LR number) and elonga-tion. This stimulation has been associated with an enhanced auxin accumulation in apex of root primordia in newly emerged LRs and has been shown to involve both ANR1 and NRT1.1 genes. In the current study, microarray analysis revealed an upregulation of various transcripts belonging to NO3– or NH4+ transporters families in TR185 compared with
WT. Such upregulation occurred irrespective of N supply and could thus indicate a permanent local perception of high nitrate availability in the mutant. However, this upregulation did not increase either root amino acid content or %RootN in TR185 compared with WT. Furthermore, no effect of nitrate supply on LR elongation or number was observed in TR185. Moreover, its highly branched root architecture is not rep-resentative of plants impaired in local perception of nitrate; its reduced responsiveness differed from that observed in
nrt1.1 mutants or ANR1-repressed lines of Arabidopsis, in
which LR number was never higher than in the WT even under high nitrate availability. Taken together, these molecu-lar and developmental responses of TR185 to N availability
indicate that its highly branched root system architecture is not mainly induced by an impaired local perception of nitrate availability.
Besides the local stimulatory effect of nitrate, a feed-back repression is known to be exerted by high N status of the whole plant, which downregulates high-affinity N transporters, whereas N starvation results in the opposite response. Specific members of the NRT2 and AMT1 fami-lies in Arabidopsis and MtNRT2 genes in M. truncatula are known to be involved in this response (Loque et al., 2006;
Yuan et al., 2007; Ruffel et al., 2008; Okamoto et al., 2009;
Girin et al., 2010). A systemic repression of LR
devel-opment by the high N status of the plant has also been described in Arabidopsis. A nitrate-dependent signalling pathway controlling LR elongation has been described, in which nitrate supply above 10 mM blocks the elongation of LR post emergence in response to a high shoot nitrate accumulation (Zhang et al., 1999; Zhang and Forde, 2000;
Remans et al., 2006b). More recently, an additional
signal-ling pathway has been pointed out, in which LR emergence is controlled by N-assimilation products. According to
Gifford et al. (2008), GLN is the predominant signal
regu-lating repression of LR emergence, but an inhibition of
Table 2. Differentially accumulated transcripts between TR185 and wild type, annotated as related to cell-wall modification
Average Affymetrix GeneChip normalized expression values across three biological replicates for the mutant TR185 and the wild type in high and low N conditions. G and N indicate transcripts responsive to genotype and nitrate effect, respectively (adjusted P-values <0.05). G and G indicate upregulation and downregulation, respectively, in TR185 compared with the wild type.
Target identifier Annotation MHN MLN WTHN WTLN Effect
Cell-wall-modifying enzymes
Mtr.9830.1.s1_at Expansin 8.23 7.88 6.86 7.37 G
Mtr.20107.1.s1_at Expansin-related protein precursor 8.04 7.73 9.31 8.87 G
Mtr.22752.1.s1_s_at Expansin 9.64 9.93 8.82 8.74 G Mtr.4467.1.s1_at Pectinesterase 11.16 10.88 10.15 9.08 G Mtr.274.1.s1_at Pectinesterase 7.54 7.79 6.78 5.86 G Mtr.7581.1.s1_s_at Pectinesterase 9.13 8.88 8.36 7.33 G Mtr.41480.1.s1_at Polygalacturonase 6.65 7.55 5.86 6.33 G Mtr.4713.1.s1_at Lyase 5.39 5.93 4.75 4.51 G Mtr.39445.1.s1_at Polygalacturonase 6.93 8.04 8.13 8.79 G, N Mtr.43680.1.s1_at Dehydration-induced protein 7.07 8.07 8.41 8.78 G Cell-wall polysaccharides
Mtr.28768.1.s1_at Cellulose synthase 6.46 6.83 7.56 8.00 G Mtr.17447.1.s1_at Callose synthase 5.47 5.42 3.69 4.81 G Cell-wall arabinogalactan proteins
Mtr.18563.1.s1_at Fasciclin-like arabinogalactan protein 6.88 7.55 7.98 8.56 G Mtr.51607.1.s1_at Fasciclin-like arabinogalactan protein 10.26 11.14 11.47 11.95 G Mtr.50900.1.s1_at Fasciclin-like arabinogalactan protein 8.82 9.53 9.79 10.46 G Mtr.10992.1.s1_at Fasciclin-like arabinogalactan protein 10.13 10.82 11.17 11.77 G Mtr.18380.1.s1_at Fasciclin-like arabinogalactan protein 9.05 9.69 10.05 10.76 G Mtr.50897.1.s1_at Fasciclin-like arabinogalactan protein 6.81 7.51 7.95 8.60 G Mtr.13136.1.s1_at Fasciclin-like arabinogalactan protein 9.09 9.82 10.19 10.75 G Mtr.32740.1.S1_at Lipid-binding protein 10.45 9.68 8.99 9.00 G Mtr.37476.1.S1_at Lipid-binding protein 8.35 8.84 9.73 9.39 G Lipid metabolism
Mtr.12519.1.s1_at beta-Ketoacyl-CoA synthase 4.88 5.11 5.82 6.17 G Mtr.41116.1.s1_at Acyl carrier protein 3.59 3.66 5.08 4.68 G
Mtr.12518.1.s1_at Lipase 11.47 11.86 10.55 10.74 G
at INRA Avignon on November 25, 2014
http://jxb.oxfordjournals.org/
root growth by ASN was also shown by Ivanov et al. (2012)
and its possible role as an N-satiety signal suggested. In the current study, molecular and developmental analy-ses converge to indicate that the mutant could perceive a permanent N-starvation signal, which induced modifi-cation of root N acquisition and architecture compared with WT. Indeed, the upregulation of root N transport-ers in TR185 compared with WT could be characteristic of the N-starvation status in the mutant. Importantly, the decreased GLN and ASN root content in TR185 com-pared with WT could explain its highly branched root architecture in agreement with Gifford et al. (2008) and
Ivanov et al. (2012). Grafting experiments revealed that
the highly branched root phenotype in TR185 was trans-missible from shoots and not from roots (Fig. 3), thus rein-forcing the hypothesis of phloem transport of a signal in the mutant. As the GLN and ASN shoot contents were also lower in TR185 than in the WT, the signal could be the low GLN/ASN phloem content itself. The hypothesis does not exclude a possible higher degradation in roots of these two major N-storage forms, as suggested by the observed differential expression of transcripts involved in
ammonium assimilation. As such, the lower root content of GLN and ASN could be related to the upregulation of a glutamate synthase and a putative l-asparagine
amido-hydrolase respectively in TR185 compared with WT. Additional analyses of expression of genes involved in cell-wall modification, phenylpropanoid pathway, and hor-mone transport confirmed that TR185 plants were under N starvation and provided further explanation of their root architecture. Most of the genes involved in cell-wall deg-radation were upregulated in TR185 compared with WT, whereas those involved in cell-wall synthesis were downreg-ulated. Such modifications have been previously observed for Lotus japonicus in N-starvation conditions (Omrane
et al., 2009). Most of the transcripts encoding cell-wall arabinogalactan proteins were downregulated in TR185, in agreement with the reduced root elongation observed in Arabidopsis AGP-defective mutants (van Hengel and
Roberts, 2002; Shi et al., 2003; Seifert and Roberts, 2007).
Widespread differential expression of transcripts for the phenylpropanoid pathway was also observed between the two genotypes. The phenylpropanoid pathway serves as a rich source of metabolites in plants, being required for the
Table 3. Differentially accumulated transcripts between TR185 and wild type, annotated as related to phenylpropanoid pathway
Average Affymetrix GeneChip normalized expression values across three biological replicates for the mutant TR185 and the wild type in high and low N conditions. G, N, and G×N indicate transcripts responsive to genotype, nitrate, and genotype×nitrate effect, respectively (adjusted
P-values <0.05). G and G indicate upregulation and downregulation, respectively, in TR185 compared with the wild type.
Target identifier Annotation MHN MLN WTHN WTLN Effect
Phenylpropanoid pathway
Mtr.40166.1.s1_s_at Phenylalanine ammonia-lyase 10.39 11.19 9.46 10.18 G Mtr.12988.1.s1_at 4-Coumarate-CoA ligase 6.64 6.68 7.54 7.71 G Lignin pathway
Mtr.20618.1.s1_s_at Transferase family protein (HCT) 5.94 7.29 7.58 7.86 G Mtr.4076.1.s1_at Caffeoyl-CoA 3-O-methyltransferase 5.45 5.80 6.22 6.95 G Mtr.40942.1.s1_at Caffeoyl-CoA 3-O-methyltransferase 4.26 4.52 5.36 5.39 G Mtr.10331.1.s1_at Isoflavone-O- methyltransferase 9.49 9.80 10.44 10.79 G Mtr.51214.1.s1_at O-Methyltransferase 3.21 3.42 3.97 4.75 G Flavonoid pathway
Mtr.49423.1.s1_at Chalcone synthase 5.01 4.81 4.15 3.22 G Dihydroflavonol pathway
Mtr.20354.1.S1_at UDP-Glucose flavonol 3-O-glucosyltransferase 7.81 7.03 6.09 5.46 G Mtr.28721.1.s1_at UDP-Glucose flavonol 3-O-glucosyltransferase 6.46 6.06 5.32 5.25 G Mtr.44246.1.S1_at UDP-Glucose flavonol 3-O-glucosyltransferase 6.15 5.29 4.89 3.97 G Mtr.27374.1.S1_at UDP-Glucosyltransferase 6.82 6.33 4.94 5.39 G Mtr.37046.1.s1_at UDP-Glucosyltransferase 8.45 7.81 7.37 6.82 G
Mtr.9669.1.s1_at Transferase 7.77 7.10 6.61 6.35 G
Mtr.27554.1.s1_at Transferase 6.94 6.37 5.83 5.23 G Mtr.29306.1.s1_at Transferase 8.30 8.92 7.19 7.58 G Mtr.10626.1.s1_at Flavonol synthase/flavanone 3-hydroxylase 11.62 11.40 10.88 10.21 G Mtr.14782.1.s1_at Flavonoid biosynthetic process DMR6 5.54 5.20 4.17 4.75 G Anthocyanin pathway
Mtr.31382.1.s1_at Dihydroflavonol 4-reductase 7.99 8.72 8.97 7.72 G×N Mtr.30762.1.s1_at Anthocyanin 5-aromatic acyltransferase 4.90 5.37 6.31 6.03 G Mtr.43878.1.s1_at Anthocyaninless2 transcription factor 7.83 6.97 6.29 5.95 G Mtr.35206.1.s1_at Anthocyaninless2 transcription factor 6.41 5.59 4.65 4.34 G Mtr.2481.1.S1_at Protein Transparent Testa 12 2.87 3.62 3.34 5.03 G N
at INRA Avignon on November 25, 2014
http://jxb.oxfordjournals.org/
biosynthesis of both lignin and many other important com-pounds such as the flavonoids (Fraser and Chapple, 2011). A large number of genes involved in lignin synthesis were repressed in TR185, whereas transcripts encoding a chal-cone synthase or involved in flavonol glycoside synthesis were upregulated. The slightly lower root lignin content observed in TR185 compared with WT was in agreement with these results (Supplementary Fig. S5 available at JXB online). The higher expression in TR185 of genes involved in flavonoid synthesis support the hypothesis that the mutant was under permanent N starvation, in agreement with previous observations in L. japonicus roots (Omrane
et al., 2009). Flavonoid accumulation is known to decrease polar auxin transport, inducing a deregulation of LR elon-gation and thus short root architecture (Peer et al., 2004;
Peer and Murphy, 2007; Laffont et al., 2010). Interestingly,
most of the transcripts encoding auxin-induced or -bind-ing proteins or related to the auxin efflux transporters PIN were downregulated in TR185 compared with WT, sug-gesting a decreased root auxin accumulation or transport. Differentially expressed genes between TR185 and WT related to other hormones could also explain TR185 root
architecture, in particular the upregulation of a transcript involved in cytokinin degradation and, thus, enhanced LR initiation (Laplaze et al., 2007) and the downregulation of transcripts involved in GA synthesis, which depressed root elongation (Beemster and Baskin, 2000; Achard et al.,
2003; Benkova and Hejatko, 2009).
In conclusion, the mutant TR185 displayed highly branched root architecture and impaired N acquisition, both irrespective of nitrate supply. Physiological and devel-opmental analyses of its responses to N supply suggested that the root architecture of TR185 results from a systemic regulation by the plant nitrogen status, possibly involv-ing GLN or ASN signals. Altered expression of genes of the phenylpropanoid pathway could also explain its root architecture. Further studies are needed both to determine in which gene the mutation occurred and fully understand the TR185 phenotype under conditions when it is relying exclusively on symbiotic N fixation for its N acquisition. Such results will identify the genes and physiological mech-anisms that regulate legume root architecture and activity as a function of plant N status and give new targets for legume breeding.
Table 4. Differentially accumulated transcripts between TR185 and wild type, annotated as related to hormone metabolism and
transport
Average Affymetrix GeneChip normalized expression values across three biological replicates for the mutant TR185 and the wild type in high and low N conditions. G, N, and G×N indicate transcripts responsive to genotype, nitrate, and genotype×nitrate effect, respectively (adjusted
P-values <0.05). G and G indicate upregulation and downregulation, respectively, in TR185 compared with the wild type.
Target identifier Annotation MHN MLN WTHN WTLN Effect
Auxin metabolism
Mtr.6663.1.s1_at Indole-3-acetic acid amido synthetase 6.63 5.73 5.19 5.07 G Mtr.45413.1.s1_at Indole-3-acetic acid-amido synthetase 2.57 2.57 3.62 3.42 G Mtr.14314.1.S1_at Auxin-induced protein 5NG4 4.41 4.76 5.43 6.51 G Mtr.39011.1.S1_at Auxin-binding protein ABP19b precursor 8.04 8.60 9.26 9.49 G Mtr.49764.1.s1_at Auxin:hydrogen symporter similar to AtPin5 2.08 2.16 3.04 3.39 G Mtr.49221.1.s1_at Transcription factor similar to IFL 4.89 4.11 3.55 4.68 G×N Mtr.11046.1.s1_at Transcription factor similar to AtHB2 5.79 4.88 4.58 3.96 G Cytokinin metabolism
Mtr.11675.1.s1_at Cytokinin dehydrogenase 6.01 6.91 5.25 5.62 G Mtr.38123.1.s1_at Transcription factor similar to APRR2 4.20 4.16 5.07 5.90 G Mtr.8550.1.S1_s_at Oxygen transporter activity 6.63 8.34 8.39 9.12 G N Ethylene metabolism
Mtr.21627.1.s1_at Ethylene-responsive transcription factor 7.53 6.65 6.08 5.89 G Gibberelin metabolism
Mtr.6537.1.s1_s_at Gibberellin 20-oxidase 6.73 7.25 7.87 8.01 G Mtr.26011.1.s1_at Gibberellin 20 oxidase 1-B 6.50 6.78 7.65 7.78 G Mtr.7253.1.s1_at Gibberellin-regulated family protein 6.11 6.25 7.95 7.61 G Mtr.47463.1.s1_at Scarecrow transcription factor family protein 3.24 3.77 4.28 4.76 G Jasmonate metabolism
Mtr.46868.1.s1_s_at Lipoxygenase similar to AtLOX1 11.50 11.92 12.68 12.67 G Mtr.46870.1.s1_at Lipoxygenase similar to AtLOX1 10.33 11.03 11.60 11.84 G Mtr.46864.1.s1_at Lipoxygenase similar to AtLOX1 4.61 5.03 6.19 5.81 G Mtr.50426.1.s1_at Lipoxygenase similar to AtLOX1 4.69 5.47 6.07 5.77 G Mtr.8427.1.s1_at Lipoxygenase similar to AtLOX1 4.54 5.73 6.45 6.53 G Mtr.20079.1.s1_at Lipoxygenase similar to AtLOX1 2.88 2.99 3.20 4.36 G Mtr.3795.1.s1_at Lipoxygenase similar to AtLOX5 4.64 5.70 4.17 4.10 G Mtr.8452.1.s1_at Lipoxygenase similar to AtLOX5 5.60 4.73 4.34 3.97 G
at INRA Avignon on November 25, 2014
http://jxb.oxfordjournals.org/
Supplementary material
Supplementary data are available at JXB online.
Supplementary Fig. S1. Quantitative reverse-transcription
PCR validation of differentially accumulated transcripts ini-tially identified by Affymetrix GeneChip analysis.
Supplementary Fig. S2. Relationship between shoot N
concentration and shoot dry weight.
Supplementary Fig. S3. Contents of 10 amino acids in
wild-type and mutant shoots under high and low nitrate sup-ply at 14 and 21 days after germination.
Supplementary Fig. S4. Contents of eight amino acids in
wild-type and mutant roots under high and low nitrate supply at 14 and 21 days after germination.
Supplementary Fig. S5. Root lignin content of the wild
type and the mutant under high and low nitrate supply at 14 and 21 days after germination.
Supplementary Table S1. Genetic analysis of the highly
branched root mutant TR185.
Supplementary Table S2. Primers used for quantitative
reverse-transcription PCR.
Supplementary Table S3. The 75 differentially accumulated
transcripts responsive to N supply and common to those identified by Ruffel et al. (2008) as responsive to either local nitrate starvation or systemic signals.
Acknowledgements
The authors thank Estelle Carteret, Arnaud Bartet, and Sébastien Brenot of the Experimental Unit for their technical support for the experiment in growth chamber. Anne-Lise Santoni of the UMR Agroécologie is acknowl-edged for the nitrogen concentration analyses, and Catherine Bonnefoy for her help in the grafting experiment. This work was supported by INRA (AgroBI programme) and the Burgundy Council (PARI-Agrale6 pro-gramme). The authors thank Richard Thompson for his critical reading of the manuscript and the anonymous referees for their constructive criticisms.
References
Achard P, Vriezen WH, Van Der Straeten D, Harberd NP. 2003.
Ethylene regulates Arabidopsis development via the modulation of DELLA protein growth repressor function. The Plant Cell 15, 2816–2825. Barrett T, Troup DB, Wilhite SE, Ledoux P, Rudnev D, Evangelista C, Kim IF, Soboleva A, Tomashevsky M, Edgar R. 2007. NCBI GEO:
mining tens of millions of expression profiles—database and tools update.
Nucleic Acids Research 35, D760–D765.
Beemster GTS, Baskin TI. 2000. STUNTED PLANT 1 mediates effects
of cytokinin, but not of auxin, on cell division and expansion in the root of arabidopsis. Plant Physiology 124, 1718–1727.
Benkova E, Hejatko J. 2009. Hormone interactions at the root apical
meristem. Plant Molecular Biology 69, 383–396.
Bi YM, Wang RL, Zhu T, Rothstein SJ. 2007. Global transcription
profiling reveals differential responses to chronic nitrogen stress and putative nitrogen regulatory components in Arabidopsis. BMC Genomics
8, 281.
Bourion V, Laguerre G, Depret G, Voisin AS, Salon C, Duc G. 2007.
Genetic variability in nodulation and root growth affects nitrogen fixation and accumulation in pea. Annals of Botany 100, 589–598.
Bourion V, Rizvi SMH, Fournier S, de Larambergue H, Galmiche F, Marget P, Duc G, Burstin J. 2010. Genetic dissection of nitrogen
nutrition in pea through a QTL approach of root, nodule, and shoot variability. Theoretical and Applied Genetics 121, 71–86.
Bright LJ, Liang Y, Mitchell DM, Harris JM. 2005. The LATD gene of
Medicago truncatula is required for both nodule and root development. Molecular Plant–Microbe Interactions 18, 521–532.
Brun F, Richard-Molard C, Pages L, Chelle M, Ney B. 2010. To what
extent may changes in the root system architecture of Arabidopsis thaliana grown under contrasted homogenous nitrogen regimes be explained by changes in carbon supply? A modelling approach. Journal of Experimental
Botany 61, 2157–2169.
de Billy F, Grosjean C, May S, Bennett M, Cullimore JV. 2001.
Expression studies on AUX1-like genes in Medicago truncatula suggest that auxin is required at two steps in early nodule development. Molecular
Plant–Microbe Interactions 14, 267–277.
Fraser CM, Chapple C. 2011. The phenylpropanoid pathway in
Arabidopsis. The Arabidopsis Book/American Society of Plant Biologists 9,
e0152–e0152.
Frugier F, Kosuta S, Murray JD, Crespi M, Szczyglowski K. 2008.
Cytokinin: secret agent of symbiosis. Trends in Plant Science 13, 115–120. Fu XD, Harberd NP. 2003. Auxin promotes Arabidopsis root growth by
modulating gibberellin response. Nature 421, 740–743.
Fukushima RS, Hatfield RD. 2001. Extraction and isolation of lignin for
utilization as a standard to determine lignin concentration using the acetyl bromide spectrophotometric method. Journal of Agricultural and Food
Chemistry 49, 3133–3139.
Gagnot S, Tamby JP, Martin-Magniette ML, Bitton F, Taconnat L, Balzergue S, Aubourg S, Renou JP, Lecharny A, Brunaud V. 2008.
CATdb: a public access to Arabidopsis transcriptome data from the URGV-CATMA platform. Nucleic Acids Research 36, D986–D990. Ge YC, Dudoit S, Speed TP. 2003. Resampling-based multiple testing
for microarray data analysis. Test 12, 1–77.
Gentleman R, Carey V. 2002. Bioconductor. R News 2, 11–16. Gifford ML, Dean A, Gutierrez RA, Coruzzi GM, Birnbaum KD.
2008. Cell-specific nitrogen responses mediate developmental plasticity.
Proceedings of the National Academy of Sciences, USA 105, 803–808. Girin T, El-Kafafi ES, Widiez T, Erban A, Hubberten HM, Kopka J, Hoefgen R, Gojon A, Lepetit M. 2010. Identification of Arabidopsis
mutants impaired in the systemic regulation of root nitrate uptake by the nitrogen status of the plant. Plant Physiology 153, 1250–1260.
Gojon A, Krouk G, Perrine-Walker F, Laugier E. 2011. Nitrate
transceptor(s) in plants. Journal of Experimental Botany 62, 2299–2308. Gonzalez-Rizzo S, Crespi M, Frugier F. 2006. The Medicago truncatula
CRE1 cytokinin receptor regulates lateral root development and early symbiotic interaction with Sinorhizobium meliloti. The Plant Cell 18,
2680–2693.
Ikram S, Bedu M, Daniel-Vedele F, Chaillou S, Chardon F. 2012.
Natural variation of Arabidopsis response to nitrogen availability. Journal of
Experimental Botany 63, 91–105.
Irizarry RA, Hobbs B, Collin F, Beazer-Barclay YD, Antonellis KJ, Scherf U, Speed TP. 2003. Exploration, normalization, and summaries
of high density oligonucleotide array probe level data. Biostatistics 4,
249–264.
Ivanov A, Kameka A, Pajak A, Bruneau L, Beyaert R, Hernandez-Sebastia C, Marsolais F. 2012. Arabidopsis mutants lacking
asparaginases develop normally but exhibit enhanced root inhibition by exogenous asparagine. Amino Acids 42, 2307–2318.
Jin J, Watt M, Mathesius U. 2012. The autoregulation gene SUNN
mediates changes in root organ formation in response to nitrogen through alteration of shoot-to-root auxin transport. Plant Physiology 159, 489–500. Kiba T, Kudo T, Kojima M, Sakakibara H. 2011. Hormonal control of
nitrogen acquisition: roles of auxin, abscisic acid, and cytokinin. Journal of
Experimental Botany 62, 1399–1409.
Kraft JM, Boge W. 2001. Root characteristics in pea in relation to
compaction and fusarium root rot. Plant Disease 85, 936–940. Krouk G, Lacombe B, Bielach A, et al. 2010. Nitrate-regulated auxin
transport by NRT1.1 defines a mechanism for nutrient sensing in plants.
Developmental Cell 18, 927–937.
Krusell L, Madsen LH, Sato S, et al. 2002. Shoot control of root
development and nodulation is mediated by a receptor-like kinase. Nature
420, 422–426.
Laffont C, Blanchet S, Lapierre C, Brocard L, Ratet P, Crespi M, Mathesius U, Frugier F. 2010. The Compact Root Architecture1 gene
regulates lignification, flavonoid production, and polar auxin transport in
Medicago truncatula. Plant Physiology 153, 1597–1607.
at INRA Avignon on November 25, 2014
http://jxb.oxfordjournals.org/