Characterization and Application of Vortex Flow Adsorption for
Simplification of Biochemical Product Downstream Processing
by
J
UNFENM
AB.S., Chemical Engineering, Tsinghua University, 1995 M.S., Chemical Engineering, Tsinghua University, 1998
M.S., Chemical Engineering Practice, Massachusetts Institute of Technology, 2000 SUBMITTED TO THE DEPARTMENT OF CHEMICAL ENGINEERING IN PARTIAL FULLFILLMENT OF THE REQUIREMENTS FOR THE DEGREE OF
DOCTOR OF PHILOSOPHY IN CHEMICAL ENGINEERING AT THE
MASSACHUSETTS INSTITUTE OF TECHNOLOGY SEPTEMBER 2003
© 2003 Massachusetts Institute of Technology. All rights reserved.
Signature of Author: ___________________________________________________________ Department of Chemical Engineering
July 10, 2003
Certified by: __________________________________________________________________ Charles L. Cooney Professor of Chemical and Biochemical Engineering Thesis Supervisor
Accepted by__________________________________________________________________ Daniel Blankschtein Professor of Chemical Engineering Chairman, Committee for Graduate Students
Characterization and Application of Vortex Flow Adsorption for Simplification of Biochemical Product Downstream Processing
by Junfen Ma
Submitted to the Department of Chemical Engineering on July 10, 2003 in Partial Fulfillment of the Requirements for the Degree of
Doctor of Philosophy in Chemical Engineering
Abstract
One strategy to reduce costs in manufacturing a biochemical product is simplification of downstream processing. Biochemical product recovery often starts from fermentation broth or cell culture. In conventional downstream processing, the initial steps are clarification, concentration, and purification. Simplification of downstream processing may be achieved by reducing the number of unit operations. Integrative technologies seek to combine steps into a new single unit operation, thereby tightening the whole process.
Vortex flow occurs in the annular gap between an inner rotating solid cylinder and an outer stationary cylindrical shell. Above a critical rotation rate, circular Couette flow bifurcates to a series of counter-rotating toroidal vortices. By suspending adsorbent resin in the vortices, a novel unit operation, vortex flow adsorption (VFA), is created. In VFA, the rotation of the inner cylinder facilitates the fluidization of the adsorbent resin. In addition, VFA has high fluid voidage so that it can be used to recover biochemical products directly from fermentation broths or cell homogenates without removing cells or cell debris first.
VFA was characterized through two experimental approaches, tracer residence time distribution (RTD) study and breakthrough capacity measurements, and two modeling approaches, a one-dimensional dispersion convective model and a two-region vortex flow model. It was concluded that the axial dispersion in the vortex flow system is distinct in different vortex flow regimes. The effect of the operating variables, including the rotation rate of the inner cylinder, the axial loading flowrate, and the adsorbent volume fraction, on the performance of VFA was explored.
In this research, recombinant human α1-antitrypsin (α1-AT) was expressed in
Escherichia coli as a C-terminal fusion to a modified intein containing a chitin-binding domain.
The VFA results indicated that VFA not only captures the fusion protein from crude cell extract containing cell debris but also purifies α1-AT. Therefore, vortex flow adsorption is an integrative technology to combine the primary clarification, concentration, and purification steps to simplify conventional downstream processing.
Thesis Supervisor: Charles L. Cooney
Acknowledgements
The PhD life is like a long journey. It needs the continuous effort to make it. However, a thesis is actually an accumulation of efforts from a large community. I would like to take this opportunity to acknowledge and thank all those who have helped me along this journey.
First and foremost, I would like to thank my thesis advisor, Professor Charles Cooney, for his continuous supporting and guiding me through a very rewarding stay at MIT. He provided me with a perspective of biochemical issues in the pharmaceuticals and biotech industry. My appreciation is extended to my committee members Professors Bill Deen, Alan Hatton, and Dane Wittrup for their tough questions and useful suggestions at each committee meeting to balance my research on the right track.
I also like to thank Dr. Shaorong Chong at New England Biolabs for leading me into the world of the intein-mediated protein purification and his help in constructing the plasmid pT12AT1, Dr. Myeong-Hee Yu at the Korea Research Institute of Bioscience and Biotechnology for her generous donation of the plasmid pEAT8, Heather Amoroso at the MIT Biopolymer Lab for N-terminal amino acid sequencing, Han Hwa Hung at EECS for allowing me to use the fluorescence microscope, as well as Peter Morley and Andrew Gallant at the MIT Central Machine Shop for helping me design a vortex flow reactor for adsorption.
I am especially grateful for the help and friendship of Bill Perry, from minor English questions to suggestions on my thesis research. He gave me a lot of useful comments and suggestions on paper and thesis manuscripts. I also like to thank each member of the Cooney lab, Bill Perry, Steve Griffiths, Asti Goyal, Reuben Domike, Samuel Ngai, Mike Laska, May Sun, Maria Jose Ibanez, C.K. Lai, Jean-Francois Hamel for their help and friendship.
To my Chemical Engineering and MIT friends Chen Wang, Xueping Jiang, Jin Yin, Lan Chen: my whole stay at MIT is enjoyable with your support and encouragement from the tough first year to the subsequent years.
Finally, I would like to recognize my Mom and Dad for their continuous confidence and encouragement over the past five years and my younger sister Junting always as a best friend for sharing some ideas and experiences. Thanks to my husband Yongxiang, for his love, support, and encouragement over the years. He is always the person who I could count on when I was stuck in the lab.
T
ABLE OFC
ONTENTS TU ACKNOWLEDGEMENTSUT... 3 TU LIST OF FIGURESUT... 10 TU LIST OF TABLESUT... 14 TU 1 INTRODUCTIONUT... 15 TU 1.1UT TUOVERVIEWUT... 15 TU 1.2UT TUVORTEX FLOWUT... 18 TU1.3UT TUVORTEX FLOW ADSORPTION (VFA)UT... 20
TU
1.3.1UT TUOperating VariablesUT... 21
TU
1.3.2UT TUAdsorptive CharacterizationUT... 23
TU
1.3.3UT TUMass Transfer and Its Mathematical ModelUT... 24
TU 1.3.4UT TUApplicationUT... 25 TU 1.3.5UT TUModel SystemUT... 26 TU 1.4UT TUSUMMARYUT... 29 TU
2UT TUGOALS AND OBJECTIVESUT... 30
TU
3UT TUMATERIALS, METHODS, AND EXPERIMENTAL SETUPUT... 31
TU
3.1UT TUVORTEX FLOW SYSTEMUT... 31
TU
3.1.1UT TUVortex Flow Experimental SetupUT... 31
TU
3.1.2UT TUOld Configuration of Vortex Flow ReactorUT... 32
TU
3.1.3UT TUImproving the Outlet of Vortex Flow ReactorUT... 34
TU
3.1.4UT TUImproving Drive Shaft of Vortex Flow ReactorUT... 36
TU 3.2UT TUMEDIAUT... 37 TU 3.3UT TUEXPRESSION STRAINUT... 39 TU 3.4UT TUPLASMIDSUT... 39 TU
3.5UT TUCELL GROWTH AND INDUCTIONUT... 40
TU
3.6UT TUDOWNSTREAM PROCESSINGUT... 41
TU
3.7UT TUPROTEIN ASSAYUT... 42
TU
3.7.1UT TUTotal Protein AssayUT... 42
TU
3.7.2UT TUSodium Dodecyl Sulfate - Polyacrylamide Gel Electrophoresis (SDS-PAGE)UT.... 42
TU
TU
3.7.4UT TUDensitometryUT... 43
TU
3.7.5UT TUN-terminal Amino Acid SequencingUT... 44
TU
3.7.6UT TUActivity AssayUT... 44
TU
3.8UT TURESIDENCE TIME DISTRIBUTION (RTD) STUDYUT... 45
TU
3.9UT TUBATCH ADSORPTION EQUILIBRIUM STUDYUT... 46
TU
3.10UT TUBATCH ADSORPTION KINETICS STUDYUT... 47
TU
3.11UT TUBREAKTHROUGH CAPACITY MEASUREMENTUT... 48
TU
3.12UT TUVORTEX FLOW ADSORPTION PROCESSUT... 48
TU
3.13UT TUCELL DEBRIS PULSE-RESPONSE STUDYUT... 49
TU
4 CHARACTERIZATION OF VORTEX FLOW ADSORPTION SYSTEMUT... 51
TU
4.1UT TUMATHEMATICAL MODEL FOR VORTEX FLOW SYSTEMUT... 51
TU
4.1.1UT TUIntroductionUT... 51
TU
4.1.2UT TUOne-Dimensional Dispersion Convective ModelUT... 52
TU
4.1.3UT TUTwo-Region Vortex Flow ModelUT... 54
TU
4.1.4UT TUAdsorption EquilibriumUT... 57
TU
4.1.5UT TUAdsorption Kinetics MechanismUT... 59
TU
4.1.6UT TUOrthogonal Collocation MethodUT... 62
TU
4.1.7UT TUInitial Estimate of Modeling ParametersUT... 65
TU
4.1.8UT TUSimulation of Batch Adsorption KineticsUT... 66
TU
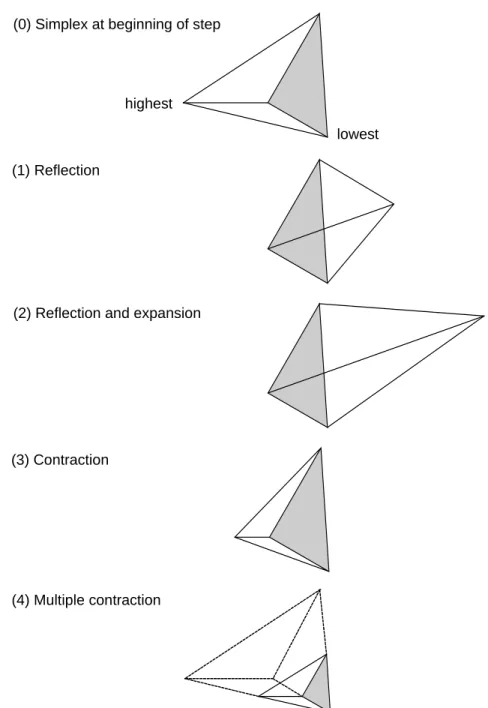
4.1.9UT TUDownhill Simplex MethodUT... 68
TU
4.1.10UT TUVortex Flow Adsorption ModelUT... 70
TU
4.1.11UT TUNotationUT... 73
TU
4.2UT TUTRACER RESIDENCE TIME DISTRIBUTION STUDY IN VORTEX FLOW REACTORUT... 75
TU
4.2.1UT TUIntroductionUT... 75
TU
4.2.2UT TUThe Effect of Rotation Rate of Inner CylinderUT... 75
TU
4.2.3UT TUThe Effect of Axial Loading FlowrateUT... 86
TU
4.2.4UT TUThe Effect of Adsorbent Resin Volume FractionUT... 88
TU
4.2.5UT TUSummaryUT... 90
TU
4.3UT TUADSORPTION STUDIES IN VORTEX FLOW SYSTEMUT... 91
TU
TU
4.3.2UT TUBreakthrough CapacityUT... 91
TU
4.3.3UT TUThe Effect of Axial Loading FlowrateUT... 93
TU
4.3.4UT TUThe Effect of Adsorbent Resin Volume FractionUT... 94
TU
4.3.5UT TUThe Effect of Rotation Rate of Inner CylinderUT... 95
TU
4.3.6UT TUAnalysis and Simulation of Vortex Flow AdsorptionUT... 96
TU
4.3.7UT TUPerformance Analysis of Vortex Flow AdsorptionUT... 100
TU
4.3.8UT TUSummaryUT... 102
TU
4.4UT TUCONCLUSIONSUT... 103
TU
5UT TUAPPLICATION OF VORTEX FLOW ADSORPTION TO PROTEIN RECOVERYUT... 104
TU
5.1UT TUPRODUCTION OF INTEIN α1-ANTITRYPSIN FUSION PROTEINUT... 104
TU 5.1.1UT TUIntroductionUT... 104 TU 5.1.2UT TUExperimental DesignUT... 105 TU 5.1.3UT TUCell GrowthUT... 106 TU
5.1.4UT TUFusion Protein ExpressionUT... 107
TU
5.1.5UT TUIn vivo Cleavage of Fusion ProteinUT... 110
TU
5.1.6UT TUSummaryUT... 111
TU
5.2UT TUPREPARATION OF CHITIN RESINUT... 112
TU
5.2.1UT TUIntroductionUT... 112
TU
5.2.2UT TUChitin and ChitosanUT... 112
TU
5.2.3UT TUProcedure for Preparing Chitin ResinUT... 113
TU
5.2.4UT TUGlutaraldehyde MethodUT... 114
TU
5.2.5UT TUDivinyl Sulphone MethodUT... 118
TU
5.2.6UT TUAdsorption of Intein Fusion Protein by Chitin ResinUT... 120
TU
5.2.7UT TUSummaryUT... 124
TU
5.3UT TUADSORBENT RESIN FLUIDIZATIONUT... 125
TU
5.3.1UT TUIntroductionUT... 125
TU
5.3.2UT TUMeasurements of Minimum Fluidization Rotation RatesUT... 126
TU
5.3.3UT TUCorrelation of Minimum Fluidization Rotation RatesUT... 130
TU
5.3.4UT TUComparison of Measured and Correlated Minimum Fluidization Rotation
TU
5.3.5UT TUComplexity of Particle Fluidization Process in Vortex Flow ReactorUT... 132
TU
5.3.6UT TUSummaryUT... 133
TU
5.4UT TURECOVERY OF INTEIN α1-ANTITRYPSIN (α1-AT) FUSION PROTEINUT... 134
TU
5.4.1UT TUIntroductionUT... 134
TU
5.4.2UT TUIntein α1-Antitrypsin Fusion Protein SystemUT... 134
TU
5.4.3UT TUInteraction between E. coli Cell Debris and Chitin ResinUT... 135
TU
5.4.4UT TUFluidization of Chitin ResinUT... 138
TU
5.4.5UT TUVortex Flow Adsorption ProcessUT... 138
TU
5.4.6UT TUEvaluation of Vortex Flow Adsorption PerformanceUT... 139
TU
5.4.7UT TUNon-Clarified vs. Clarified E. coli Cell ExtractUT... 142
TU
5.4.8UT TUN-terminal Amino Acid Sequence AnalysisUT... 144
TU
5.4.9UT TUActivity Assay for Vortex Flow Adsorption ProcessUT... 145
TU
5.4.10UT TUSummaryUT... 146
TU
5.5UT TUTHEORETICAL ANALYSIS OF VORTEX FLOW ADSORPTION PERFORMANCEUT... 148
TU
5.5.1UT TUIntroductionUT... 148
TU
5.5.2UT TUModeling EquationsUT... 150
TU
5.5.3UT TUModel System and ParametersUT... 152
TU
5.5.4UT TUThe Effect of QUT... 154
TU
5.5.5UT TUThe Effect of K and kUBU1UTB... 155
TU
5.5.6UT TUThe Effect of Rotation RateUT... 156
TU
5.5.7UT TUSummaryUT... 158
TU
6UT TUDESIGN AND OPTIMIZATION OF VORTEX FLOW ADSORPTION SYSTEMUT... 159
TU
6.1UT TUINTRODUCTIONUT... 159
TU
6.2UT TUDETERMINATION OF ADSORPTION MECHANISMUT... 159
TU
6.3UT TUDESIGN OF ADSORBENT RESINUT... 159
TU
6.4UT TUDESIGN OF VORTEX FLOW REACTORUT... 161
TU
6.5UT TUOPERATION OF VORTEX FLOW ADSORPTIONUT... 163
TU
6.6UT TUSUMMARYUT... 164
TU
7UT TUCONTRIBUTIONS AND CONCLUSIONSUT... 165
TU
TU
8.1UT TUCHARACTERIZATION OF ADSORPTION MECHANISM BETWEEN FUSION PROTEIN AND
CHITIN RESINUT... 170
TU
8.2UT TUSIMULATION OF FLUID VELOCITY IN VORTEX FLOW SYSTEMUT... 170
TU
8.3UT TUIMPROVEMENT OF VORTEX FLOW MODELUT... 171
TU
8.4UT TUSCALING-UP OF VORTEX FLOW ADSORPTION SYSTEMUT... 172
TU
List of Figures
TU
Figure 1.1: Schematic structure of vortex flowUT... 19
UT
Figure 1.2: Chemical mechanism of intein-mediated purification of α1-antitrypsinT... 28U
TU
Figure 3.1: Schematic of vortex flow experimental setupUT... 31
TU
Figure 3.2: Old configuration of vortex flow reactorUT... 33
UT
Figure 3.3: Structure of two bearings holding stainless steel core of inner cylinderT... 35U
TU
Figure 3.4: Multiple-hole area and buffer cylinder of vortex flow reactorUT... 36
TU
Figure 3.5: Batch adsorption experimental setupUT... 48
TU
Figure 4.1: Two-region model for vortex flow systemUT... 55
TU
Figure 4.2: Adsorption equilibrium at low BSA concentrationsUT... 58
TU
Figure 4.3: Adsorption equilibrium at low to high BSA concentrationsUT... 59
TU
Figure 4.4: Experimental and simulated batch adsorption kinetics dataUT... 67
TU
Figure 4.5: Possible outcomes for a step in the downhill simplex methodUT... 69
TU
Figure 4.6: Tracer RTD results at low rotation rates of inner cylinderUT... 77
UT
Figure 4.7: Peak time of tracer RTD curves at low rotation rates of inner cylinderT... 77U
TU
Figure 4.8: Tracer RTD results at high rotation rates of inner cylinderUT... 78
TU
Figure 4.9: Two-region vortex flow modeling resultsUT... 78
TU
Figure 4.10: The number of CSTRs at different rotation rates of inner cylinderUT... 80
TU
Figure 4.11: Fitted axial dispersion coefficients from one-dimensional dispersion
convective model at different rotation rates.UT... 81
TU
Figure 4.12: Fitted axial dispersion coefficients from two-region vortex flow model at
different rotation rates.UT... 81
TU
Figure 4.13: Fitted axial dispersion coefficients from one-dimensional dispersion
convective model put in the relative Taylor number coordinateUT... 84
TU
TU
Figure 4.15: Tracer RTD results at different axial flowratesUT... 87
TU
Figure 4.16: Tracer RTD results at different axial flowrates with the dimensionless time as the horizontal axisUT... 87
TU
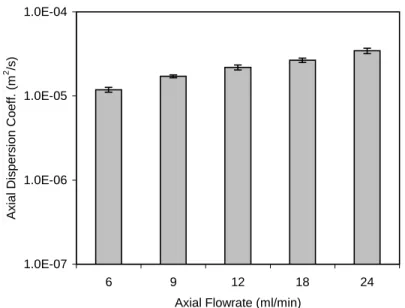
Figure 4.17: Fitted axial dispersion coefficients at different flowrates from
one-dimensional dispersion convective modelUT... 88
TU
Figure 4.18: Tracer RTD results at different resin volume fractionsUT... 89
TU
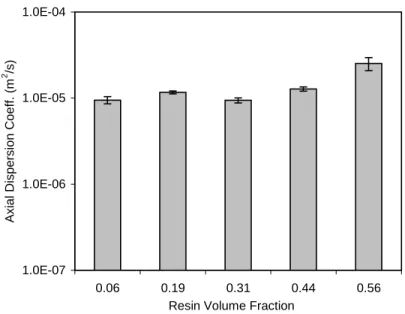
Figure 4.19: Fitted axial dispersion coefficients at different resin volume fractions from
one-dimensional dispersion convective modelUT... 90
UT
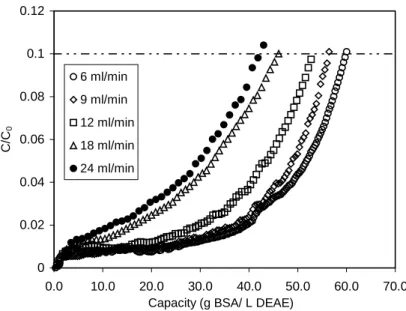
Figure 4.20: Breakthrough profiles of vortex flow adsorption at different axial flowratesT... 93U
TU
Figure 4.21: Breakthrough capacities of BSA by Streamline DEAE at different axial
loading flowratesUT... 94
TU
Figure 4.22: Breakthrough capacities of BSA by Streamline DEAE at different adsorbent resin volume fractionsUT... 95
TU
Figure 4.23: Breakthrough capacities of BSA by Streamline DEAE at different rotation
rates of inner cylinderUT... 96
TU
Figure 4.24: Vortex flow adsorption modeling resultUT... 98
TU
Figure 4.25: Vortex flow adsorption performance analysis: breakthrough capacity vs.
volumetric throughput.UT... 101
TU
Figure 4.26: Vortex flow adsorption performance analysis: recovery yield vs. volumetric
throughput.UT... 102
TU
Figure 5.1: Induction temperatures and induction times for optimization of the expression of the intein α1-antitrypsin fusion proteinUT... 106
TU
Figure 5.2: E. coli cell growth profiles under different induction temperaturesUT... 107
TU
Figure 5.3: SDS-PAGE analysis of soluble cell extract from E. coli harboring pT12AT1
before and after induction at 30°CUT... 108
TU
Figure 5.4: Intein α1-antitrypsin fusion protein expression at different induction times
under different induction temperaturesUT... 109
TU
Figure 5.5: Intein α1-antitrypsin fusion protein productivity at different induction times
TU
Figure 5.6: Western blotting analysis for soluble cell extract from E. coli harboring
pT12AT1 before and after induction at 30°CUT... 111
TU
Figure 5.7: Structure of polysaccharides chitin and chitosanUT... 113
UT
Figure 5.8: Glutaraldehyde polymer and its activation of amine-containing matrixT... 115U
UT
Figure 5.9: Chemical mechanism of glutaraldehyde method for preparing chitin beadsT... 117U
UT
Figure 5.10: Chemical mechanism of divinyl sulphone method for preparing chitin beadsT.... 119U
TU
Figure 5.11: Schematic structure of MBP intein fusion proteinUT... 120
TU
Figure 5.12: SDS-PAGE assay for the adsorption of MBP intein fusion protein by chitin
resin prepared with glutaraldehyde methodUT... 121
TU
Figure 5.13: SDS-PAGE assay for the adsorption of MBP intein fusion protein by chitin
resin prepared with DVS methodUT... 122
TU
Figure 5.14: Viscosity of sucrose solution vs. concentration in wt % at 20°CUT... 128
TU
Figure 5.15: Measured and correlated minimum fluidization rotation rates for adsorbent
resinsUT... 131
TU
Figure 5.16: Measured and correlated minimum fluidization rotation rates in sucrose
solutions with different concentrationsUT... 132
TU
Figure 5.17: Schematic structure of intein α1-AT fusion proteinUT... 135
UT
Figure 5.18: Cell debris pulse-response experiment results in vortex flow reactorT... 137U
TU
Figure 5.19: E. coli cell debris recovery in the pulse-response experiments for both
Streamline DEAE anion exchange resin and chitin resinUT... 137
TU
Figure 5.20: Outlet stream measurements during loading/adsorption and washing steps in vortex flow adsorption process for recovery of intein α1-antitrypsin fusion
proteinUT... 140
UT
Figure 5.21: SDS-PAGE and Western blotting assays for vortex flow adsorptionT... 141U
TU
Figure 5.22: Capture efficiency and cleavage efficiency from SDS-PAGE and Western
blotting assaysUT... 142
UT
TU
Figure 5.24: Capture efficiency of vortex flow adsorption process for non-clarified and
clarified cell extractUT... 144
TU
Figure 5.25: Activity assay for vortex flow adsorption processUT... 146
TU
Figure 5.26: Capture efficiency at different adsorbent capacitiesUT... 154
TU
Figure 5.27: Capture efficiency at different adsorption kineticsUT... 156
TU
Figure 5.28: Capture efficiency at different rotation rates of inner cylinderUT... 157
TU
Figure 6.1: Contour plot of minimum fluidization rotation rate with particle density and
particle diameterUT... 161
TU
Figure 6.2: Critical Taylor number TaUBUcUBU for vortex flow reactor with different geometric
dimensionsUT... 162
TU
List of Tables
TU
Table 3-1: Geometric Dimensions of Vortex Flow ReactorUT... 32
TU
Table 3-2: Geometric Dimensions of BearingsUT... 37
TU
Table 3-3: Media Stock SolutionsUT... 38
TU
Table 3-4: SDS-PAGE Sample Buffer SolutionUT... 42
TU
Table 3-5: SDS-PAGE Running Buffer SolutionUT... 43
TU
Table 3-6: Coomassie Blue Staining and Destaining SolutionsUT... 43
TU
Table 4-1: Modeling Parameters for Adsorption EquilibriumUT... 57
TU
Table 4-2: Modeling Parameters for Adsorption KineticsUT... 67
TU
Table 4-3: Flow Regimes in Vortex Flow ReactorUT... 84
TU
Table 4-4: Vortex Flow Adsorption Modeling ParametersUT... 99
TU
Table 5-1: Adsorption of MBP Intein Fusion Protein by Chitin ResinsUT... 123
TU
Table 5-2: Parameters in Correlation of Sucrose DensityUT... 127
TU
Table 5-3: Minimum Fluidization Rotation Rates for Adsorbent ResinsUT... 129
TU
Table 5-4: Minimum Fluidization Rotation Rates in Sucrose Solutions with Different
ConcentrationsUT... 129
TU
Table 5-5: Parameters in Correlation of Minimum Fluidization Rotation RateUT... 130
TU
Table 5-6: Parameters for Adsorption MechanismUT... 153
TU
Table 5-7: Modeling Parameters for the Baseline CaseUT... 153
TU
Table 5-8: Three Cases with Different Adsorption KineticsUT... 155
TU
Table 5-9: Axial Dispersion Coefficient DUBULUBU and Vortex Core-Bypass Mass Transfer
1 Introduction
1.1 Overview
One strategy to reduce costs in manufacturing a biochemical product is simplification of downstream processing (Spalding, 1991). This may be achieved by reducing the number of unit operations. Integrative technologies seek to combine steps into a new single unit operation and tighten the whole process (Thömmes et al., 1995a). The aim is to increase process compactness and yield, to maintain product integrity and purity, and to reduce processing time, equipment number, and labor cost (Beck et al., 1999).
Primary recovery of a biochemical product often starts from feedstock that contains particulates, e.g., cells and cell debris for extracellular products or cell homogenate for intracellular products (Frej et al., 1994). In conventional downstream processing, the initial steps are clarification, concentration, and purification. Disadvantages associated with such processes are long cycle time and low product yield due to cumulative product loss through the sequence of unit operations (Thömmes et al., 1995b). The concept of integration of the early steps can address this problem and thus is economically promising.
Conventional packed column chromatography is constrained in dealing with crude cell extract due to high viscosity and the presence of colloidal materials (Chang and Chase, 1996b). A packed bed acts as a dead-end depth filter, which causes cells and cell debris to build up in the column, flow rate to decrease, and eventually the column to totally block (Frej et al., 1994). However, a packed bed has plug flow behavior, which is critical to high-resolution separation. The recovery of biochemical products from fermentation broths and cell homogenates usually
commences with centrifugation and filtration to remove cells and cell debris. Only the clarified feedstock is applied to packed column chromatography (Frej et al., 1994).
One method to integrate multiple primary steps in a downstream process is to use a batch procedure in which the adsorbent is added directly to the feedstock in a stirred tank. The advantage of employing a stirred tank is that the product is captured directly from non-clarified feedstock. The disadvantage is that the stirred tank acts as one contact stage in a separation process, leading to long processing time (Frej et al., 1994). Another problem of the stirred tank is that an additional step is needed to separate the adsorbent from the feedstock after the adsorption step.
Expanded bed adsorption has emerged as a method where a possibility of high chromatographic resolution is coupled with the advantage of working with a particulate-containing feedstock. In expanded bed adsorption, adsorbent particles with high density are used in an upflow fluidized bed (Gailliot et al., 1990) and the fluid void is sufficient to allow for the free passage of particulate debris. As with a stirred tank procedure, a fluidized bed has back mixing (i.e., axial dispersion), thereby behaving like a column with a low number of contact stages (Frej et al., 1994).
Generally, the adsorption performance in chromatographic processes is influenced by mass transport, adsorption kinetics, and dispersion, which depend on both adsorbent properties and operating parameters (Karau et al., 1997; Li et al., 1995). In order to make expanded bed adsorption an effective process, adsorbent particles with the following criteria are needed (Karau et al., 1997; Thömmes et al., 1995a; Thömmes et al., 1995b):
(1) The distribution of particle size and density should allow for development of a classified inhomogeneous fluidized bed at reduced local mobility of individual adsorbent particles with the aim to preserve the packed-bed hydrodynamics.
(2) Size and density of adsorbents should result in a significant difference in the terminal settling velocity of adsorbent particles and biomass in the feedstock to allow for clarification of the feedstock by solid-solid separation during fluidization.
(3) The adsorbents used for expanded beds should have a relatively high density to allow for using higher flow rates and thereby shorten the processing time.
(4) The adsorbents should be resistant to nonspecific adsorption and fouling by biomass, nucleic acids, lipids, and other materials contained in the feedstock.
Therefore, the success of expanded bed adsorption is closely related to the tight control of fluidization of the adsorbents. A stable bed expansion at reduced mixing within the bed is crucial to achieve capacity and resolution similar to standard chromatography in a packed-bed mode (Thömmes et al., 1995b). To be effective, an expanded bed should guarantee homogeneous particle fluidization, i.e., the absence of flow channels, stagnant zones, as well as aggregates from fluidized particles (Fernández-Lahore et al., 1999).
In addition to expanded bed adsorption, another novel and promising technology, vortex flow adsorption (VFA), also can be applied to dealing with fermentation broths or cell homogenates directly due to a high fluid void fraction and a possible high number of contact stages that result from distinct vortices.
1.2 Vortex Flow
Vortex flow occurs in the annular gap between two concentric cylinders, an inner rotating solid cylinder and an outer stationary cylindrical shell, and it is generated by the rotation of the inner cylinder. Above a critical rotation rate, circular Couette flow bifurcates to a series of counter-rotating toroidal vortices; the schematic structure of vortices is shown in Figure 1.1. G. I. Taylor first determined the critical rotation speed for the vortex formation without axial flow (Taylor, 1923). Therefore, vortex flow is also called Taylor vortex flow. The vortices are regularly spaced along the cylinder axis, each with an axial height approximately equal to the annular gap width. As is shown in Figure 1.1, there are two boundaries for each circular vortex, one is the inflow boundary toward the inner cylinder and the other is the outflow boundary toward the outer cylinder. Normally the velocity of the inflow boundary is slower than that of the outflow boundary.
In a vortex flow system, the ratio of the inertial centrifugal force to the viscous force is represented by the Taylor number, Ta:
i d R Ta ω ν • • = (1-1)
where ω is the angular velocity of the inner cylinder, d is the annular gap width, RBiB is the radius
of the inner cylinder, and ν is the kinematic viscosity of the fluid. When Ta exceeds the critical
value, TaBcB, a transition occurs from Couette flow to a flow regime that is marked by a series of
toroidal vortices. When an axial flow is superimposed to this system, the resulting flow is so-called Taylor-Couette-Poiseuille flow. For the axial flow, the ratio of the inertial force to the viscous force is described by the axial Reynolds number, ReBaxB:
Re ax ax U d ν • = (1-2)
where UBax Bis the superficial axial velocity.
Figure 1.1: Schematic structure of vortex flow
In the vortex flow system, the rotation rate of the inner cylinder is an important operating variable. By varying the rotation rate, it is possible to span a series of different flow patterns (Wereley and Lueptow, 1999b), ranging from an almost plug flow to an almost perfectly mixed flow (Giordano et al., 1998). The rotation of the inner cylinder may be used to keep the particles suspended at low axial flow, which is an otherwise difficult task in conventional fluidized bed reactors (Giordano et al., 1998). Additionally, the agitation
Inflow Boundary Outflow Boundary Outer Cylinder Inner Cylinder Counter Rotating Neighbor Vortices ω
promoted by the rotation of the inner cylinder is low-shear compared to that obtained with conventional stirrers, which is an important feature especially when sensitive particles and cells are present in the fluid (Giordano et al., 1998).
Vortex flow has been applied to chemical and biochemical processes in several ways. The relatively small inter-vortex mixing, at least in the laminar flow regime, can improve vortex flow reactor performance close to an ideal plug-flow reactor (Haim and Pismen, 1994). In a heterogeneous system, e.g., immobilized enzymes, the rotation of the inner cylinder provides an additional operating variable, or degree of freedom (Giordano et al., 1998), that facilitates particle fluidization. In vortex flow filtration, vortices promoted on the filtration membrane surface by the rotation of the inner cylinder could prevent plugging of the filter pores with particles and thus minimize fouling (Wereley and Lueptow, 1999a) .
1.3 Vortex Flow Adsorption (VFA)
Vortex flow adsorption is the application of vortex flow to biochemical downstream processing. In vortex flow adsorption, adsorbent particles are suspended in the annular gap by adjusting the rotation rate of the inner cylinder. Due to high voidage in the vortex flow reactor, crude cell extract with cells or cell debris can be loaded to the reactor directly, and the desired product is adsorbed with cells or cell debris passing through the reactor.
Compared to other integrative technologies, vortex flow adsorption has the following distinct features:
(1) The system can be mixed without stirring. The low-shear mixing is especially beneficial to biological systems (Giordano et al., 1998; Giordano et al., 2000a).
(2) The fluid voidage is increased compared to packed beds, allowing for free passage of entrained particles. Therefore, it can be applied directly to non-clarified cell extracts to reduce the number of steps in downstream processing and improve process efficiency and recovery yield.
(3) Due to the periodical configuration of vortices, multiple contact stages can be formed at least in the flow regime with a low Taylor number, thereby increasing adsorption efficiency.
(4) The rotation rate of the inner cylinder is another operating variable, which makes the operating system flexible and robust (Giordano et al., 1998). Moreover, the rotation of the inner cylinder facilitates the suspension of adsorbent resin and the axial flow may be changed independently to adjust the process throughput.
1.3.1 Operating Variables
As mentioned previously, the rotation of the inner cylinder is very important in the vortex flow adsorption system. The lower limit of the rotation rate should be above the critical rotation rate to induce the vortex flow. The critical rotation rate can be improved if there is axial flow because the axial flow stabilizes the primary Couette flow and delays the appearance of the secondary vortex flow (Moore, 1994a). Additionally, when the Taylor number becomes significantly larger than TaBcB, there are several different vortex flow regimes: Taylor vortex flow
(TaBcB < Ta < 15TaBcB), wavy vortex flow (15TacBB < Ta < 30TaBcB), turbulent vortex flow (30TaBcB < Ta
< 160TaBcB), etc. (Ohmura et al., 1997; Sczechowski et al., 1995). The operating rotation rate
should cover these vortex flow regions so that the mass transfer, the axial dispersion, and the vortex flow adsorption performance can be compared at different vortex flow regions. In
addition, since the rotation of the inner cylinder facilitates fluidization or suspension of adsorbent resin, the operating rotation rate also should be above the minimal fluidization rotation rate above which adsorbent resin can be fluidized completely.
In addition, the axial flowrate is also an important operating parameter. Unlike expanded bed adsorption, there is no fluid distributor at the bottom of the vortex flow reactor and the axial flow cannot facilitate the fluidization of the adsorbent resin. Therefore, the main function of the axial flowrate is to adjust the throughput of the vortex flow adsorption process. This is different from expanded bed adsorption, where the axial flowrate is used to fluidize the adsorbent resin and simultaneously the throughput of the adsorption process is determined.
In packed column chromatography, back mixing or axial dispersion is low compared to expanded bed adsorption. Therefore, it is very natural to postulate that, if the adsorbent resin volume fraction is increased in the vortex flow system, the axial dispersion could be decreased. Therefore, in this research, the effect of the adsorbent resin volume fraction on the vortex flow adsorption performance is investigated.
The effect of the operating variables on the performance of vortex flow adsorption can be investigated through an experimental approach. However, if the performance of vortex flow adsorption can be understood from its intrinsic mechanism, it becomes clear how to adjust the operating variables to optimize the performance of vortex flow adsorption. The usual chemical engineering approach can be applied here: first identify the main characteristics of vortex flow adsorption with tracer RTD study or other experimental approaches; then build a model capable of simulating vortex flow adsorption; finally validate the model against the experimental data
after a careful assessment of the intrinsic and inherent kinetics and the extra- and intra-particle mass transfer resistances (Giordano et al., 1998).
1.3.2 Adsorptive Characterization
The adsorptive behavior in the vortex flow system can be characterized by measuring the dynamic or breakthrough capacity, which is the capacity of an adsorption column or reactor under a defined actual operating condition instead of an equilibrium condition.
In measuring the dynamic capacity, a protein solution is continuously fed into a vortex flow reactor containing adsorbent resin to generate a breakthrough curve. The protein solution is fed into the reactor until the adsorbent resin is saturated with the adsorbed protein and the concentration of the protein in the outlet stream approaches the inlet concentration or some percent of the inlet concentration. In an ideal operation, all the protein introduced is bound to the resin until saturation is reached; at this point the outlet concentration changes immediately from zero to the inlet concentration. In a real situation, the protein begins to break through the reactor before saturation. The resulting concentration versus time curve is indicative of the protein adsorption capacity of the adsorbent resin and also the non-idealities of the dynamic adsorption behavior. The time axis here is equivalent to the total amount of protein introduced to the reactor.
Therefore, by measuring the dynamic capacities under different operating conditions, e.g., the rotation rate of the inner cylinder, the axial loading flowrate, and the adsorbent resin volume fraction, the vortex flow adsorption performance and its non-idealities can be explored.
1.3.3 Mass Transfer and Its Mathematical Model
Vortex flow is a complex fluid phenomenon and a secondary flow pattern that only occurs above a critical rotation rate. A deep understanding of vortex flow comes from tracer and visualization study. In these experiments, color, fluorescent, or magnetic tracer is always used to facilitate the study of vortex flow.
In the vortex flow system, the mechanical energy, which is transmitted by the rotation of the inner cylinder, produces two rotational flows: a global tangential rotation and a secondary rotation with axial and radial components inside the vortices (Desmet et al., 1996a). Generally, the axial Poiseuille flow is applied to the annular gap in the applications of vortex flow. All these flows are interwoven with each other. In addition, the structure of vortices varies greatly with the rotation rate of the inner cylinder. All these factors make mass transfer occurring in the annular gap very complicated.
Although there are several mathematical models reported to describe the mass transfer in the vortex flow system, they do not agree with each other. The main reason is that each model is based on different assumptions and evaluated by limited experiments (Campero and Vigil, 1997; Desmet et al., 1996a; Desmet et al., 1996b; Desmet et al., 1997a; Desmet et al., 1997b; Moore and Cooney, 1995). As is known, vortex structure and mass transfer are different in different flow regimes. Therefore, it is difficult to develop a general model to describe the mass transfer in the vortex flow system under a wide operational range. It is very likely that some assumptions may work well for one or more flow regimes, but are ineffective in other flow regions. Therefore, to determine an appropriate mass transfer model in the vortex flow system is within the scope of this thesis.
In general, due to the natural periodical configuration of vortices, the annular gap can be split into stages, each consisting of one vortex core and its respective bypass region (Giordano
et al., 2000b). Therefore, mass transfer occurs inside vortices (intra-vortex), between different
vortices (inter-vortex), and between vortices and bypass regions. At low rotation rates, mass transfer due to inter-vortex dispersion is low, and the vortex flow reactor is expected to resemble a plug-flow reactor with bad intra-vortex mixing. When the rotation rate increases, all the mass transfer rates increase, and the vortex flow reactor can be regarded as a CSTR series with very good inter-vortex mass transfer. If the rotation rate increases further, mass transfer between vortices and bypass regions becomes dominant and the whole vortex flow reactor behaves like a CSTR. Therefore, two or three adjustable parameters are usually needed in a model to simulate the mass transfer in the vortex flow system. In the model, not only mass transfer coefficients are needed, but also the volume ratio between vortices and bypass regions. A simplified model can be obtained with some assumptions that capture the main mass transfer features under a specific situation.
1.3.4 Application
Vortex flow adsorption was put forward in order to recover biochemical products directly from fermentation broths or homogenized cell cultures. Vortex flow adsorption is supposed to be a simplified unit operation that integrates clarification, concentration, and purification, three independent unit operations in conventional downstream processing.
The actual biochemical system is complex in that it is highly viscous and non-Newtonian with particulates and colloidal materials (Chang et al., 1993). All these define higher requirements on vortex flow adsorption. A qualitative analysis of the constituents in a
fermentation broth or cell homogenate is necessary to choose the functional adsorbent to recover and separate the target protein very efficiently. An adsorbent with high specificity and affinity to the target protein is always desired.
As in the expanded bed adsorption process, there are specific requirements for the adsorbent resin used in vortex flow adsorption when it deals with complex biochemical systems. High-density adsorbent particles are needed to create a sufficient difference in the terminal settling velocity of adsorbent particles and biomass in the feedstock to allow for clarification of cells and cell debris by solid-solid separation. However, the adsorbent resin density cannot be too high because the resin should be easily fluidized at moderate rotation rates. In addition, the adsorbent should be resistant to the fouling by biomass, nucleic acids, and lipids in the fermentation broth.
In addition, high viscosity of fermentation broths or cell homogenates is likely to lead to flow channels, stagnant zones, as well as aggregates from fluidized particles (Fernández-Lahore et al., 1999), which produce inhomogeneous particle-containing vortices. All these affect mass transfer and thereby recovery and purification efficiency of vortex flow adsorption. Therefore, an upper limit is expected on initial cell mass concentration in the feedstock loaded to the vortex flow adsorption system (Frej et al., 1994).
1.3.5 Model System
In this research, a recombinant form of human α1-antitrypsin (α1-AT) expressed in
Escherichia coli was used as a model system for exploring the application of vortex flow
adsorption to directly recovering biochemical products from fermentation broths or cell homogenates. α1-AT is a 394 amino acid (44 kDa) serine protease inhibitor (serpin) in human
plasma. α1-AT is produced in the liver and released into the blood. α1-AT has a primary physiological role in protecting the lungs from neutrophil elastase, which normally digests the elastin of the damaged or aging cells in order to provide for healing. However, once neutrophil elastase is done digesting these cells, it attacks the lung tissue. α1-AT in sufficient amounts
traps and destroys neutrophil elastase before it can damage the delicate lung tissue. Insufficient levels of α1-AT in the lungs can cause widespread tissue degradation by elastase, ultimately
resulting in the lung damage associated with clinical pulmonary emphysema. Therefore, the production of recombinant human α1-antitrypsin in a genetically engineered microorganism is
of particular economic interest.
Recombinant α1-antitrypsin was expressed as a fusion protein with an intein, a protein segment for protein splicing. Protein splicing is a posttranslational processing event in which an internal protein segment, the intein, can catalyze its own excision from a precursor protein and concomitantly ligate the flanking regions, the exteins, to form a mature protein (Perler et al., 1994). As is shown in Figure 1.2, α1-AT was fused as a target protein to the C-terminus of a
modified intein (Sce VMA intein, 55 kDa) containing a Bacillus circulans chitin-binding domain (CBD) (Chong et al., 1996). The intein is from the vacuolar membrane ATPase subunit (VMA) of Saccharomyces cerevisiae. The CBD allows the binding of the fusion protein to a chitin resin. The intein is capable of undergoing in vitro peptide bond cleavage at its termini. The intein-mediated cleavage is induced by incubation of the fusion protein bound on the chitin resin with a commonly used thiol, 1,4-dithiothreitol (DTT). DTT cleaves the thiol ester bond formed by an N-S acyl rearrangement at the intein N-terminal cysteine, which subsequently triggers peptide cleavage at the intein C-terminal asparagine (Chong et al., 1998a). The three-
Figure 1.2: Chemical mechanism of intein-mediated purification of α1-antitrypsin
α1-Antitrypsin was fused to the C-terminal asparagine (Asn) of a modified intein containing a chitin-binding domain (CBD) to allow binding to a chitin resin. A thiol ester bond is formed by an N-S acyl rearrangement at the intein N-terminal cysteine (Cys). DTT cleaves the thiol ester bond, which in turn triggers the cleavage at the intein C-terminus with Asn succinimide formed. α1-Antitrypsin and a small N-extein peptide are eluted from the chitin resin whereas the CBD tagged intein remains bound to the chitin resin.
Loading on chitin column
N-S acyl rearrangement
Succinimide formation coupled to cleavage at intein C-terminus to release a1-AT
α1-AT DTT induced cleavage at intein N-terminus O N-extein OH OH HS S H2N HS N H NH2 O α1-AT O DTT OH OH HS -S H2N HS NH O O O O N SH H N H NH2 O α1-AT N-extein CBD Tagged Intein
Intein N-terminal Cys Intein C-terminal Asn
O O NH2 S N H NH2 O α1-AT chitin resin O O N SH H N H NH2 O α1-AT
dimensional structure of the intein indicates that the terminal residues, Cys and Asn, are in close proximity (Duan et al., 1997). The thiol-induced N-terminal cleavage triggers a conformational change in the intein structure, thereby allowing succinimide formation and the C-terminal cleavage to proceed at basic pH conditions (Chong et al., 1998b). As a result,
α1-AT is released from the chitin resin without the use of a protease and is separated from its fusion partner on the chitin resin that purifies the fusion protein. A small N-terminal extein peptide (12 residues, 1.6 kDa), derived from E. coli maltose binding protein (MBP) to provide a favorable translational start, is also purified after the cleavage reaction and can be removed by dialysis (Chong et al., 1998a).
In this research, we use the intein α1-AT fusion protein and the chitin resin system to
show that vortex flow adsorption is an integrative technology that can be applied to recovering intracellular recombinant protein directly from homogenized crude E. coli cell extract without first removing cell debris.
1.4 Summary
Vortex flow adsorption is a novel concept in downstream processing of biochemical products. Conceptually, it can directly process particle-containing cell extract without first removing cellular or other particles. It is expected that its implementation would provide a novel perspective about downstream processing to shorten processing time, improve recovery yield, and decrease operational cost. In addition, vortex flow adsorption is a promising application of vortex flow after the success of vortex flow reaction and vortex flow filtration.
2 Goals and Objectives
The goal of this thesis is to characterize the performance of the vortex flow adsorption system using both the experimental and modeling approaches and to apply it as an integrative technology to directly recovering recombinant proteins from crude E. coli cell extracts without first removing cellular materials.
Specifically, the objectives of this thesis are to:
Improve the vortex flow system to be used for the adsorption operation,
Characterize the performance of the vortex flow adsorption system both as a chemical reactor and as an adsorption column,
Develop a mathematical model to simulate the mass transfer, the axial dispersion, and the adsorptive behavior in the vortex flow system,
Define an appropriate operating region for the vortex flow adsorption process based on the experimental and modeling results,
Apply the vortex flow adsorption technology to a practical biochemical system to explore the recovery efficiency and other relevant problems,
Put forward some suggestions and considerations for the design and optimization of the vortex flow adsorption system.
3 Materials, Methods, and Experimental Setup
3.1 Vortex Flow System
3.1.1 Vortex Flow Experimental Setup
In this research, most experiments were conducted at room temperature with an experimental setup depicted schematically in Figure 3.1. The core component is a vortex flow reactor, which is composed of two coaxial cylinders. The external stationary cylindrical shell is made of acrylic and the inner rotational solid cylinder of polypropylene. Table 3-1 lists the geometric dimensions of the vortex flow reactor. The details about the vortex flow reactor configuration are described later. A stainless steel shaft was positioned throughout the inner cylinder to increase the system inertia and reduce inner cylinder wobbling.
Figure 3.1: Schematic of vortex flow experimental setup Inlet
UV Detector Outlet
Vortex Flow Reactor Peristaltic Pump
Peristaltic Pump Waste
Feed
Spectrometer
Table 3-1: Geometric Dimensions of Vortex Flow Reactor
Geometric Dimension Units Value
Outer Cylinder Radius, RBoB cm 2.53
Inner Cylinder Radius, RBiB cm 1.71
Annular Gap Width, d cm 0.82
Wetted Height, L cm 14.7
Effective Reactor Volume ml 160
Rotation was provided by a magnetic drive adapted from Membrex (Garfield, NJ) benchmark filtration equipment, controlled by an Electro-Craft E-652-M unit, and measured with a hand-held digital tachometer (Shimpo Instruments). Two peristaltic pumps (Cole-Parma) were used to control the inlet and outlet flowrate, respectively. A timer and graduated cylinder were used together to measure actual flowrates.
The outlet concentration of the vortex flow reactor was measured by both a continuous flow UV detector with a 280 nm filter (Amersham Bioscience) and a Chem2000-UV-Vis optic fiber spectrometer (Ocean Optics). The voltage signal from the UV detector was collected by a computer and further analyzed with Hyper Terminal software. Chem2000-UV-Vis is an online spectrophotometer that can measure absorbance at multiple wavelengths simultaneously. When necessary, the outlet sample was collected by a Model 2110 fraction collector (Bio-Rad) for further assays.
3.1.2 Old Configuration of Vortex Flow Reactor
A vortex flow reactor with an old configuration, as shown schematically in Figure 3.2, was used at the very beginning of this research work. It was designed by previous colleagues at the Cooney lab and used for chemical or enzymatic reactions (Giordano et al., 2000a; Giordano
et al., 2000b). Inlet and outlet are lateral orifices on the outer cylinder wall with small
cross-sectional areas. In addition, a piece of nylon mesh (Sefar America) was positioned on the outlet orifice to retain adsorbent resin.
Figure 3.2: Old configuration of vortex flow reactor
There are eight lateral ports that can be used as inlets and outlets. The distances of the ports to the bottom of the outer cylinder are labeled. The inlet and outlet used in this work are marked.
When this vortex flow reactor with fluidized adsorbent resin was operated with the axial flow, the resin gradually accumulated on the outlet mesh and partially blocked the outlet orifice. Subsequently, there were a lot of gas bubbles flowing out of the blocked outlet orifice. The appearance of the gas bubbles affected downstream online concentration measurements by both the UV detector and the Chem2000-UV-Vis spectrophotometer. In addition, the outlet fluid flowrate was less than the setting value since the gas bubbles occupied part of the outlet
14.4 cm 11.7 cm 8.5 cm 1.5 cm 1.2 cm 8.5 cm 5.3 cm 14.0 cm Outlet Inlet
tubing volume. Therefore, the vortex flow reactor cannot be operated steadily due to the fluid accumulation within the reactor.
In the vortex flow reactor, the rotation of the inner cylinder was provided by a magnetic drive. The smooth transfer of the rotating motion from the magnetic drive to the inner cylinder is mostly determined by the geometric dimensions of two bearings holding the stainless steel core of the inner solid cylinder. The geometric dimensions of two bearings include the inner diameter of the bearings and the distance between the two bearings. The schematic structure of the vortex flow reactor without the outer cylindrical shell is shown in Figure 3.3. For the old configuration of the vortex flow reactor, the two bearings had a small inner diameter and were very close to each other. When the vortex flow reactor was operated at high rotation rates, e.g., 400 rpm, there was serious wobbling at the end of the inner cylinder far from the bearings. The wobbling decreased the annular gap between the inner and outer cylinders. If the inner and outlet cylinders are very close to each other, the fluidized adsorbent resin is very easily broken. In addition, the flow pattern in the vortex flow reactor was abnormal due to the wobbling of the inner cylinder. The abnormal flow pattern could affect the performance of the vortex flow adsorption system.
3.1.3 Improving the Outlet of Vortex Flow Reactor
In order to solve the accumulation and wobbling problems associated with the vortex flow reactor with the old configuration, some modifications were made with the help of the MIT Central Machine Shop. The geometric dimensions listed in Table 3-1 were kept for the new vortex flow reactor.
Figure 3.3: Structure of two bearings holding stainless steel core of inner cylinder
The sidewall of the outer cylinder was perforated very close to the top with multiple holes that were covered with nylon mesh (Sefar America) to retain the adsorbent resin but allow the passage of the fluid. A short cylindrical shell, called the buffer cylinder, was attached to the outer cylinder to cover the multiple-hole area. By doing this, a so-called fluid buffer region was created. The outlet fluid flowed through the multiple-hole area, where the carried resin particles were separated from the fluid; thus, the fluid with no resin particles flowed out of the buffer cylinder. Some details about the multiple-hole area and buffer cylinder are illustrated in Figure 3.4.Instead of having a very high linear velocity at the outlet with a small
Top Bearing Bottom Bearing Inner Cylinder St eel Shaf t to Magnetic Drive
cross-sectional area in the old configuration, the fluid flowed at a very low linear velocity across the multiple-hole area. This is advantageous for the separation between the adsorbent resin and the fluid on the mesh. There were no accumulation of resin particles and appearance of gas bubbles with the new configuration used in the vortex flow adsorption system.
Figure 3.4: Multiple-hole area and buffer cylinder of vortex flow reactor
3.1.4 Improving Drive Shaft of Vortex Flow Reactor
In the new configuration, the bearings holding the stainless steel shaft positioned through the inner cylinder have a large diameter and are separated by a long distance. The diameter of the bearings and the distance between them in the old and new configurations are compared in Table 3-2. In this way, the rotating motion can be transmitted smoothly from the magnetic drive to the far end of the inner cylinder. Even when the rotation rate goes as high as 500 or 600 rpm, there is no wobbling. Multiple Holes Outer Cylinder Buffer Cylinder Outlet Mesh
Table 3-2: Geometric Dimensions of Bearings
Old Configuration New Configuration
Bearing Diameter (cm) 0.47 0.80
Bearing Distance (cm) 2.48 4.74
By making all these modifications, the vortex flow reactor with the new configuration can be used to study the vortex flow adsorption process with either clarified protein system or crude E. coli cell extract with cellular materials.
3.2 Media
Two types of growth media, complex medium and semi-defined medium, were used in this work. The complex medium was Luria-Bertani (LB) medium prepared at 25 g/L (10 g/L BactoP TM P tryptone, 5 g/L BactoP TM P
yeast extract, and 10 g/L sodium chloride). LB medium was used to grow overnight cultures and prepare frozen cell stocks. The semi-defined medium was based on the M9ZB medium (Ausubel et al., 1995) with the addition of a trace metals stock solution. The semi-defined medium was used for the majority of the expression experiments as it permitted cell growth to high densities and resulted in significant and consistent yields of recombinant proteins.
Media stock solutions were prepared according to Table 3-3 and autoclaved separately. Semi-defined medium was prepared immediately prior to inoculation by adding the appropriate volume of each stock solution to autoclaved Milli-QP
TM
P
water in a baffled shake flask (liquid volume = 1/5 total volume). For example, to prepare 100 ml semi-defined medium, add 10 ml M9 stock (10×), 10 ml Tryptone/NaCl stock (10×), 2.5 ml glucose (20%, 40×), 150 µl Trace Metals (667×), 100 µl MgSOB4B (1000×), and appropriate antibiotics to 77 ml water.
Table 3-3: Media Stock Solutions
Components Stock Concentration (g/L) Concentration in Media M9 Stock (10×) Titrated to pH 7.4 with NaOH
NaB2BHPOB4B 60 42 mM KHB2BPO4 30 22 mM NaCl 5 8.6 mM NHB4BCl 10 18.7 mM 1 M MgSO4 Stock (1000×) MgSOB4B 120.4 1.0 mM Tryptone/NaCl Stock (10×) Tryptone 100 10.0 g/L NaCl 50 86.0 mM Glucose Stock (20%, 40×) Glucose 200 5.0 g/L
Trace Metals Stock (667×)
NaB2BEDTA • 2HB2BO 20.30 81.80 µM CaClB2B • 2HB2BO 0.51 5.20 µM FeClB3 B• 6HB2BO 16.90 93.80 µM CuSOB4 B• 5HB2BO 0.16 0.96 µM MnSOB4B • HB2BO 0.13 1.15 µM CoClB2 B• 6HB2BO 0.18 1.15 µM ZnSOB4B • 7HB2BO 0.18 0.91 µM
Antibiotics were added to the media as a selective pressure to maintain plasmid-containing cells. Plasmids encoding recombinant proteins included the β-lactamase gene, and
ampicillin was added to the media at 50 µg/ml for plasmid maintenance. Ampicillin stock solution was prepared as 100 mg/ml in deionized (DI) water and stocked at –20°C.
isopropyl β-D-thiogalactopyranoside (IPTG) stock solution to an induction concentration of 0.4
mM.
3.3 Expression Strain
E. coli BL21 (DE3) from Novagen (Madison, WI) was used as the expression strain. As
a lysogen of bacteriophage DE3, E. coli BL21 contains chromosomal copies of LacI repressor and T7 RNA polymerase, the latter controlled by an IPTG-inducible LacUV5 promoter. Addition of IPTG induces transcription of the T7 RNA polymerase. The T7 RNA polymerase binds to the T7 promoter contained on the plasmid vector and transcribes the recombinant protein gene.
3.4 Plasmids
The intein α1-antitrypsin fusion protein is encoded by plasmid pT12AT1. The plasmid
pT12AT1 was constructed from the plasmid pTYB12 for the IMPACTP
TM
P
(Intein Mediated Purification with an Affinity Chitin-binding Tag) protein purification system (New England Biolabs). The expression of the fusion protein was under the control of an IPTG-inducible T7 promoter for T7 RNA polymerase.
In the intein α1-AT fusion protein, human α1-antitrypsin was fused to the C-terminus
of a modified Saccharomyces cerevisiae intein (Sce VMA intein, 55 kD) containing a Bacillus
circulans chitin-binding domain (CBD) (Chong et al., 1998a). The N-terminus of the fusion
protein is composed of 12 amino acids that are derived from E. coli maltose binding protein (MBP) to provide a favorable translational start. Additionally, in cloning human α1-antitrypsin
gene from the plasmid pEAT8-137 (Laska, 2001a) using the NdeI site in pTYB12, three extra residues (Ala-Gly-His) were added to the N-terminus of α1-antitrypsin (Xu et al., 2000).
In the plasmid pEAT8-137, an N-terminal Glu in the human protein is replaced by Met to permit translation initiation for pEAT8-137 in E. coli. Compared to the cDNA sequence reported in the literature (Long et al., 1984), the pEAT8-137 α1-antitrypsin sequence contains the following base pair differences: codon 96 [Phe (TTC) → Phe (TTUTU)], codon 101 [Arg
(CGT) → His (CUAUT)], codon 137 [Leu (UUG) → Leu (UCUUG)], and Codon 376 [Glu (GAA) →
Asp (GAUCU)]. The initial parental plasmid pEAT8 was a generous gift of Dr. Myeong-Hee Yu
of the Korea Research Institute of Bioscience and Biotechnology (Lee et al., 1993). pMYB5 is a control plasmid for the IMPACTP
TM
P
protein purification system. This plasmid carries the E. coli malE gene, encoding the maltose binding protein (MBP, 42 kD), fused to the N-terminus of the Sce VMA intein containing a chitin-binding domain. The expression of the fusion gene is also under the control of an IPTG-inducible T7 promoter. In this work, pMYB5 was used as a comparison control since it is the best scenario for the IMPACTP
TM
P
protein purification system. The detailed information about pMYB5 can be found at the New England Biolabs web site: Uhttp://www.neb.comU.
3.5 Cell Growth and Induction
Cell growth was monitored by measuring the optical density (OD) at the wavelength of 600 nm. Approximately 1 ODB600 B• ml of cells is equal to 0.34 g dry cell weight (Winkler,
1995). Overnight cultures were inoculated with frozen stocks at -85°C and grown in LB medium containing 50 µg/ml of ampicillin at 37°C for a period of ~12 hours. Typically, shake
cell growth. Overnight cultures typically achieved a cell density of ~7.0 and a portion was used to inoculate fresh semi-defined medium containing 50 µg/ml of ampicillin at an ODB600 Bof 0.05.
When a cell density of 0.6-0.8 was reached, the temperature was lowered to 30ºC and IPTG was added to a final concentration of 0.4 mM to induce the expression of the fusion protein for 3 hours. Other induction conditions with different induction temperatures and induction time are to be mentioned where they are used in this work.
3.6 Downstream Processing
The E. coli shake flask cultures were harvested and immediately cooled on ice. The cultures were centrifuged using an IEC CRU-5000 centrifuge (International Equipment Company) at 2,000 rpm for 30 minutes, washed with TE3 buffer (100 mM Tris, 5 mM EDTA, pH 8.0), and resuspended in TE3 buffer. The resuspended cells were transferred to 16×100 mm
DurexP
TM
P
borosilicate glass culture tubes and disrupted with a Branson Sonifier 450 with microtip (Branson Ultrasonics) at 50% duty cycle and output control 3 to release intracellular recombinant proteins. Each 10-ml aliquot was sonicated three 60-second cycles. To prevent excessive heating during sonication, glass sample tubes were suspended in an ice water bath and a 30-second rest period was allowed between sonication cycles. A non-clarified cell extract was directly loaded to the vortex flow system to be processed. If necessary, disrupted cell extract was centrifuged using an IEC Centra 4 centrifuge (rotor 820, International Equipment Company) at ~11,000 rpm for 30 minutes in the cold room. The supernatant was decanted and sterile-filtered with a 0.22 µm Millex®-GV syringe filter (Millipore) and stored on ice as
3.7 Protein Assay
3.7.1 Total Protein Assay
The total protein concentration in the samples was determined using the Bradford method with Bio-Rad protein assay reagent (Cat. 500-006). A standard curve was generated with bovine serum albumin (Fraction V, Sigma, A-7906).
3.7.2 Sodium Dodecyl Sulfate - Polyacrylamide Gel Electrophoresis (SDS-PAGE)
Tris-HCl gels (Bio-Rad Ready Gels, cat. 161-1119 or 161-1155) were used with reducing sample buffer, shown in Table 3-4, for protein quantification. A Bio-Rad Mini-Protean® 3 Electrophoretic Cell filled with the running buffer listed in Table 3-5 (Sambrook et
al., 1989) was used to run the gels. Polyacrylamide gels were stained by immersing in
Coomassie blue staining solution with gentle shaking for at least two hours and destained in destaining solution until the background stain was sufficiently removed. The staining and destaining solutions were prepared according to Table 3-6 (Laska, 2001c).
Table 3-4: SDS-PAGE Sample Buffer Solution
Stock Solution Reducing Sample Buffer (based on 100 ml)
0.5 M Tris • HCl, pH 6.8 12.5 ml 62.5 mM 50% (v/v) Glycerol 20 ml 10 % (v/v) 10% (w/v) SDS 20 ml 2 % (w/v) β-mercaptoethanol 5 ml 5% (v/v) 0.5% Bromophenol Blue 20 ml 0.1 % (w/v) Deionized Water 22.5 ml
Table 3-5: SDS-PAGE Running Buffer Solution
Reagent 5× (based on 1 Liter) 1× (pH 8.3)
Tris Base 15.1 g 25 mM
Glycine 94.0 g 250 mM
SDS 5.0 g 0.1 % (w/v)
Table 3-6: Coomassie Blue Staining and Destaining Solutions
Reagent Staining Solution Destaining Solution
Coomassie Blue R-250 0.003 % (w/v) -
Acetic Acid 10 % (v/v) 10% (v/v)
3.7.3 Western Blotting
Proteins were transferred from polyacrylamide gels to PVDF membranes (Bio-Rad, 162-0184) using a Bio-Rad Mini Trans-Blot® Electrophoretic Cell. Rabbit anti-human
α1-antitrypsin IgG antibody (Sigma, A-0409) was used as the primary antibody and goat anti-rabbit IgG horseradish peroxidase conjugate (Sigma, A-0545) was used as the secondary antibody. ECL Plus detection reagents (Amersham Biosciences, RPN 2132) were used for detection. Membranes were exposed to Kodak X-OMAT AR film or Kodak Biomax MR film and developed.
3.7.4 Densitometry
A Molecular Dynamics Personal Densitometer SI was used with ImageQuant® software (Molecular Dynamics; Sunnyvale CA) to scan Coomassie-stained polyacrylamide gels and imaging films from chemiluminescent Western blotting. Protein bands were quantified
using a local median background correction method and were compared to α1-antitrypsin
standards loaded on the gels when necessary.
3.7.5 N-terminal Amino Acid Sequencing
Protein bands separated with SDS-PAGE were transferred from a polyacrylamide gel to a Bio-Rad PVDF membrane with a CAPS (3-cyclohexylamino-1-propanesulfonic acid) transfer buffer (10 mM CAPS, 10% methanol, pH 11). After transfer, the PVDF membrane was stained with Coomassie Blue R-250 acetic acid solution, destained, rinsed with water, and air-dried. N-terminal amino acid sequencing was performed at the MIT Biopolymers Laboratory. Stained protein bands were cut from the membrane and sequenced by Edman degradation using an Applied Biosystems Model 474 Procise Protein Sequencer, Model 140C Microgradient Delivery System, and Model 785A Programmable Absorbance Detector.
3.7.6 Activity Assay
The activity of α1-antitrypsin can be measured using any protease that is inhibited by antitrypsin. In this work, porcine pancreatic elastase was used to measure the activity of
α1-antitrypsin. A major benefit of this assay is that it can be performed in either crude cell extracts containing the intein α1-antitrypsin fusion protein or purified α1-antitrypsin samples.
The elastase inhibitory capacity (EIC) of α1-antitrypsin or the intein α1-antitrypsin
fusion protein was determined using a method previously described (Beatty et al., 1982) with slight modifications (Konz, 1998). The antitrypsin activity in a sample is determined by measuring the rate of an elastase-catalyzed reaction in the presence and absence of antitrypsin. The difference in reaction rates is equal to the amount of elastase inhibited by antitrypsin, or EIC of antitrypsin.
A 0.05%(w/v) elastase solution was prepared just before the assay by adding porcine pancreatic elastase (Sigma, E-1250) to 100 mM NaCl. The amount of elastase added was chosen so that the slope of the blank samples free of antitrypsin was approximately 1 mAU/Sec. A substrate working solution of 2 g/L N-succinyl-(Ala)B3B-nitroanilide (Sigma,
S-4760) in Tris buffer (100 mM, pH 8.0) was prepared from a stock of 40 g/L N-succinyl-(Ala)B3B
-nitroanilide in dimethyl sulfoxide stored at –20° C.
α1-Antitrypsin samples were mixed with 50 µl of the elastase working solution and Tris
buffer to a final volume of 1.05ml and incubated at room temperature for 30 minutes. Residual free elastase was measured by combining 2 ml of Tris Buffer, 100 µl of substrate working
solution, and the incubation mixture into a quartz cuvette. After rapid mixing, the appearance of the N-succinyl-(Ala)B3B-nitroanilide cleavage product was measured at 410 nm for 30–60
seconds with a Hewlett Packard 8452A Diode Array spectrophotometer. The absorbance data were fit to a straight line and the slope was recorded in mAU/Sec. The EIC was calculated as the difference in slopes between the antitrypsin containing samples and the antitrypsin free controls. The specific activity was typically expressed on a unit volume (ml) or unit soluble protein (mg) basis. The cuvette was washed with dilute HCl (30 mM) between readings to improve the reproducibility of the results. Samples and blanks were incubated and assayed in triplicate.
3.8 Residence Time Distribution (RTD) Study
In residence time distribution (RTD) experiments, Alizarin Red S (Eastman) was used as a pulse tracer with molecular weight 326 and molecular diffusion coefficient, DBmB, 7.5×10P
-10
P
mP
2
P