Publisher’s version / Version de l'éditeur:
Vous avez des questions? Nous pouvons vous aider. Pour communiquer directement avec un auteur, consultez la
première page de la revue dans laquelle son article a été publié afin de trouver ses coordonnées. Si vous n’arrivez pas à les repérer, communiquez avec nous à [email protected].
Questions? Contact the NRC Publications Archive team at
[email protected]. If you wish to email the authors directly, please see the first page of the publication for their contact information.
https://publications-cnrc.canada.ca/fra/droits
L’accès à ce site Web et l’utilisation de son contenu sont assujettis aux conditions présentées dans le site LISEZ CES CONDITIONS ATTENTIVEMENT AVANT D’UTILISER CE SITE WEB.
Nanotechnology in Construction Conference [Proceedings], pp. 227-237, 2003-06-01
READ THESE TERMS AND CONDITIONS CAREFULLY BEFORE USING THIS WEBSITE.
https://nrc-publications.canada.ca/eng/copyright
NRC Publications Archive Record / Notice des Archives des publications du CNRC :
https://nrc-publications.canada.ca/eng/view/object/?id=582208ec-7b7a-4c74-8985-791268775a35 https://publications-cnrc.canada.ca/fra/voir/objet/?id=582208ec-7b7a-4c74-8985-791268775a35
NRC Publications Archive
Archives des publications du CNRC
This publication could be one of several versions: author’s original, accepted manuscript or the publisher’s version. / La version de cette publication peut être l’une des suivantes : la version prépublication de l’auteur, la version acceptée du manuscrit ou la version de l’éditeur.
Access and use of this website and the material on it are subject to the Terms and Conditions set forth at
Synthesis and characterization of nanoparticulate calcium aluminates Mitchell, L. D.; Margeson, J. C.; Beaudoin, J. J.
Synthesis and Characterization of Nanoparticulate Calcium Aluminates
Mitchell, L.D.; Margeson, J.; Beaudoin, J.J.
NRCC-38446
A version of this document is published in / Une version de ce document se trouve dans : Nanotechnology in Construction Conference, Paisley, Scotland,
June 23, 2003, pp. 227-237
SYNTHESIS AND CHARACTERIZATION OF NANOPARTICULATE CALCIUM ALUMINATES
L.D. Mitchell, J. Margeson and J.J. Beaudoin
National Research Council Canada, Institute for Research in Construction, 1200 Montreal Road, Ottawa, ON. Canada
1 INTRODUCTION
Nanoscale science and technology has emerged as a very active research area in recent years. Its scope encompasses a wide range of disciplines. The use of nanoparticulate solids is a natural step in the potential application of nanoscale science to the construction sector. Nanoparticles offer the potential for stronger and more flexible cement-based materials. They will have an inevitable influence on the hydration characteristics of the hydraulic phases in cements.
A number of techniques exist for the production of nanocrystalline and nanoparticulate oxide materials. Some of these are relatively complex and/or produce very small quantities of material, e.g. laser techniques. Additional techniques include high energy ball milling, cap precipitation, and other solution based routes. Many of the latter routes are relatively straightforward gel and combustion techniques that rely on complexation and dispersion with rapid heating respectively to achieve small crystallite sizes.
A technique was recently described in the literature that combines both dispersion and combustion in a single synthesis route. This technique relies on the use of a highly acidic sucrose solution to complex cations.1 The solution is concentrated, foamed and charred to form a combustible carbonaceous foam material that yields an oxide on combustion. The authors repeated the work of Das in producing nanoparticulate alumina,2 and found the technique to be practical in the laboratory.
To retain the simplicity of this synthesis technique, nitrate salts of the various cations are required. This requirement means that its application to silicate materials would be complex in comparison to aluminate materials. Consequently, this study examined the simplest hydraulic aluminate material, CaAl2O4; a logical extension of the previous
alumina study.2
All calcium aluminate cements (CAC's) contain monocalcium aluminate as their principle hydraulic phase in amounts from 40% upwards. Monocalcium aluminate (CaAl2O4, or CA) is usually monoclinic.
It has been reported that a meta-stable orthorhombic form of CA can be formed under certain conditions.3 This requires the use of ‘chimie douce’ type techniques such as the Pechini method.4 This orthorhombic form has very similar cell parameters to the
monoclinic structure described by Hörkner5 apart from the small monoclinic distortion exhibited by the latter.
2 EXPERIMENTAL
The raw material was synthesised using stoichiometric quantities of Ca(NO3)2·6H2O and
Al(NO3)3·9H2O dissolved in an aqueous solution of sucrose, with a sucrose:cation molar
ratio of 4:1. The solution was heated to 65ºC with stirring to ensure full dissolution, before dehydration on a hot plate at 250ºC for 8 hours to form a brown viscous liquid. The caramelized mass was transferred to an oven at 200°C for 18 hours to foam, dehydrate and char the sample. The carbonaceous precursor was then fired in air inside a muffle furnace at 600ºC for 24 hours to oxidise the carbon. The resulting white fluffy powder was removed, purged with dry nitrogen and stored in an air-tight container.
The materials produced were examined using a number of techniques, including the Brunauer-Emmett-Teller method (BET) for surface area determination, powder X-Ray Diffraction (XRD), Scanning Electron Microscopy (SEM), conduction calorimetry, Simultaneous Differential Scanning Calorimetry (DSC) and Thermal Gravimetric Analysis (TGA), and Vickers hardness measurement.
The surface area values were obtained using a Quantachrome Quantasorb analyser, with nitrogen gas as the absorbate.
Powder X-ray diffraction data were obtained using both a Scintag XDS 2000 diffractometer with Cukα radiation in conjunction with a graphite monochromator, and a
Bruker D8 diffractometer equipped with dual mirror parallel beam optics, using Cukα
radiation
SEM micrographs were taken using a Cambridge Stereoscan 250. Samples were prepared with carbon adhesives on aluminium stubs, and then sputter-coated with gold. The conduction calorimetry was performed with a laboratory made calorimeter. Readings were taken every ten minutes in °C, with a precision of 0.01 °C.
Simultaneous Differential Scanning Calorimetry and Thermal Gravimetric Analysis (DSC/TGA) measurements were taken with a TA Instruments Q600 SDT. The measurements were carried out under flowing nitrogen, using a heating rate of 10ºC per minute.
Microhardness measurements were made with a Leitz Miniload Microhardness tester set up with a Vickers hardness diamond stylus. At least 3 load weights were used to give a range of diamond sizes.
Vickers hardness is determined by producing an indentation with a pyramid shaped diamond, and optically measuring the indentation produced, see Figure 1. Vickers hardness was calculated for each imprint and the average and standard deviation for each load series was calculated.
Figure 1 Hydrated monoclinic CA with pyramid-shaped Vickers Hardness indentations.
3 RESULTS
3.1 Characterisation of Anhydrous Materials
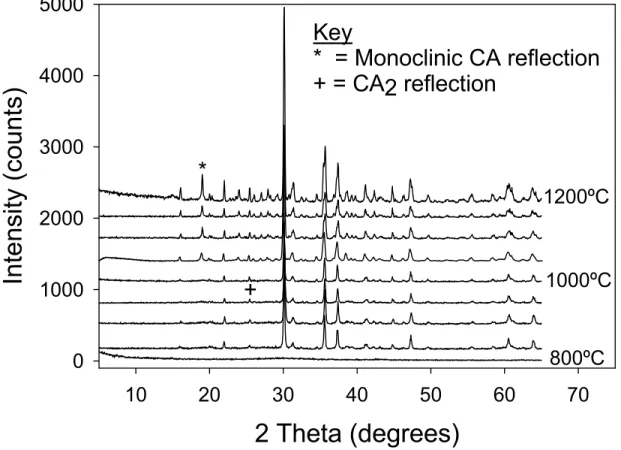
The gel-structured-CA fired at 600°C for 24 hours is a very fine, fluffy, white amorphous powder with a surface area of 75 to 150 m2/g. No detectable changes in the material could be observed with XRD until the material was heated to 850°C, as seen in Figure 2. CA2
and an orthorhombic monocalcium aluminate were identified at this temperature. The CA2 persists as a minor phase throughout the whole experiment. The orthorhombic
monocalcium aluminate phase was stable up to 1000°C after which a phase transition was observed; the orthorhombic monocalcium aluminate converted to the monoclinic. The observation of monoclinic CA at 1050°C from an amorphous gel broadly agrees with the results of Williamson & Glasser (1962)6 who made monoclinic CA from an amorphous gel at 1045°C. However these authors did not report the existence of an orthorhombic phase.
2 Theta (degrees)
10
20
30
40
50
60
70
Intensity (counts)
0
1000
2000
3000
4000
5000
800ºC
1200ºC
*
1000ºC
+
Key
* = Monoclinic CA reflection
+ = CA2 reflection
Figure 2 X-ray diffraction spectra of the amorphous nano-CA starting material heated between 800-1200ºC 944°C -10 -5 0 Hea t Fl ow ( W /g ) 75 80 85 90 95 100 W eight (%) 0 200 400 600 800 1000 1200 Temperature (°C) Exo Up
Figure 3 shows an initial water loss at about 150°C, even though the sample has been previously heated to 600°C, indicating it very quickly reacts with moisture from the atmosphere. The heat flow curve also exhibits an exotherm at about 945ºC. This is interpreted as a phase change and corresponds well with the XRD data show in Figure 1. The XRD data shows that it is at this point that the sample transforms from a gel structured material to a crystalline one.
20,000X 1,000X
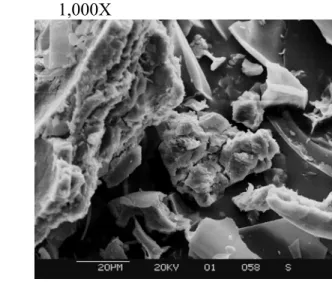
Figure 4 Scanning Electron Micrograph of gel-structured CA calcined at 600ºC
20,000X 1,000X
20,000X 1,000X
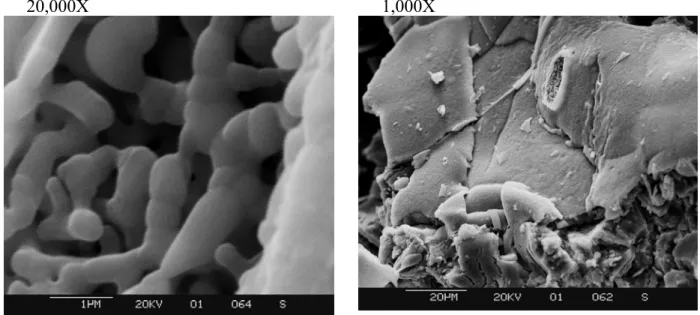
Figure 6 Scanning Electron Micrograph of gel-structured CA calcined at 1200°C
Figures 4, 5 and 6 show scanning electron micrographs of the gel-structured CA calcined at three different temperatures, 600, 1000, and 1200ºC. Clear evidence of physical change can be seen in Figure 5, and Figure 6. This is attributed to grain growth akin to sintering. This crystal growth is probably responsible for the observed surface area decreases, and the particle size increase of the material with increasing temperature.
3.2 Characterisation of Hydrated Materials
Amorphous gel-structured-CA material calcined at 600°C was mixed with distilled water at a w/c ratio of 4.0 and left to hydrate in a calorimetry cell. This extremely high water to cement ratio was required due to the very high surface area of the starting material (~100 m2/g). At this water to cement ratio the sample produced a workable paste. The conduction calorimetry results can be seen in Figure 7 along with those for blends (see table 1) of gel-structured and monoclinic CA, hydrated at a W/C 0.5. The hydrated material was subsequently characterised using both XRD and TGA (Figure 8 & Figure 9).
The results in Figure 7 show that the amorphous gel-structured-CA is hydraulic. The sample exhibits the classical calorimetry curve associated with calcium aluminate cements. This appears to be the first time that CA with an amorphous gel structure has exhibited classical cement characteristics. Nakagawa et al7 heated bauxite and quicklime to 1700°C and quenched the subsequent melt, producing amorphous calcium aluminate. They found their material flash set in a matter of seconds and minutes and did not exhibit the behaviour observed here. Nakagawa et al also had to mix their material at a high w/c ratio (4.0 w/c).
Figure 7 shows that the initial peak observed for the gel-structured material is significantly greater than that observed for the blended (see table 1) and monoclinic samples. In addition, the end of the acceleration period occurs approximately 6 hours before the corresponding peak of the monoclinic only sample. The reaction rates of the blends also increase with the fraction of gel-structured material: all this indicates that the gel-structured material is very reactive.
0 5 10 15 20 25 30 35 40 45 50 0 5 10 15 20 Time (hours)
Rate of Reaction (cal/g/h)
Monoclinic only 2:1 Monoclinic / Gel-structured 1:1 Monoclinic / Gel-structured 1:2 Monoclinic / Gel-structured Gel-structured only Gel only→ ←Monoclinic only
Figure 7 Calorimetry curves displaying exothermic hydration reactions of CA systems 0 100 200 300 400 500 600 700 800 900 1000 5 15 25 35 45 55 6 2 Theta (degrees) Intensity * = C3AH6 + = Gibsite † = CAH10 † † * + Wet Dried 5
948°C -3.5 -2.5 -1.5 -0.5 0.5 Heat Fl ow ( W /g ) 60 70 80 90 100 Wei gh t ( % ) 90 290 490 690 890 1090 Temperature (°C) Exo Up
Figure 9 DSC/TGA curves of the dried 24 hour hydrated amorphous CA material
The XRD data in Figure 8 show that the main hydration phases are CAH10, C3AH6 and
gibbsite. There is little evidence of the presence of C2AH8. Evidence for formation of
CAH10 was found in both the XRD and the DSC/TGA curves. The conversion of CAH10
to C3AH6 has probably occurred, with the increased presence of gibbsite supporting this
argument.8 It is possible that the high surface area and the small particle size of the hydrates accelerate the conversion process; more work on this system is needed to confirm this.
Figure 9 shows the TGA curve and the corresponding heat flow curve for the oven dried material (80°C) shown in Figure 8. There is a small peak at 150°C probably due to CAH10. The dual peaks occurring in the temperature range 200-270°C represent
dehydration reactions involving gibbsite and C3AH6.9 The small peak at ~675ºC has been
assigned to calcium carbonate. The phase transition at about 950°C was discussed earlier, and represents the unhydrated material left in the sample (see Figure 10). The heating regime transforms the material from a gel-structured to a crystalline material at this temperature. This spectrum provides further evidence for the hydraulic nature of the anhydrous gel-structured CA created.
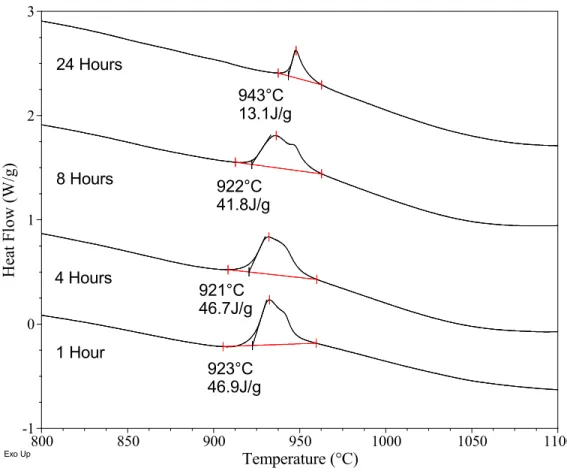
1 Hour 4 Hours 8 Hours 24 Hours 943°C 13.1J/g 921°C 46.7J/g 922°C 41.8J/g 923°C 46.9J/g -1 0 1 2 3 He at F low (W /g) 800 850 900 950 1000 1050 1100 Temperature (°C) Exo Up
Figure 10 Heat flow curves (800-1100°C) of gel-structured CA material hydrated for 1, 4, 8, & 24 hours
In Figure 3 the apparent phase transition in the region of 940ºC was clearly demonstrated. Following the decay of this exotherm in the hydrating material facilitates study of hydration kinetics. The results from such measurements are shown in Figure 10. The results show that the dormant period ended sometime after 4 hours, which is in agreement with the calorimetry data. The apparent phase transition for the unhydrated material in Figure 3 had a heat flow (indicated by the exotherm) of 349J/g. Using this figure as a reference for 100% unhydrated material, it would appear that approximately 87% of the original anhydrous material reacted within the first hour of hydration. After 24 hours, only 4% of the original material remained.
3.3 Microhardness - Evaluation of Physical Properties
The high surface area of the gel-structured CA created an enormous water demand. The microhardness measurements were therefore carried out on blends of commercial monoclinic CA (manufactured by CTL) and gel-structured CA.
The approximate blended volume ratios were 1:2, 1:1 and 2:1 monoclinic-CA : gel-structured-CA. This was achieved by using the two materials in the mass ratios shown in Table 1.
Table 1 Material compositions used for the Vickers Hardness testing
Volume Ratio Weight Ratio
1 : 2 Monoclinic / Gel-structured 1.000g CA 0.100g Gel-CA 1 : 1 Monoclinic / Gel-structured 1.000g CA 0.050g Gel-CA 2 : 1 Monoclinic / Gel-structured 1.000g CA 0.025g Gel-CA
The paste made was thick but workable (w/c 0.5) and the mix was placed into small microforms. The dimension of the microforms was 15 mm diameter and 5 mm height. The form was sealed with parafilm on the bottom of the form and the paste was worked into the forms to remove any trapped air. Then a glass cover was placed over the individual sample. Both sets of samples were marked and placed in a 100% RH environment at room temperature to hydrate.
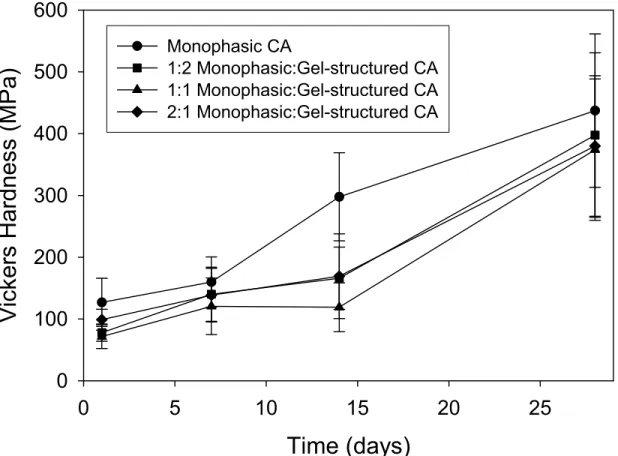
The results can be seen in Figure 11. There are no statistically significant differences in the properties of the nano-modified cements. This is surprising, given the expected improvements in particle-packing densities. The probable explanation for this, is the tendency of the nanomaterial to agglomerate in water. These agglomerates will act as 'micro-particles.' Thus little change in the Vickers hardness results was observed with changing composition. Further work on the physical properties of nano-modified cement systems is required. Studies to evaluate the efficiency of using various dispersing agents are in progress.
4 DISCUSSION
Major investments both in Canada and around the world will establish nano-science and nano-technology as a growth area of science and engineering. With the construction industry being identified as a potential growth market for nano-materials, new and novel techniques will emerge in the coming years as this sector expands. The successful creation of monocalcium aluminate using a novel sucrose-based polymer dispersion technique is perhaps one of the first examples of innovation to emerge from the application of nano-science to cement research. It has proven to be a cheap and reliable synthesis route.
Before nano-materials can become commercially successful however, the products have to be cheaper, thinner, lighter, stronger or tougher. This has been the goal of many materials scientists throughout the last century. A good or clever technology isn't necessarily sufficient to have an impact in the marketplace. The product has to have significant improvement over competing products.
Time (days)
0
5
10
15
20
25
Vi
ck
ers
Hardnes
s (M
Pa)
0
100
200
300
400
500
600
Monophasic CA 1:2 Monophasic:Gel-structured CA 1:1 Monophasic:Gel-structured CA 2:1 Monophasic:Gel-structured CAFigure 11 Graph showing the development of microhardness of several different ratios of monoclinic CA to gel-structured CA
5 CONCLUSIONS
A unique synthesis route for producing monocalcium aluminates has been described. It has been shown that the resultant material is hydraulic, has a gel-structure, and is very reactive.
The use of nanoscale hydraulic materials has advantages and disadvantages. The very high surface area of the material affects both the hydration kinetics and water requirements. The latter makes the use of any high surface area material problematic, in terms of adequate mixing at desirable water/cement ratios. Conventional mixing techniques require excessive water to provide an acceptable rheology. The use of admixtures or alternative mixing methodologies, for example high-shear mixing, may reduce the problem. It is unclear whether this problem can be completely overcome.
Rheology and surface science are going to be significant study areas for the future of nano-materials in cement science. Water to cement ratio is an extremely important parameter for cement-based materials used in the construction industry. The addition of high surface area materials, that will raise this ratio significantly, will meet resistance in non-specialist applications. Should the problem with water-demand be solved, then the possibility of high strength, rapid-setting materials could become a reality.
Acknowledgements
The authors would like to acknowledge Mr Gary Polomark for his useful discussions regarding the thermal analysis. Dr Pamela Whitfield provided valuable assistance in the X-ray diffraction analysis and the preparation of this manuscript.
References
1 R.S. Das, A. Bandyopadhyay and S. Bose, Journal of the American Ceramic Society, 2001, 84, 2421-2423
2 L.D. Mitchell, P.S. Whitfield, J. Margeson and J.J. Beaudoin, J. Mat. Sci. Lett., 2002,
21, 1773-1775
3 S. Ito, K. Ikai, M. Suzuki and M. Inagaki, Journal of the American Ceramic Society, 1975, 58, 79-80
4 P.A. Lessing, American Ceramic Society Bulletin, 1989, 68, 1002-1007
5 W. Hörkner and H.K. Müller-Bushbaum, J. Inorg. Nucl. Chem., 1976, 38, 983-984 6 J. Williamson and F.P. Glasser, J. Appl. Chem., 1962, 12, 535-538
7 K. Nakagawa, I. Terashima, K. Asaga and M. Daimon, Cement and Concrete Research, 1990, 20, 655-661
8 J. Bensted and P. Barnes, Structure and Performance of Cements ( Spon Press, London, 2002).
9 V.S. Ramachandran R.M. Paroli and J.J. Beaudoin, Handbook of Thermal Analysis of Construction Materials ( Noyes Publications/Williams Andrew, New York, 2003).