HAL Id: hal-00849474
https://hal.archives-ouvertes.fr/hal-00849474
Submitted on 31 Jul 2013
HAL is a multi-disciplinary open access archive for the deposit and dissemination of sci-entific research documents, whether they are pub-lished or not. The documents may come from teaching and research institutions in France or abroad, or from public or private research centers.
L’archive ouverte pluridisciplinaire HAL, est destinée au dépôt et à la diffusion de documents scientifiques de niveau recherche, publiés ou non, émanant des établissements d’enseignement et de recherche français ou étrangers, des laboratoires publics ou privés.
Bo Jönsson, Jacques Persello, Joaquim Li, Bernard Cabane
To cite this version:
Bo Jönsson, Jacques Persello, Joaquim Li, Bernard Cabane. The equation of state of colloidal disper-sions.. Langmuir, American Chemical Society, 2011, 27, pp.6606-6614. �hal-00849474�
Revised version, January 7, 2011
The equation of state of colloidal dispersions
Bo J¨onsson1, J. Persello2
, J. Li3
and B. Cabane3
(1) Theoretical Chemistry, Chemical Center, POB 124, S-221 00 Lund, SWEDEN. (2) LPMC, CNRS UMR 6622, Universite de Nice, 06103 Nice cedex 2, FRANCE. (3) Laboratoire PMMH,
ESPCI,10 Rue Vauquelin, 75231 Paris cedex 5, FRANCE.
Abstract
We present a comparison of experimentally and theoretically determined osmotic pressures for various colloidal dispersions. Experimental data is collected from several different silica and polystyrene dispersions. The theoretical pressure determinations are based on the Primitive Model combined with the Cell Model and the physical quantities are calculated exactly using Monte Carlo simulations in the canonical and grand canonical ensemble. The input to the simulations in terms of colloidal particle size, surface charge density etc are taken directly from experiments and the approach does not contain any adjustable parameters. The agreement between theory and experiment is excellent without any fitting parameters showing that the simplifications behind the primitive model and the cell model are physically sound.
For one of the silica dispersions we have also investigated how various monovalent coun-terions influence the swelling properties. Within experimental errors, we are unable to detect any ion specificity, which is another support for the theoretical models used.
Introduction
Osmotic pressure is the primary property of a colloidal dispersion, in the same way as ordinary pressure is that of a molecular gas. It measures the drive of a dispersion towards higher entropy, i.e. a larger volume per colloidal particle, or in other words, the resistance of the dispersion to the extraction of the liquid that disperses the particles. For stable colloidal dispersions, the osmotic pressure increases with the volume fraction occupied by the particles, and this increase is the equation of state of the dispersion[1, 2, 3, 4, 5, 6, 7, 8]. Changes of state of the dispersion, such as fluid-solid transitions, orientational transitions and the crossover to a state where the colloidal particles aggregate are usually associated with changes in the slope of the equation of state[7, 9, 10].
It is important to be able to understand and predict these changes of state, since they are the key to the practical use of colloidal dispersions. For example, many industrial processes start with a dispersion in a fluid state at moderate volume fraction, and extract some or all of the liquid phase to produce a solid material. This is the case for coatings, where the fluid dispersion is evaporated to yield a solid layer that protects or modifies the surface. It is also the case for ceramics, where a concentrated dispersion of ceramic particles is compressed to yield a wet paste, called a green body, that has sufficient cohesion to retain a set shape, and a sufficient volume fraction to allow sintering. Moreover, there are a number of solid-liquid separation processes such as filtration and centrifugation, in which an external pressure is applied to overcome the osmotic pressure of the dispersion and achieve the desired change of state.
These processes are most often described using some representation of interparticle forces, e.g. for charged particles through the DLVO theory[11, 12]. However, the determination of interparticle forces is possible only with model particles and model surfaces, and the calculation of dispersion properties from the pair interactions involves assumptions that are not easily validated. The connection of dispersion properties to osmotic pressure is, in most cases, more direct, and it can also provide a determination of the average interparticle forces in the ”real” system. Moreover, the measurement of osmotic pressures can reveal the presence of small species (polymers, or small colloidal particles) that are not seen by other techniques, but which may have dramatic effects on the properties of the dispersion[7, 13].
There are now a number of reliable measurements of the equation of state of colloidal dispersions [1, 2, 3, 4, 5, 6, 7, 8, 9, 10, 13, 14, 15]. For ionic dispersions, these equations of state span huge ranges of pressures, from 101
to 106
Pa or more. Making a model of the dispersion and calculating its equation of state is an excellent and critical way of finding out whether the model is a good representation of the physical system. If the model is validated in this way, it can presumably be trusted to predict accurately other properties of the dispersion, such as the thresholds for the changes of state.
For ionic dispersions, the major contribution to the osmotic pressure originates from the counterions of the ionized colloidal particles, since they are by far the most numerous species and give the largest contribution to the entropy of the system. This contribution is reduced by the electrical potential that tends to accumulate the counterions near the particle surfaces, and by other (”chemical”) interactions that bind the counterions to surface sites. A consequence of the attraction of the counterions by the surfaces is that the particles tend to be localized at regular distances, in a configuration that minimizes the repulsion generated by their counterions. Consequently the dispersion can be accurately described by the Cell Model, which assumes that each colloidal particle sits in the middle of a spherical cell, surrounded by its counterions.
Classically, the counterion distribution within the cell is calculated through the Primitive Model, which describes water as a homogeneous medium only characterized by its
dielec-tric constant, and the Poisson-Boltzmann equation, which is a mean field solution to the counterion distribution. The early work of Belloni and co-workers yields predictions of the osmotic pressure that are in good agreement with experiments[7, 8]. However, the mean field theory may not represent accurately the true counterion distribution, espe-cially when the particles have a high surface charge density or when divalent counterions are present[16]. Also, we do not know to what extent the primitive model of aqueous solutions is valid in the vicinity of particle surfaces.
There is an even more simple description of the distribution of the counterions within the cell, where it is assumed that most of the Z counterions of a particle, are condensed on its surfaces, and only Zef f are dispersed in the solution. Zef f is refered to as the
”effective” charge of the colloidal particle. In this ”two state model”[17, 18], the osmotic pressure is then calculated by assuming that the distribution of the Zef f ”free” counterions
is uniform within the cell. Some criteria have been proposed to predict the value of Zef f[19, 20], but most often, Zef f is treated as an adjustable parameter. In many cases
this simple model reproduces the variation of osmotic pressure with the volume fraction of the dispersion[18]. However, treating Zef f as an adjustable parameter obscures the
comparison between model predictions and experiments, which could reveal microscopic phenomena that take place in the system.
In this work, we present the equations of state obtained for aqueous dispersions of nano-metric particles, mostly made of silica. The motivation for using silica colloids is twofold. Firstly, aqueous silica dispersions can be concentrated reversibly to high volume fractions, where the surface-surface distances of neighboring particles are on the order of 2 nm. At such short distances, the interstitial solution may not behave as a homogeneous medium, and specific interactions between ions in solution and the charged surfaces may become important. Such details at the molecular level are ignored in the models listed above. Sec-ondly, it is relatively easy to exchange the original Na+
counterions with other monovalent counterions in the series H+
, Li+
, K+
, Cs+
and N(CH3) +
4. This exchange may reveal ion
specific effects. Indeed, ion specificity is a recurring theme in both surface and colloid chemistry and biochemistry dating back to the famous Hofmeister series [21, 22, 23]. Both cations and anions have been ascribed specific interactions. It is generally agreed that an-ions show larger specificity usually attributed to their higher polarisability [24], although recent atomistic simulations have indicated that the polarisability might not be the most important mechanism for ion specificity [25]. Thus, osmotic pressures of silica dispersions with different ions were measured at high silica volume fractions, with the aim to reveal any ion specific effects.
We use Monte Carlo (MC) simulations in the canonical and grand canonical ensemble to determine the distribution of co- and counterions in a spherical cell of uniform dielectric constant around a colloidal particle. The number of counterions is determined by the ionization of the particle surface, which is known experimentally from titration experi-ments. By changing the cell radius we vary the colloid volume fraction in the dispersion, and hence obtain the equation of state of the dispersion. Since water is described as a
dielectric medium and the counterions as charged spheres with a hard core radius, the predicted osmotic pressures are the same regardless of the nature of the counterion. Next, we compare this theoretical equation of state with the osmotic pressures measured on dif-ferent silica and polystyrene dispersions with monovalent counterions. The question we want to answer is if the experimental equations of state can be rationalized within the primitive model without any adjustable parameters or is a more sophisticated atomistic approach needed?
Monte Carlo Simulations in the Cell Model
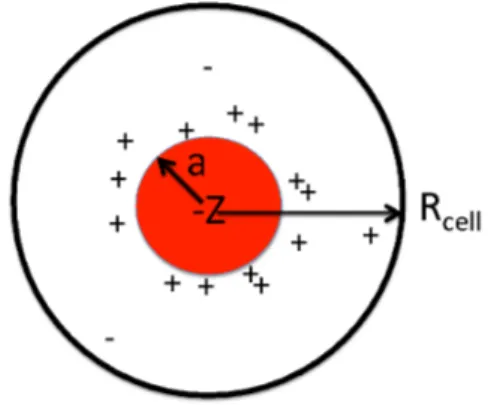
Figure 1: A central charged colloidal particle with radius a and a net charge Z is placed in a cell with radius Rcell. The cell is electroneutral and contains besides the counterions also salt pairs whose
concentration is determined by an equilibrium with the surrounding bulk solution.
We model the dispersions as a set of hard spheres with a radius, a, and a surface charge density, σ. The colloidal particles are neutralized by small spherical ions mimicking sodium, potassium etc. and in addition the system also contains positive and nega-tive monovalent salt ions. All co- and counterions are given a radius of 0.2 nm. The electrostatic interactions in the system are described in the primitive model, where the solvent (water) is treated as a structureless dielectric continuum with a dielectric constant, ǫr = 78.7. No other interactions are included in the simulations. The primitive model
means a dramatic decrease of number of molecules compared to an atomistic model. Still it is hardly possible to simulate a charged dispersion including many colloidal particles, their counterions and added salt. In order to make the simulations feasible, we have in-troduced the so-called cell model[26, 27, 16]. This means that we consider the colloidal dispersion as consisting of independent cells each containing one colloidal particle and neutralizing counterions and salt. The size of the cell, which is assumed to be spherical with the radius, Rcell, then determines the colloidal volume fraction, φ. A schematic
Formally we can write the ion-colloid and ion-ion interactions in the system as, u(ri) = ZcollZie2 4πǫ0ǫrri ri > a + 0.2 (1) u(ri, rj) = ZiZje2 4πǫ0ǫr|ri− rj| |ri− rj| > 0.4 (2)
where Zcoll = 4πa2σ is the charge of the colloidal particle, Zi the charge of ion i and ri
its coordinate. This is augmented with the condition that the interaction is infinite if any two ions overlap and also if ri > Rcell.
The simulations were performed in the canonical and grand canonical ensembles following standard procedures[28, 29]. Typically 103
-104
moves/particle were generated for equili-bration and about ten times more for production. The osmotic pressures were calculated from the ion concentrations at the cell boundary according to the contact theorem[30, 16],
Π = RTXci(Rcell) (3)
The experimentally relevant quantity is the net osmotic pressure,
Πnet = Π − Πbulk (4)
where the bulk osmotic pressure, Πbulk, is evaluated in a separate simulation of an isotropic
salt solution of a given concentration. For the bulk simulations we use the canonical en-semble combined with an extended Widom technique for calculations of the salt chemical potentials[31, 32]. Equation (4) gives the net pressure as a difference between two simu-lated numbers, hence at low osmotic pressures a high accuracy is needed for both Π and Πbulk. This means that the simulations can be quite demanding at high salt concentrations
and/or low colloid volume fractions.
We have also compared our simulations results to the predictions of the Poisson-Boltzmann (PB) equation [33]. For systems with monovalent counterions and not too highly charged dispersions, the PB approximation is an excellent approximation. It also works as a com-plement to simulations as it allows investigations of larger particles, that is with many thousands of counterions, as well as systems with large amounts of added salt and low volume fraction.
Experimental Section
Silica dispersions
We used mainly colloidal silica dispersions that were synthesized in the laboratory through neutralization of sodium silicates by nitric acid[34, 8, 18]. They had mean radii in the
vicinity of 10 nm (the exact value is specified for each dispersion) and a narrow distribution of diameters (relative width = 13 %). All these dispersions were washed with water at pH 9 until the ionic strength was 10−3 M or below.
Some dispersions were obtained from commercial products (Ludox HS40, Sigma-Aldrich) through the same washing procedure. According to SAXS spectra of concentrated dis-persions, the number average radius of these particles was 7.5 to 8 nm.
The surface charge of the sodium silica dispersions has been measured by Foissy and Persello[35, 36]. At basic pH values it is negative and its magnitude increases rapidly with pH. A typical value of the surface charge density at pH=9 is σ = 0.5 − 0.6 e/nm2
[35]. At pH 3 the surface charge is low but still negative.
In order to obtain silica particles with different counterions, we equilibrated a dispersion synthesized as above with an H+
loaded cation exchange resin; : in a first stage, Amber-lite IRC86 weakly acidic, H+ form, and then for final pH adjustment, AmberAmber-lite IR120 strongly acidic, H+ form. Then we washed the dispersion with pure water and brought the pH back to 9 with a base of the desired cation. In this way we obtained silica dis-persions with identical particle size distributions, and Li+
, Na+ , K+ , Cs+ or N(CH3) + 4 as counterions.
Aqueous dispersion of polystyrene particles
We reproduce osmotic pressure data from from Bonnet-Gonnet et al. [7]. For these experiments, a dispersion of polystyrene particles was obtained from Interfacial Dynamics Corporation (Eugene, Oregon, USA). The particle cores are made of pure polystyrene, with glass transition temperature 110 oC. The particles are monodisperse with a radius
of 30.5 nm. The major part of the surface is largely hydrophobic, but it also contains a few charged groups: sulfate groups which are the ends of the polystyrene chains, and sulfonate groups from styrene sulfonate monomers which are copolymerized with the styrene monomers. The total surface density of charged groups has been measured through potentiometric titration and found to be σ = 0.14 e/nm2
. The aqueous phase of these dispersions contained 3.5 10−5 M of passive salt.
Osmotic stress method
The osmotic stress technique is based on water exchange between the sample (i.e. a colloidal dispersion) and a reservoir of known osmotic pressure. A complete description of this method can be found elsewhere[2, 3, 7]. Briefly, the sample is placed in a dialysis bag which, in turn, is immersed in a reservoir that contains a solute (generally a polymer) for which the relation between osmotic pressure and concentration is known. The cutoff
of the dialysis bag is chosen so that it only retains the polymer and the colloidal particles of the sample. Conversely the solvent, i.e. water, ions and small organic molecules can exchange between both compartments. At equilibrium, the chemical potentials of water and salt on either side of the membrane are equal, and therefore the osmotic pressure of the sample equals that of the polymer in the reservoir. This technique makes it possible to play with interactions in a colloidal system over a wide range of pressure.
A poly(ethylene glycol) (PEG, also called poly ethylene oxide or PEO) with a molar mass of 35 kDa (Fluka, Switzerland) was used as the ”stressing” polymer. We have determined the osmotic pressure of this polymer in water using a membrane osmometer (Knauer, Germany) for concentrations up to 20% (w/w) at 20oC. The same pressures were found
at pH ranging from 2 to 11 and at sodium concentrations up to 0.3 M. Moreover, it is known that cations do not change significantly the lower critical solution temperature of PEG, and therefore have no effect on its osmotic pressure [37]. The osmotic pressure (in Pa) was fitted to the following expression as a function of weight fraction of PEG, φ (%).
log10(P ) = A + BφC (5)
with A=0.49, B=2.5 and C=0.24 [15].
Solutions of PEG at osmotic pressures from 0.3-200 kPa were prepared by dissolving the polymer in aqueous solutions at concentrations ranging from 0.4 to 15 % (w/w). The pH was adjusted to match that of the aggregated dispersions introduced in the dialysis bags. Standard regenerated cellulose Visking 8/32 dialysis bags with a molecular weight cutoff of 12-14 kDa were used (Medicell International Ltd, UK). These bags were chosen so as to allow exchange of ions and water but not silica particles nor PEG. Prior to the experiments, the bags were washed in deionized water. Then, the silica dispersions were placed in the bags and immersed in the polymer solutions kept at 20oC. The content
of the bags was adjusted (and readjusted) so that the bags were neither too full nor too flat, because in either case there would be a contribution to the actual pressure from the elasticity of the bag. After equilibrium was reached (30 days), a sample of the concentrated dispersion was taken from each bag and dried at 120oC in order to determine
the concentration.
In the experiments made with polystyrene dispersions and in the case of silica dispersions with exchanged cations, the pressures were measured through dialysis equilibrium against solutions of dextran T110, as described in reference [7].
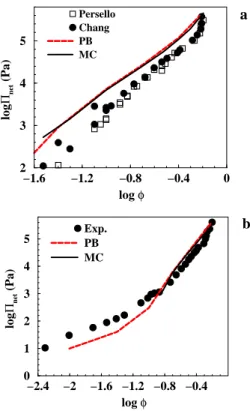
−1.6 −1.2 −0.8 −0.4 0 log φ 2 3 4 5 log Πnet (Pa) Persello Chang PB MC a −2.4 −2 −1.6 −1.2 −0.8 −0.4 log φ 0 1 2 3 4 5 log Πnet (Pa) Exp. PB MC b
Figure 2: Osmotic pressures as a function of colloidal volume fraction. a) The experimental data at 1 mM salt from Chang et al. [8] and Persello et al. [38] are shown as filled spheres and open squares, respectively. Simulated pressure is shown as black solid line. The curve was obtained with a particle radius of 10 nm and a surface charge density of 0.5 e/nm2. The same system has also been investigated
with the PB equation and the resulting pressure is shown as a red dashed curve. b) Experimental and simulated pressure at 10 mM salt. The experimental data from Chang et al. [8]. The addition of salt is likely to cause a titration of the silanol groups with a slight change of the charge density. This will, however, not change the pressure to any measurable extent - see below.
Experimental Results
Equation of state for Na
+counterions
The compression curves of two different silica dispersions are presented in Figure 2. The dispersions were made of silica particles of the same mean radius of 10 nm, but they were synthesized in separate experiments[8, 38]. Also, the compression curves were obtained by different researchers, both using the osmotic stress technique. The good agreement of both sets of data implies that the measured compression curve is uniquely determined by the characteristics of the particles. It is also remarkable that these compression curves cover a range of two decades in silica volume fractions and five decades in pressures. Finally, some experiments have been performed in the reverse direction, reswelling the concentrated silica dispersions. It was found that the dispersions that were compressed up to a volume fraction φ = 0.5 could be reswelled in a reversible way. Consequently, the
part of the compression that extends from the lowest volume fractions (φ = 0.02) up to φ = 0.5 is an equation of state of the silica dispersions.
−1.6 −1.2 −0.8 −0.4 log φ 2 3 4 5 log Πnet (Pa) Exp MC PB
Figure 3: Osmotic pressures as a function of volume fraction for Ludox HS40. The experimental data points at 5 mM salt are shown as symbols while the simulated pressure curve is drawn as a solid line. The PB pressure is shown as a red dashed curve. Particle radius and charge were 8 nm and 402e, respectively.
The compression curves of commercial silica dispersions (Ludox HS40), washed through dialysis at pH =9, are shown in Figure 3. In this case the mean particle radius was 8 nm.
Equation of state for other counterions
−1.6 −1.2 −0.8 −0.4 log φ 2 3 4 5 log Πnet (Pa) Cs+ K+ Na+ Li+ N+(CH3)4 MC
Figure 4: Osmotic pressures as a function of volume fraction for silica particles with a=10 nm and various counterions. Solid black line = Cs+
, dotted red line = K+
, short dashed green line = Na+
and long dashed blue line = Li+
. The dot-dashed violet line = N(CH3) +
4 and the dashed black line = H +
, respectively. The simulated pressures are shown as filled squares. The bulk salt concentration is 0.5 mM.
In the previous sections we have shown the experimental osmotic pressure for Na+
dispersions. Figure 4 shows that the counterion type does not play any role for the swelling characteristics. Dispersions with different alkali counterions, from Li+
to Cs+
, follow the same equation of state up to the highest compression. Even with a bulky and slightly hydrophobic counterion like N(CH3)
+
4, the same net osmotic pressure is found.
Using H+
as counterion changes the pressure, but in this case the particles become partly neutralized. The pressure is, however, far from that of a neutral dispersion, indicating that although the pH has been lowered due to the H+
ions, the particles still maintain a small (less than 10 %) but significant surface charge density.
Equation of state for polystyrene dispersions
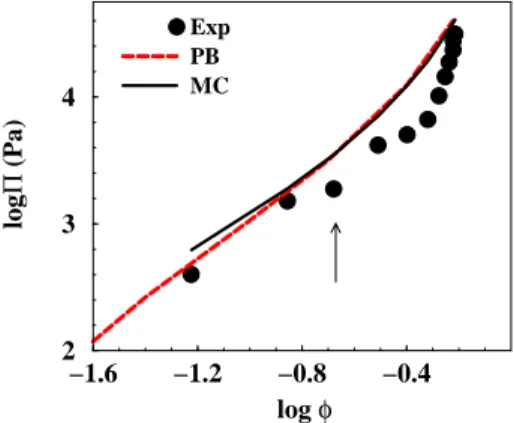
−1.6 −1.2 −0.8 −0.4 log φ 2 3 4 log Π (Pa) Exp PB MC
Figure 5: Osmotic pressures of polystyrene dispersions (a = 30.5 nm, σ = 0.14 e/nm2) in water at pH
7 and salt concentration 3 · 10−5 M. Experiments = symbols, MC simulation = solid black line and PB
= dashed red line. The arrow indicates where the transition to a soft solid takes place.
Dispersions of polystyrene particles were compressed by osmotic stress at pH 7 and ionic strength 3 · 10−5 M. The original dispersion, at a volume fraction φ = 0.06, was fluid
and white. As the pressure was raised, it became iridescent and viscous; at a pressure of 1800 Pa the volume fraction reached 0.214 and the dispersion turned to a soft solid. At this volume fraction the mean surface to surface separation is approximately 30 nm and comparable to the Debye screening length (κ−1 = 55 nm). Previous work on polystyrene
dispersions indicates that in such conditions the dispersions order as colloidal crystals[1]. Thus, the iridescent colors are the result of Bragg diffraction on reticular planes of particles within the crystallites.
The experimental pressure vs. volume fraction curve is shown in Figure 5. Over a large range of volume fractions (φ = 0.1 − 0.5) the pressure is between 1-10 kPa. The pressure is rather high even at low volume fractions. This is due to the low ionic strength and weak electrostatic screening.
Comparison between simulations and experiments
Variation of pressures with particle volume fraction
As the volume fraction of particles in the dispersion rises, the experimental pressures increase by a factor of 103
to 104
. Over this range, the MC simulations in the cell model, made at the same ionic strength, reproduce the variation of the experimental pressures. This agreement, obtained without any adjustment of the model parameters, implies that the theoretical model does a good job of capturing the physics of swelling in ionic dispersions - see Figures 2-5.
In some cases the magnitude of the predicted pressure is systematically too high by about 50%. For experiments that were performed through dialysis of colloidal silica dispersions against a solution of PEG (Figures 2 and 3), this discrepancy can originate from an inadequate equation of state for PEG 35000. We note that experiments on similar particles, dialyzed against solutions of Dextran, give results that are in perfect agreement with simulation results (Figures 4 and 5). On the other hand, the cell model neglects the interactions between neighboring cells, and one can anticipate that this should lead to a too repulsive pressure [39].
At the highest volume fractions, close to φ=0.6, some of the experimental data show an upturn to a much steeper repulsion (see Figure 5). This could be due to aggregation of the particles, which is not accounted for in the present model, but can be described by incorporating surface-surface bonds in the model [40]. It could also reflect that the system is approaching the limit of densely packed spherical particles, φ ≈??. It is, however, quite remarkable that the present approach reproduces the osmotic pressures of dispersions up to φ = 0.55, corresponding to surface-surface distances of about 2 nm - see Figure 2. This agreement indicates that the primitive model used here to describe water as a continuous dielectric medium works well down to distances of a few molecular diameters. The same (surprising?) conclusion has been reached in surfactant systems where the osmotic pressure has been measured through centrifugation equilibrium [41].
The largest difference between experimental and theoretical pressures in this study is seen for the polystyrene dispersion, where the dispersion forms a solid at volume fractions larger than approximately 0.2.
Effects of ion charge, radius and hydration
For the colloidal dispersions with monovalent counterions reported here, mean field the-ory (PB approximation) yields results that are practically identical with those from MC simulations. This was indeed expected, since it is well-known that ion-ion correlations, not included in the mean field theory, remain negligible in the case of monovalent ions
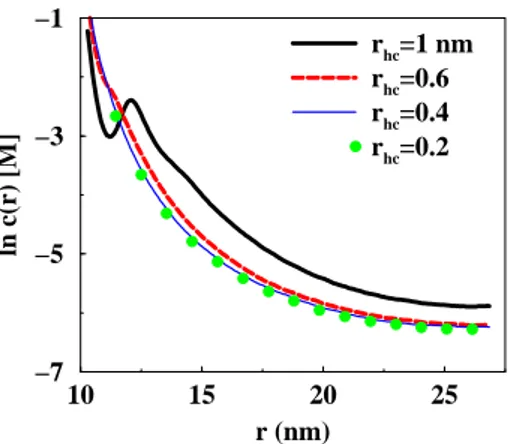
10 15 20 25 r (nm) −7 −5 −3 −1 ln c(r) [M] rhc=1 nm rhc=0.6 rhc=0.4 rhc=0.2
Figure 6: Simulated counterion ion concentration profiles in the cell. The central charged sphere has a charge of -628e and a radius of 10 nm. The cell radius is 27.1 nm corresponding to a volume fraction of 5.0 %. The counterion radius has been varied as: black solid line = 1, dashed red line = 0.6, thin blue line = 0.4 and green symbols = 0.2 nm.
and moderate surface charge densities. However, MC simulations show an effect of ion-ion correlation-ions, both on the counterion-ion concentration-ion profile in the cell as well as on the interaction between cells, when the surface charge density becomes high, exceeding 1-2 e/nm2
or when divalent or higher valency counterions are present [42]. With the monovalent counterions in the series Li+
, Na+ , K+ , Cs+ and N(CH3) + 4 we
ex-pected to see ion-specific effects, since their adsorption on silica surfaces and the colloidal stability of the dispersions should change according to ion type [43, 44, 45]. Yet the os-motic pressures with different counterions are identical - see Figure 4 (H+
is an exception, since it titrates the silanol groups creating a weakly charged surface). This apparent conflict is well explained, already by the mean field theory and further supported by MC simulations. Indeed, the behavior of ions in the immediate vicinity of a charged surface may change according to their radii and hydration. However, such changes are screened by the accumulation of ions near the surface, and the ionic concentration at the cell boundary remains the same regardless of ion radius or hydration - see Figure 6. It is only with an unphysical ionic radius of 1 nm one finds a significant change in the counterion profile. This is in good agreement with a recent determination of the composition of the adsorbed cation layer [46]. This lack of ion specificity for the alkali cations is in agreement with second virial coefficient measurements for lysozyme solutions [47] as well as swelling properties of montmorillonite [48]. In the latter case it is found that Ca2+
and Mg2+
clays show the same swelling behaviour despite the fact that in this case the aqueous layer is only about 1 nm thick.
0 0.1 0.2 0.3 0.4 0.5 σ (e/nm2) 0 0.2 0.4 0.6 0.8 1 Π/Π max φ=0.04; a=10 nm φ=0.3; a=10 nm φ=0.3; a=20 nm a
Figure 7: Scaled osmotic pressure as a function of surface charge density for three different systems with varying particle radius, a, and volume fraction φ. The actual pressure is scaled with the pressure at σ = 0.5 e/nm2 for each case. From MC simulations with no added salt.
Effects of surface charge
The same ”decoupling” of ionic concentrations at the cell boundary from interactions near the charged surface appears when the surface charge density is changed. Indeed, the osmotic pressure increases with surface charge density, but for a given system with a fixed particle and cell size it approaches an asymptotic value. The approach towards this value, in particularly for dilute system, is fast. This means that for a colloidal silica dispersion with a particle radius of 10 nm and a volume fraction in the range 4-30 %, half the maximal osmotic pressure is reached at a rather modest surface charge density of 0.05-0.10 e/nm2
. For larger particles the asymptotic value is reached at even lower σ see Figure 7. On the other hand, at very low surface charge densities, the counterions behave as an ideal gas and the osmotic pressure becomes proportional to σ. However, such low surface charge densities are only reached at low pH when the colloidal silica particles have been neutralized by acid (cf. H+
counterions in Figure 4), and then the colloidal stability is marginal. Thus, the common situation is that of high surface charge densities, where the osmotic pressure becomes independent of anything that happens near the charged surface.
Distribution of counterions within the cell
The message from the cell model is that the osmotic pressure is determined by the distri-bution of ions at the cell boundary in equilibrium with the bulk ionic solution. Indeed, the behavior described above, i.e. the law for the variation of pressure with volume fraction, and the fact that the pressure is to a large extent independent of what happens near the particle surfaces, are consequences of these conditions. The actual distributions of ions within the cell are not accessible to experiments, but they can be calculated theoretically.
10 15 20 25 r (nm) −8 −6 −4 −2 ln[c(r) (M)] 10mM 0mM 0mM; plane
Figure 8: The counterion concentration for a cell of radius Rcell=27.1 nm and a particle of radius a =
10 nm, with a surface charge density of 0.5 e/nm2. Full black line: the cell is in equilibrium with pure
water, dashed red line: the bulk solution contains 10 mM monovalent salt and red line with symbols: same distribution but with the bulk concentration subtracted off. The green dot-dashed curve shows the counterion concentration in a planar cell with the same thickness of the aqueous layer (17.1 nm) and the charged surface place at r = 10 nm.
Figure 8 shows the distributions calculated for a typical silica dispersion. All these distri-butions show the same accumulation of counterions near the particles surface: since the local concentration of counterions is quite high, it is rather insensitive to the addition of 10 mM passive salt. At large distances, the salt-free case has an algebraic decay, while the salted one with the bulk concentration subtracted off, shows the expected exponential decay of counterion concentration, due to screening by passive salt. The characteristic length of this decay is 2.3 nm, while the Debye-H¨uckel screening length is 2.5 nm based on all charged species. (the screening length corresponding to the salt concentration in the reservoir is 3 nm). Hence the Debye-H¨uckel description is a fair approximation to the distribution of counterions away from the particle surface.
Geometrical features
Particle size
A reliable theoretical model allows us to make predictions for situations that cannot be produced experimentally. For instance, it is possible to investigate the effect of particle size, keeping all other parameters constant, i.e. same surface charge density and same volume fraction of particles(a/Rcell =const.) For a cell in equilibrium with the bulk ionic
solution, the concentrations of counterions and coions at the cell boundary tend toward their bulk concentrations as the cell size becomes large compared to the screening length. iFigure 9 shows that the resulting net osmotic pressure seems to decay ex-ponentially with the particle size. Note that the cell size is varied in the same proportion, since the volume fraction is kept constant. The good
agree-0 20 40 60 80 100 a(nm) −6 −3 0 3 6 ln Πnet (kPa) φ=0.1 cs=0.1mM φ=0.1 cs=1mM φ=0.3 cs=1mM
Figure 9: Particle size effect on the osmotic pressure from PB calculations. The surface charge density is σ = 0.5 e/nm2
and volume fraction and salt concentration is varied. Lines and symbols represent the net osmotic pressure in spherical and planar symmetry, respectively. The calculations in planar geometry is done with one charged and one neutral surface and the aqueous layer thickness is equal to Rcell− a in
the corresponding spherical system.
ment between the pressures evaluated in spherical and planar symmetry is reassuring, since it indicates that any irregularities in particle shape have no significant effect on the pressure. Figure 9 also tells us that dispersions of large particles approaching micron size are only weakly stabilized by electrostatic interactions unless the salt concentration is very low.
Comparison with planar geometry
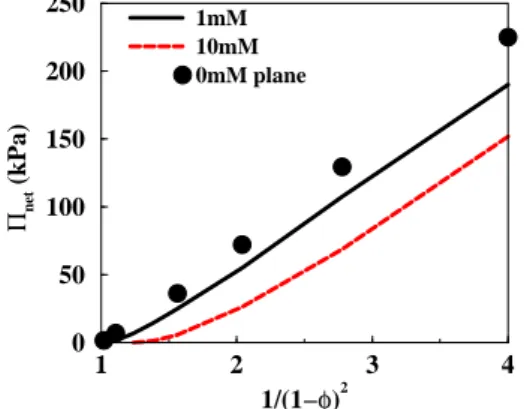
1 2 3 4 1/(1−φ)2 0 50 100 150 200 250 Πnet (kPa) 1mM 10mM 0mM plane
Figure 10: The net osmotic pressure as a function of available counterion volume, i.e. a virial expansion. The particle size in the spherical cell is a = 10 nm and the surface charge density is 0.5 e/nm2. The
pressure curves for salt concentrations of 0 and 1 mM are virtually identical. Symbols show the osmotic pressure in the corresponding planar system with the same thickness of the aqueous layer.
The behavior presented above are consequences of the accumulation of counterions at the particle surfaces and equilibrium of co- and counterions with similar ions in the bulk solu-tion. These two effects are also present in the case of particles that have a platelet shape,
such as clay particles [49]. Figure 8 presents a comparison of counterion concentration profiles in a spherical cell (a = 10 nm, Rcell = 27.1 nm) and in a planar cell with no added
salt. These profiles are surprisingly similar; conversely, it is not surprising that most of the properties of spherical charged colloids described above are similar to the classical be-havior of interacting charged planar surfaces. One can always find quantitative differences due to the geometry, but the overall picture is one of genuine similarity.
For dispersions equilibrated with a bulk solution that has a low ionic strength, MC simu-lations and PB theory indicate that the variation of pressure with volume fraction follows an algebraic law. This is reminiscent of the virial expansion of the osmotic pressure of the solutes (the ions) in the available volume (the cell volume minus the particle volume). Indeed, the first term in this expansion is proportional to the concentration of ions in the available volume, and therefore to 1/(1 − φ), while the second term is proprtional to 1/(1 − φ)2
. Figure 10 shows that become dominant at higher volume fractions with the result that Π ∝ 1/(1 − φ)2
. This variation is a bit surprising, but an explanation is provided by the comparison with planar geometry, which shows the exact same variation, once the half cell thickness h has been converted into (1 − φ). In planar geometry, the pressure varies asymptotically as 1/h2
at no or low salt conditions [50, 51].
Conclusion
The experimental osmotic pressures of colloidal dispersions of spherical particles are quite well reproduced by simulations in the primitive model combined with the cell model, and, in the case of monovalent counterions, by calculations made with the Poisson-Boltzmann equation. The simulations allow predictions for situations that are not easily accessed experimentally, such as a systematic study of how particle size affects the pressure. More-over, they provide some very instructive comparisons with the pressure expected in other geometries, particularly planar geometry usually applied to platelet shaped particles. In particular, at low salt concentration and moderate to high volume fractions, the spherical cell model yields almost exactly the same pressures as the half cell in planar geometry with the same distance between the charged surface and the neutral surface. The other limit, at high salt concentrations and low volume fractions, is well described by the hard sphere model. Intermediate cases, with low salt and low volume fractions, or high salt and high volume fractions, are more complex, and in those cases simulations are indispensable. The osmotic pressures can be predicted with a high accuracy in the simulations, which means that these simulated pressures can be used to understand the behavior of colloidal dispersions in practical situations such as filtration, centrifugation, evaporation and flow.
References
[1] S. Hachisu and Y. Kobayasi, J.J. Colloid Interface Sci. 46, 470 (1974).
[2] V. A. Parsegian, N. L. Fuller, and R. P. Rand, Proc.Natl.Acad. Sci. USA. 76, 2750 (1978).
[3] V. A. Parsegian, R. P. Rand, N. L. Fuller, and D. C. Rau, Methods Enzymol. 127, 400 (1986).
[4] M. Nagy and F. Horkay, Acta Chim. Acad. Sci. Hung. 103, 387 (1980). [5] S. Rohrsetzer, P. Kovacs, and M. Nagy, Colloid Polym. Sci. 264, 812 (1986).
[6] J. W. Goodwin, R. H. Ottewill, and A. Parentich, Colloid Polym. Sci. 268, 1131 (1990).
[7] C. Bonnet-Gonnet, L. Belloni, and B. Cabane, Langmuir 10, 4012 (1994).
[8] J. Chang, P. Lesieur, M. Delsanti, L. Belloni, C. Bonnet-Gonnet, and B. Cabane, J. Phys. Chem. 99, 15993 (1995).
[9] A. Mourchid, A. Delville, J. Lambard, E. Lecolier, and P. Levitz, Langmuir 11, 1942 (1995).
[10] A. Mourchid, E. LeColier, E. van Damme, and P. Levitz, Langmuir 14, 4718 (1998). [11] E. J. W. Verwey and J. Th. G. Overbeek, Theory of the Stability of Lyophobic Colloids
(Elsevier Publishing Company Inc., Amsterdam, 1948).
[12] B. V. Derjaguin and L. Landau, Acta Phys. Chim. URSS 14, 633 (1941).
[13] M. L. Rami, M. Meireles, B. Cabane, and C. Guizard, J. Am. Ceram. Soc. 92, S50 (2009).
[14] A. Bouchoux and P. E. Cayemitte and J. Jardin and G. Gezan-Guiziou and B. Cabane, Biophys. J. 96, 693 (2009).
[15] A. Bouchoux and P. E. Cayemitte and J. Jardin and G. Gezan-Guiziou and B. Cabane, Biophys. J. 96, 2547 (2009).
[16] H. Wennerstr¨om, B. J¨onsson, and P. Linse, J. Chem. Phys. 76, 4665 (1982). [17] A. J. Konop and R. H. Colby, Langmuir 15, 58 (1999).
[18] C. Parneix, J. Persello, R. Schweins, and B. Cabane, Langmuir 25, 4692 (2009). [19] L. Belloni, Colloids Surf. 140, 227 (1998).
[20] E. Trizac, L. Bocquet, M. Aubouy, and H. H. von Gr¨unberg, Langmuir 19, 4027 (2003).
[21] F. Hofmeister, Arch. Exp. Pathol. Pharmacol. 24, 247 (1888). [22] G. Karlstr¨om, Phys. Chem. Chem. Phys. 5, 3238 (2003). [23] W. Kunz, Pure Appl. Chem. 78, 1611 (2006).
[24] B. Ninham and V. Yaminsky, Langmuir 13, 2097 (1997).
[25] B. Jagoda-Cwiklik, R. Vacha, M. Lund, M. Srebro, and P. Jungwirth, J. Phys. Chem. B 111, 14077 (2007).
[26] R. A. Marcus, J. Phys. Chem. 58, 621 (1954).
[27] B. J¨onsson and H. Wennerstr¨om, J. Coll. Interf. Sci 80, 482 (1981).
[28] N. A. Metropolis, A. W. Rosenbluth, M. N. Rosenbluth, A. Teller, and E. Teller, J. Chem. Phys. 21, 1087 (1953).
[29] D. Frenkel and B. Smit, Understanding Molecular Simulation (Academic Press, San Diego, 1996).
[30] D. Henderson, L. Blum, and J. L. Lebowitz, J. Electraanal. Chem. 102, 315 (1979). [31] B. Widom, J. Chem. Phys. 39, 2808 (1963).
[32] B. R. Svensson and C. E. Woodward, Molec. Phys. 64, 247 (1988). [33] B. J¨onsson and H. Wennerstr¨om, J. Phys. Chem. 91, 338 (1987). [34] R. K. Iler, The Chemistry of Silica (John Wiley, New York, 1979).
[35] A. Foissy and J. Persello, In The Surface Properties of Silica, Ed. A. Legrand, Wiley, New York, chap. 4B , 365 (1998).
[36] J. Persello, In Adsorption on Silica Surfaces, Ed. E. Papirer, Marcel Dekker, New York, chap. 10 , 297 (2000).
[37] F. E. Bailey Jr and R. W. Callard, J. Appl. Polym. Sci. 1, 56 (1959).
[38] J. B. Madeline, M. Meireles, J. Persello, C. Martin, R. Botet, R. Schweins, and B. Cabane, Pure Appl. Chem. 77, 1369 (2005).
[39] P. Linse and B. J¨onsson, J. Chem. Phys. 78, 3167 (1983). [40] R. Botet and B. Cabane, Phys. Rev. E 70, 031403 (2004).
[41] O. Sonneville, V. Bergeron, T. Gulik-Krzywicki, Bo J¨onsson, H. Wennerstr¨om, P. Lindner, and B. Cabane, Langmuir 16, 1566 (2000).
[42] B. J¨onsson, H. Wennerstr¨om, A. Nonat, and B. Cabane, Langmuir 20, 6702 (2004). [43] A-C. J. H. Johnson, P. Greenwood, P. Hagstr¨om, Z. Abbas, and S. Wall, Langmuir
24, 12798 (2008).
[44] L. H. Allen and E. Matijevic, J. Coll. Interf. Sci. 31, 287 (1969). [45] G. V. Franks, J. Coll. Interf. Sci. 249, 44 (2002).
[46] A. M. Tikhonov, J. Phys. Chem. C 111, 930 (2007).
[47] R. Piazza and M. Pierno, J. Phys: Condens. Matter 12, A443 (2000).
[48] M. Segad, B. J¨onsson, T. ˚Akesson, and B. Cabane, Langmuir 26, 5782 (2010). [49] B. J¨onsson, C. Labbez, and B. Cabane, Langmuir 24, 11406 (2008).
[50] S. Engstr¨om and H. Wennerstr¨om, J. Phys. Chem. 82, 2711 (1978).
[51] C. Martin, F. Pignon, A. Magnin, M. Meireles, V. Lelievre, P. Lindner, and B. Ca-bane, Langmuir 22, 4065 (2006).