BOLTED JOINT STUDIES IN GRP
byDavid M. Fox B.S., Chemical Engineering
Rose-Hulman Institute of Technology, 1984
Submitted to the Department of Ocean Engineering and the Department of Materials Science and Engineering in Partial Fulfillment of the Requirements for the Degrees of
Naval Engineer and
Master of Science in Materials Science and Engineering at the
Massachusetts Institute of Technology May 1994
0 1994 David M. Fox. All rights reserved. The author hereby grants to MIT and the U.S. Government permission to reproduce and to distribute publicly paper and
electronic copies of this thesis document in whole or in part.
Signature of Author _
Certified by
Frederick J. McGarry, Professo rf----Cvi ineering and Polymer Engineering
Thesis Advisor Certified by
Koichi Masubuchi, Kawasaki Professor of Engineering Thesis Reader Accepted by
Carl V. Thompson II, Prof ssor of Electronic Materials Chairman, Committee on Graduate Students, Department of Materials Science and Engineering Accepted by _
A. Douglas Carmichael, Professor of Power Engineering Chairman, Committee on Graduate Students,-Pepartment of Ocean Engineering
EngU
2 9
iJUN
2 0 1994
.. IB RA RIEPBOLTED JOINT STUDIES IN GRP by
DAVID M. FOX
Submitted to the Department of Ocean Engineering and the Department of Materials Science and Engineering on 6 May 1994 in partial fulfillment of the requirements for
the Degrees of Naval Engineer and
Master of Science in Materials Science and Engineering.
ABSTRACT
An experimental study was carried out to determine the bolt clampup force relaxation behavior in countersunk, single-lap bolted joints between glass/vinylester resin
laminates and steel panels. Additionally, the effect of bolt clampup force relaxation on the bearing strength of such joints was studied.
Specially-instrumented bolts were used to measure clampup force relaxation in ten countersunk joint specimens. A 100,000 pound capacity MTS testing machine was used to evaluate the bearing strength in tension of sixteen countersunk bolted joint specimens torqued to four different levels of initial torque, as well as four similar protruding-head bolted joint specimens (at the same levels of torque).
The results of the relaxation experiments indicate that clampup force varies widely in nominally identical joints at identical torque levels, by as much as a factor of two. In countersunk bolt joints with sufficiently high initial clampup force, the clampup force relaxed in accordance with the inverse power equation proposed by Shivakumar and Crews for protruding-head bolt joints in graphite/epoxy laminates. Relaxation in the present experiments proceeded faster than in the protruding-head joints studied by Shivakumar and Crews; this is believed to have been due to the relative lack of constraint provided at the GRP surface by the countersunk bolt.
The results from the bearing strength experiments suggest that clampup force has only a small beneficial effect on bearing strength in both countersunk and protruding head single-lap joints, when compared to double-lap joints. The reduced effectiveness of clampup force in increasing the bearing strength is believed to be a result of the increased joint rotation and bolt bending inherent in single-lap joints. These phenomena lead to delamination and brooming failure in the GRP, which can be avoided in double lap joints with sufficient bolt clampup force. The countersunk joints failed at a load approximately 20% lower than the protruding head joints.
Thesis Advisor: Frederick J. McGarry
Table of Contents
Abstract ... 2
List of Illustrations and Figures ... 5
List of T ables ... 6
Acknowledgements ... ... ... ... 7
Chapter 1. Introduction ... 8
1.1 Overview ... 8
1.2 B ackground ... 9
Theoretical Models of Bolted Joint Mechanical Behavior .... 11
Finite-Element Modelling of Bolted Joint Mechanical Behavior 17 Empirically-Derived Relaxation Predictive Equation ... 18
Related Work ... 18
Chapter 2. Experimental Procedure ... 20
2.1 Experimental M aterials ... 20
Overview ... ... ... 20
Description of Materials ... 20
2.2 Experimental Set-Ups ... ... ... 25
Relaxation Experimental Set-Up ... 25
Bearing Strength Experimental Set-Up ... 28
Chapter 3. Experimental Results and Discussion ... 33
3.1 Results of the Relaxation Experiments ... 33
3.2 Results of the Bearing Strength Experiments ... 36
3.3 Discussion of Relaxation Experimental Results ... 39
Correlation of Initial Torque with Initial Clampup Force ... 39
Clampup Force Relaxation Behavior ... 45
3.4 Discussion of Bearing Strength Experimental Results ... 51
Bearing Strength Definition ... 51
Sequence of Events in Bearing Strength Tests ... 53
Effect of Clampup Force on the Failure Modes in Each of the Two Joint Types ... 58
Effect of Clampup Force on Bearing Strength ... 59
Chapter 4. Conclusions and Recommendations ... 63
4.1 Conclusions Concerning Relaxation Behavior ... 63
4.2 Conclusions Concerning Bearing Strength Behavior ... 64
Appendix A. Instrumented Bolt Calibration Data ... 68
Appendix B. Tabulated Relaxation Experiment Data and Relaxation Graphs . 79 Appendix C. Bearing Strength Experiment Load-Displacement Curves ... 95
Appendix D. Photographs of Failed Bearing Strength Specimens ... 116
B ibliography ... 123
List of Illustrations and Figures
Fig. 2-1. Conical W asher ... 24
Fig. 2-2. Relaxation Experiment Notional Strain Gage Circuit Diagram .... 26
Fig. 2-3. Relaxation Experiments Joint Specimen Configuration ... 28
Fig. 2-4. Bearing Strength Experiments Joint Specimen Configuration ... 29
Fig. 2-5. Testing Configuration to Minimize Initial Bending ... 31
Fig. 3-1. Relaxation Behavior, Specimens with 60 ft-lbs Initial Torque .... 34
Fig. 3-2. Sample R-6 Relaxation Behavior (35 ft-lbs Initial Torque Specimen) 35 Fig. 3-3. Relaxation Behavior of Specimen R-10 ... 35
Fig. 3-4. Bearing Strength of Countersunk Bolt Joints, GRP/Steel ... 39
Fig. 3-5. Bolt Thread Geometrical Parameters ... 41
Fig. 3-6. Bolted Joint Configurations ... 49
Fig. 3-7. Resolution of Clampup Force in Countersunk Bolt Joint into Components ... 51
List of Tables
Mechanical Properties of Vinylester/Glass Laminate ... Bearing Strength Tests Treatment Matrix ... Bearing Strength Experimental Results ...
ANOVA Table for Torque Effect on Bearing Strength ...
Initial Clampup Force in Relaxation Experiments ...
Experimentally-Determined Relaxation Equation Constants ... Relaxation Behavior in Bolted Joints ...
Table 2-1. Table 2-2. Table Table Table Table Table 3-1. 3-2. 3-3. 3-4. 3-5.
Acknowledgements
Many persons aided me in my search for knowledge as I prepared this thesis.
Although I cannot publicly acknowledge all of these people, the following deserve special recognition:
Professor Fred McGarry, whose advice, counsel, and good will kept me on the right path;
Professor Jeff Reed, who kept an active interest in my research, helped smooth out the programmatic details, and who was always available for advice or friendly discussions; Scott Bartlett and Dr. Milt Critchfield of the Carderock Division, Naval Surface
Warfare Center, who proposed that I study the behavior of bolted joints in composites, and provided financial support and materials for my research;
Noel Tessier of Grace Composites, Inc. of Canton, Massachusetts, who graciously allowed me to use their equipment to cut and drill composite samples, and who was willing to help me with any problems that developed along the way;
Noah Eckhouse, John Mass, and the boys in the Marine Instrumentation and
Computation Laboratory at MIT, for lending me equipment and letting me use their facilities for building my relaxation experiment set-up;
My parents, Daniel and Patricia Fox, for their love, support, and encouragement
throughout my life;
My colleague, LCDR Greg Thomas, whose advice and example helped motivate and
challenge me;
My colleague, LCDR Melissa Smoot, who took care of things for me without needing
to be asked when I was in the hospital with a fractured hip;
Professor Elias Gyftopoulos, who taught me to challenge accepted ideas;
The U.S. Navy, for providing me with the opportunity to further my education at MIT; and
Adolphe Sax, whose marvelous invention provided me with an outlet for the inevitable tensions generated during my studies.
Chapter One
Introduction
1.1 Overview
Glass-reinforced polymeric (GRP) materials offer certain advantages to the designer of Naval ships. A large strength-to-weight ratio, coupled with
electromagnetic transparency and (possibly engineered) sound-dampening properties, render GRP materials as attractive materials for ship decks and deckhouse skins. Unfortunately, these materials, which use a thermosetting resin as a matrix material, cannot be welded as steel can. Thus, if a large structure is to be built of GRP, the inevitable joints must be either adhesively bonded or mechanically fastened. These joining techniques are frequently combined in joints which must support large loads.
Because of this, an understanding of the mechanical behavior of joints in GRP is important.
In a properly designed bolted lap joint in GRP, the failure mode in tension is bearing failure, which occurs when the loaded edge of the bolt hole becomes crushed under the load imposed by the bolt. The stress at which this failure occurs is called the bolt-bearing strength. It is well-known that the bearing strength in a bolted joint in GRP can be increased by increasing the torque on the nut [1]. Shivakumar and Crews have shown, however, that the clampup force in the bolt (which is proportional to the torque applied to the nut) relaxes over time, as the viscoelastic matrix material in the GRP panel creeps under the influence of the load [2]. This effect is exacerbated by
high temperature or high humidity. The overall result is a decrease in the bearing 8
strength of the material.
The Advanced Structures Group of the Carderock Division, Naval Surface Warfare Center (CD/NSWC) is interested in the possible use of a vacuum-assisted
resin transfer molding (VARTM)-produced glass-reinforced vinylester resin for decks and bulkheads in future Naval combatants. For reasons related to producibility and radar cross section, they envision bolting panels of this material to the steel hull using flat-head, countersunk bolts. There is thus a need for an understanding of the
mechanical behavior of such joints. The aims of the current thesis were as follows:
(1) To measure clampup force relaxation in countersunk bolt joints in
glass/vinylester resin laminates, under different conditions of initial force;
(2) To compare the countersunk bolt, GRP results with Shivakumar and Crew's
results for standard hex head bolts in carbon-fiber reinforced epoxy; and
(3) To determine the effect of this clampup force relaxation on the bearing strength
of the VARTM-produced GRP panels.
1.2 Background
Like all polymeric materials, cured vinylester resin behaves viscoelastically at relatively low temperatures (when compared to the creep behavior of metals). This behavior manifests itself as either a stress relaxation effect under the influence of a constant strain, or a creep effect under the influence of a constant stress. These effects are detrimental over a long period of time when the material is used in structural applications.
In GRP materials, the viscoelastic behavior of the resin matrix is mitigated by
the presence of the elastic glass fibers. In directions parallel to the fibers, the fibers carry the loads and restrain the matrix from creeping. If the structural application of the laminate is such that the loads remain in-plane and parallel to the fibers, the
behavior of the composite will be elastic, even over long periods of time. If, however, the laminate is subjected to loads perpendicular to the laminar planes, the fibers can no longer carry loads. The laminate behavior is then dominated by the matrix material, and will be viscoelastic over long periods of time.
In order to achieve maximum bolted joint strength in GRP panels loaded in-plane, bolt holes in GRP materials must be perpendicular to the ply orientations. Thus, any clampup force applied to the laminate by a bolt acts in the matrix-dominated thickness direction, and will cause viscoelastic creep over time. This behavior is complicated by the small area over which the bolt clampup force acts; the material under the force application area is geometrically constrained by the unloaded material to which it is attached. Additionally, as the material creeps, there will be a corresponding relaxation of stress in the bolt.
Because of the anisotropic nature of GRP viscoelasticity, in which viscoelastic behavior is maximized in the thickness direction, any viscoelastic effects in bolt joints will be strongly affected by the geometry of the joint. In particular, the area of
clampup force application, and its orientation with respect to the fibers, will affect the viscoelastic behavior of the laminate.
understanding of bolt clampup force relaxation and its effect on bolt bearing strength is required. The goal of this thesis is to quantify and describe the actual clampup force relaxation behavior of countersunk bolts in GRP, and to determine the effect of this relaxation on the bearing strength of the joint.
Theoretical Models of Bolted Joint Mechanical Behavior
The prediction of stress distributions near bolted joints in fiber-reinforced composite materials is made difficult by the many parameters involved. Because of geometric issues, and the anisotropic behavior of the non-homogeneous composite
laminate, simplifying assumptions must necessarily be made.
The theory of elastic stresses in panels in the vicinity of holes is presented by Savin [3]. The two-dimensional development for isotropic materials begins with the combination of the static equilibrium and compatibility equations into the biharmonic equation,
+ 2 + - 0 (1.1)
ax'
ax ay
2ay
4in which U is the stress function U(x,y), by which the stresses at any point are defined
by:
a - o - = - (1.2)
X
ay
2ax
2axay
The solution to equation (1.1) was shown by N. I. Muskhelishvili [3] to be of the form:
U(x, y)
=
Re[vp,(z)
+X
1
(z)]
where ý, (z) and X, (z) are analytic functions of the complex variable z = x + iy, in
which x and y are the in-plane Cartesian coordinates. Determination of the functions
ý, and X, thus establishes the two-dimensional state of stress at any point in the plane,
subject to specific boundary condition equations that are dependent on the type of problem (i.e., whether stresses or displacements are specified on the boundary contour).
For anisotropic plates, S. G. Lekhnitskii [3] has shown that equation (1.1) can be generalized as:
a'u
a'
a u
aU
'
a
22 - 2S26 + (2S12+S6d) - - 2S16 + S1 - = 0
ax'
4
a
3
3
y
ax
2
ay
2
xay
3
ay
4
(1.4)
where the Sij's are the compliance constants of the material as defined by, for example, Ward [4], with directions 1, 2 and 3 corresponding to linear displacement in the x ,y
and z directions, respectively, and 4, 5 and 6 corresponding to rotation around the x, y
and z axes, respectively. The solution to equation (1.4) can be expressed [3] as :
U(x,y) = F,(x + sy) + F2(x + s2y) + F3(x + s3y) + F4 (x + s4y) (1.5)
where s, = +i , s2=c a+i3 2, s3=s0*, s4 =s2*, and the cj's and j 's are
real constants. (The * signifies the complex conjugate of the starred expression.)
The functions Fj are analytic functions of their respective arguments.
Now, since U(x, y) must be real, equation (1.5) can be expressed as:
U(x,y) = F,(z) + F,() + FI(zi) + F2 (z+)
where z1 = x + sly and z2 = x + s2y.
If the following functions are introduced:
(P
(z
1)
dF,
dz1dF
2dz2
the stresses at any point are given [3] by:
oc
= 2Re [s2
d
dz1 y = 2Re[dp-= dz1 TX = -2Re [si dp dz, and+
S
2d*
+ d*] dz2 dz 2 +S2yl dzzThe corresponding displacements can be expressed [3] as follows:
u (x,y) = 2Re [p p (z) + P2 r (Z)] - Yoy + co
(1.6) (1.7) (1.8a) (1.8b)
(1.8c)
(1.9a)v(x,y) = 2Re[qq (zx) + q2
r(z~)]
+ yox + PO (1.9b)where pj and qj are defined as follows:
P1 = Slls 2 + S12 - S 6s1 P22 = S s 2 +12 - S 2 (1.10)
Sq 2• 12+ - 2 s + S2 -S+22 SS 26s2 (1.11)
S
1
S
q2 =S1 S2
and constants a,, , 0 , and Yo are constants of integration. (The additional terms
associated with these constants in equations (1.9a) and (1.9b) represent total body displacement, and should be set to zero for equilibrium situations.)
The addition of a hole to the panel complicates the analysis. The development of expressions for the stress distribution in finite composite panels near frictionless pin-loaded holes was performed by T. de Jong [5], based on the analysis methods of Muskhelishvili as applied to anisotropic materials by Lekhnitskii.
The functions
4
and W defined in equations (1.7) take the following forms for africtionless, pin-loaded hole in a plate of infinite extent [5]:
9 (z) = A,1InC + 9O1(z) I(z 2) = Al2n (2 + *O(2) (1.12)
In these expressions, Cj is defined as:
Z + z - - 1 (1.13)
1 - isj
The physical geometry requires that the pin can only apply a load to
approximately one-half the circumference of the hole. If we shift to polar coordinates r and 0, with 8 measured from the positive y-axis (which is parallel to the loading direction), a load distribution function which satisfies the load boundary condition
(P = 0 for x/2 < 0 < 3wJ2) is the product of a sine series and a step function, resulting
in the following expression [5]:
+
=
1 00 1 ft a 1 1
Pr Po
E
acosn + [ + an(- +- )sinm]]2 n=1,3 m=1,3 an m, , n -m n+m
(1.14)
in which the special summation operator is defined as follows:
S = E E E E (1.15)
m, n n-1,3 m-2,4 n=2,4 m=1,3
The functions
4
and l are then determined in terms of the series coefficients anafter the application of the stress boundary conditions. The an coefficients, in turn, are determined by application of the displacement boundary condition at the hole edge. The stress distribution around the hole is then determined using Lekhnitskii's method as presented above.
There are several aspects of bolted joints in composite material that complicate theoretical analyses beyond the developments listed above. The first of these is the presence of friction between the bolt and the panel. This phenomenon complicates the analysis because of the existence of regions of slip and non-slip around the
contact area of the pin. Additionally, the coefficient of friction is variable around this are. Several workers, including de Jong, Oplinger, and Oplinger and Gandhi, have developed mathematical models of the pin-loaded hole including friction. As an indicator of the difficulties associated with such analyses, all of these models (with the
exception of de Jong's latest) exclude treatment of the non-slip regions [5].
The addition of frictional effects generally results in a decrease in the tangential and radial stresses near the hole; this beneficial effect is increased as the coefficient
of friction is increased [5].
Other complicating factors besides friction include clamp-up force in the bolt; the size of the contact area (e.g. washer area) between the bolt and the laminate; and the amount of clearance between the bolt and the hole and between the bolt and the
washer. Although these phenomenon have been investigated empirically (by, for
example, Stockdale and Matthews [6] and Herrington and Sabbaghian [7]), the three-dimensional effects caused by variations in these parameters have so far apparently precluded the development of theoretically-based predictive models which account for their effects.
When considering the behavior of countersunk bolted joints in composite laminates, the three-dimensional nature of the clampup force must also be considered, as well as the non-prismatic nature of the bolt hole. In the same manner as for the parameters described above, no theoretical analyses of elastic (let alone viscoelastic) behavior seems to have been performed, because of the complicated geometry. Thus, at the present, analyses of the countersunk bolted joint in composite laminates must be
performed numerically.
Finite Element Modelling of Bolted Joint Mechanical Behavior
Depending on the nature of the phenomenon under study (e.g., bolt-bearing behavior, clampup force relaxation, etc.), the finite-element modelling technique can be applied to the mechanical analysis of bolted joints in composite materials. Typically, bolt-bearing behavior models have been two-dimensional in nature, because of the
high cost of three-dimensional models [5].
Shivakumar and Crews [2] have performed a finite element analysis of
viscoelastic clampup force relaxation in conventional protruding-head bolted joints in carbon fiber/epoxy composites, using the viscoelastic finite-element code VISCEL. They modelled a plane section through the joint, perpendicular to the bolt axis, using two-dimensional membrane elements. Because of the uni-directional, through the thickness nature of the clampup force load in a protruding-head bolt joint, they were able to treat the entire laminate as viscoelastic. This finite-element analysis correlated rather well with experimentally determined clampup force relaxation behavior.
Any finite-element model of a countersunk bolt joint would require the use of three-dimensional model elements which allow the inclusion of anisotropic
viscoelastic properties. The development of such elements would be a formidable task; there are apparently no commercially-available finite-element codes which allow the use of such elements.
Empirically-Derived Relaxation Predictive Equation
Based on experimental data and the finite-element analysis described above,
Shivakumar and Crews have developed a simple equation which predicts the clampup force relaxation in a carbon fiber/epoxy laminate bolted with standard protruding-head bolts [2]. This non-dimensional equation is expressed as follows:
F,
1
F0 + t (1.16)
aT/
where Ft is the clampup force at time t, F0 is the clampup force at time 0, F, is a
constant, n is the viscoelastic power law constant for the laminate, and aTH is a
hygrothermal shift factor defined by, for example, Schapery [2], which accounts for variations in temperature or humidity.
Related Work
My experimental approach to the relaxation problem was inspired by the work of Kunigal N. Shivakumar and John H. Crews, who performed empirical and finite-element studies as described above. The idea of using load-sensing bolts to measure clampup force was theirs; I adopted this technique and applied it to bevel-head bolt joints in glass-reinforced vinylester resin.
Other work upon which my research rests includes that of J. H. Stockdale and F. L. Matthews [6], who performed experimental studies that documented the effect of
bolt clampup force and washer fit on the protruding-head bolt-bearing strength of GRP.
Finally, I must give credit to F. L. Matthews for another endeavor. He served as the editor of a very informative collection of information on joints in composites, the book Joining Fibre-Reinforced Plastics. He also contributed an excellent chapter
[5] on theoretically-based analyses of mechanically-fastened joints. In this same
volume, L. J. Hart-Smith contributed a chapter [1], complementary to Matthews', on the empirical analysis and design of mechanically-fastened joints. Both of these chapters were very helpful during the development of my research program.
Chapter Two
Experimental Procedure
2.1 Experimental Materials
Overview
The materials used in each of the two types of experiment performed (clampup force relaxation and bearing strength) were selected based on several criteria. The first was the stipulation that the experimental set-ups must model, to the extent practicable, composite materials and composite-to-steel joint designs proposed for U.S. Navy shipboard use. These proposed materials and joint designs were suggested by my research sponsor, the Carderock Division of the Naval Surface Warfare Center (Code
66, Surface Ship Structures). Other materials selection criteria included easy
availability and low cost for steel panels and fastener components. Finally, special instrumented bolts were selected for their demonstrated precision in the measurement of bolt stresses.
Description of Materials
The composite laminate panels used in the experiments consisted of E-glass reinforcement in a vinylester resin matrix, and were manufactured by the Seeman
Composite Company of Gulfport, Mississippi. Each glass ply consisted of
Owens-Coming 24-weight woven roving in a balanced weave, with the filling oriented
-450, and 90* (warp orientation) layers, to a nominal thickness of 0.5 inches
requiring 20 plies. The final sequence was thus [(0/±4 5/90)5]r , resulting in a
"quasi-isotropic" laminate. The resin used was Dow Derakane 510A vinylester resin.
The laminate was formed by the Vacuum-Assisted Resin-Transfer Molding (VA/RTM) process. In this process, the glass plies are laid up dry in a mold. The resin is pumped into the mold until the plies are totally saturated and all air has been forced from the mold. The mold is then placed in a bag. A partial vacuum is applied to the inside of the bag, and the resin is allowed to cure at room temperature. The resulting laminate generally has a void content of less than 2%. Table 2-1 lists the
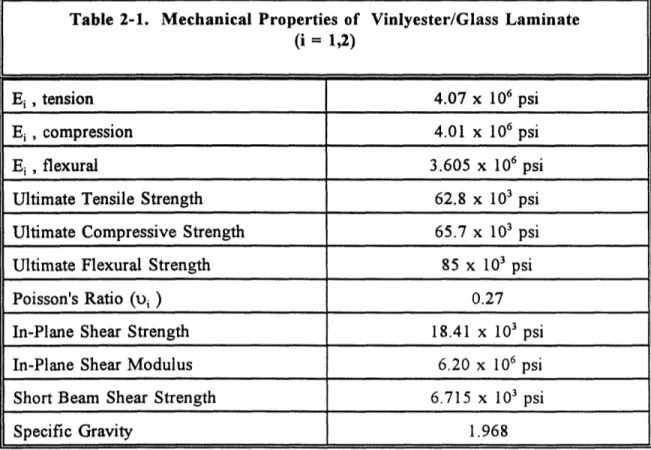
mechanical properties of this material , as provided by the manufacturer.
Table 2-1. Mechanical Properties of Vinlyester/Glass Laminate
(i = 1,2)
Ei , tension 4.07 x 10⁶ psi
E,, compression 4.01 x 10⁶ psi
Ei, flexural 3.605 x 10⁶ psi
Ultimate Tensile Strength 62.8 x 10³ psi
Ultimate Compressive Strength 65.7 x 10³ psi
Ultimate Flexural Strength 85 x 10' psi
Poisson's Ratio (ui ) 0.27
In-Plane Shear Strength 18.41 x 10³ psi
In-Plane Shear Modulus 6.20 x 10⁶ psi
Short Beam Shear Strength 6.715 x 10³ psi
The GRP material was supplied as two square panels, 24 inches by 24 inches each. For the clampup-force relaxation experiments, ten 6-inch by 6-inch (nominal) specimens were cut from the GRP laminate panels supplied by the manufacturer. A nominal 0.625-inch hole was drilled in the exact center of each of these specimens. Each hole was then countersunk to a nominal depth of 0.292 inches, using a six-fluted, carbide, 5/8-inch pilot, 820 countersink drill. (The actual depth was set by drilling a pilot hole, and noting the depth at which a standard, countersunk 5/8 -inch bolt head was flush with the surface.) For the bearing strength experiments, twenty 3-inch by
12-inch (nominal) specimens were cut from the supplied panels. A nominal 0.625-inch hole, countersunk as described above, was drilled in each of these specimens. The center of each of these holes was nominally four inches from one of the short
edges of the specimen, and centered with respect to the long edges of the specimen. The steel panels used in the experiments were of AISI Type 1018 cold-rolled steel, 0.375 inches thick. The panels used in the relaxation experiments and in four of the bearing strength experiments were supplied (by Matt McDonald Special Steels of Boston, Massachusetts) in long strips of either 3-inch or 6-inch width, and were cut and drilled to the same dimensions as the corresponding composite specimens, except that none of the holes in the steel were countersunk. Additionally, a nominal 0.5-inch hole was drilled in each bearing test steel specimen, 1.75 inches from the end opposite the 0.625 inch hole. Ten steel panels were prepared for the relaxation experiments; four panels were prepared for the bearing-strength experiments.
apparent that the bearing strength tests caused permanent distortion of the bolt hole in the steel panels. It was then necessary to obtain sixteen additional panels, identical to the initial four. These were prepared by the Grant Steel Company of Holbrook, Massachusetts, including the cutting and drilling. (Grant Steel was selected due to their overall lower price for the complete panel, including cutting to size and drilling.)
Two additional steel panels were prepared for the bearing strength experiments, as spacers to prevent bending. These were prepared from 0.375-inch Type 1018 cold rolled steel, and were each 3.5-inches by 3.0-inches, drilled with a 0.50-inch hole in the exact center. To pin these panels to the steel half of the joints, a 36-inch long
section of 0.50-inch steel drill rod was obtained, and cut to 1-inch lengths for use in the experiments.
The ten bolts used in the relaxation experiments were specially instrumented load-sensing bolts, prepared by the Strainsert Company of West Conshohocken,
Pennsylvania. These bolts were standard 5/8 - 11UNC x 2% hex-head cap screws,
SAE Grade 8, modified by the insertion of a full-bridge resistance-type strain gage
circuit (350 Ohms nominal resistance) into a small hole drilled through the head of the bolt along its axis. These bolts were calibrated at the factory, in both load directions, up to a load of 22,000 pounds.
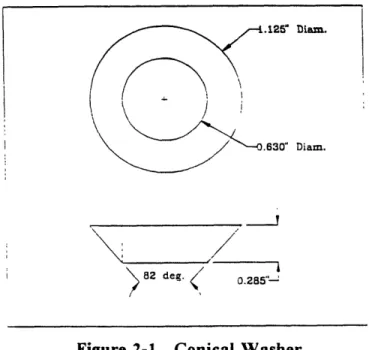
In order to simulate countersunk bolt heads in the relaxation experiments, special washers in the shape of a cone frustrum were machined, using steel rod stock. Each washer was 0.285 inches thick; the large diameter was 1.125 inches, and the small diameter was 0.630 inches. A 0.630-inch hole was bored along the axis of the
frustrum. These dimensions were selected to match the head dimensions of a standard flathead, countersunk 5/8-inch bolt as closely as possible; additionally, these
dimensions ensured that the washers would fit over any standard 5/8 inch bolt. Figure 2-1 is a drawing of one of these washers.
Diam.
82 deg. 0.285"-,
Figure 2-1. Conical Washer
Two types of bolts were used in the bearing strength experiments: standard 5/8 - 11UNC x 2 hexagon-socket flat countersunk head cap screws, alloy steel
(minimum yield strength 120,000 psi, equivalent to SAE Grade 8); and standard
hex-head cap screws, 5/8 - I1UNC x 2-3/4, SAE Grade 8. Flat washers used in both types
of experiment were standard Type A Plain 5/8 W washers, SAE Grade 8. Nuts used
in both types of experiment were standard 5/8 - 11UNC hex nuts, SAE Grade 8. All
of these items except the hex-head cap screws were obtained from the McMaster-Carr Company of New Brunswick, New Jersey; the hex-head cap screws were obtained
from the Allied Bolt and Screw Company of Boston, Massachusetts.
2.2 Experimental Set-Ups
Relaxation Experimental Set-Up
The purpose of the relaxation experiments was to measure the clampup force relaxation in a countersunk bolted joint, in which a composite laminate was bolted to a
steel panel. In order to measure the force in the bolts, specially instrumented bolts as described above were used. To facilitate testing with only one metering system, a pair of terminal boards was constructed, each capable of holding enough terminals for five bolts. Each board consisted of a nominally 7-inch by 7-inch, 1/4-inch thick Masonite
panel, drilled to accept twenty binding-post type banana jacks. The jacks were arranged in five rows of four; each row of four contained two jacks for the gage excitation voltage and two for the gage signal voltage. Each terminal pair was spaced at 3/4 inches, to permit the use of a standard double banana plug. The four leads from each bolt were soldered in turn to the jacks in a single row. The finished boards allowed the quick change of electrical connections.
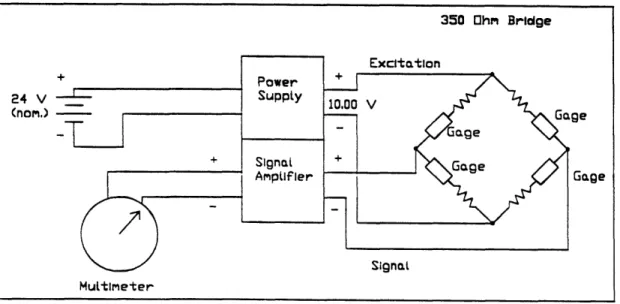
To provide a stable excitation voltage, and to amplify the relatively weak bridge signal, an Amot Controls Model 8351/B2111 pressure transducer amplifier was used. This device combines a power supply and signal amplifier in a very compact package. The power source was a pair of Yuasa 12-volt rechargeable batteries wired in series, producing a nominal voltage of 24 volts DC. The amplifier converted this
voltage to 10.00 volts DC, which was used to excite the bridge. The returning signal was amplified with a gain of 250, and measured with a Fluke model 77 multimeter. Figure 2-2 is a notional diagram of the testing circuit.
Figure 2-2. Relaxation Experiment Notional Strain Gage Circuit Diagram
In each experiment, a nominally 0.5-inch thick, 6-inch by 6-inch composite laminate specimen was bolted to a nominally 0.375-inch thick, 6-inch by 6-inch steel panel. The thicknesses were chosen based on proposed shipboard panel thickness; the length and width were made sufficiently long to avoid edge effects in the vicinity of the bolt-hole. Shivakumar and Crews have shown that stresses in composite laminates due to bolt clampup loads become negligible approximately three hole diameters away from the hole [2]. This would require an edge length of 3.75 inches for a 5/8 inch hole. Because Shivakumar and Crews studied carbon-fiber reinforced laminates bolted
350 Ohrm Bridge 24 V (nomr.) Gage Multimeter ge
with standard hex-head bolts, while the present study concerns glass-reinforced laminates bolted with countersunk bolts, the edge length was set at 6 inches for conservatism.
After alignment of the laminate and steel panels, the ten instrumented bolts were assembled with one conical washer each, such that the large diameter of the washer was flush with the underside of the head of the bolt. The bolts were inserted in the boltholes, starting at the countersunk side of the laminate, and continuing through the steel panel until the conical washers were snug in the countersunk holes. In order to prevent bottoming of the nuts at the end of the threads, five of the flat washers were placed over the protruding end of each bolt. The threads were lubricated
using LPS® Force 84 2oTM dry moly lubricant, in an effort to improve the correlation
between bolt force and torque as recommended by, for example, Shigley and Mitchell [8]. Finally, a hex nut was threaded onto the bolt, and made up finger-tight.
At this point, there were ten identical bolted joint samples, each as illustrated
in Figure 2-3 . These were divided into two groups of five. The first group was
torqued to 60 ft-lbs; the second was torqued to 35 ft-lbs.
The initial tensile force in each bolt was measured, as well as the time of the
measurement. Because the bolts were calibrated at 700F, the samples were left in the
ambient air (i.e., no temperature control was used). The ambient temperature was recorded during each round of measurements. Clampup force measurements were taken once every eight hours after the initial assembly of the joints, for six days.
-.
o"
1
GRP
I
S eel
C ,onical Washer s, Wide (5 req'd) KX 11UNC)Figure 2-3. Relaxation Experiments Joint Specimen Configuration
Bearing Strength Experimental Set-Up
The purpose of the bearing strength experiments was to determine the effect of clampup-force relaxation on the bolt-bearing strength of the composite laminate, when
bolted with countersunk bolts. Because of the head configuration of these bolts, a single-lap joint is the most likely joint design; thus, single-lap joints were tested. Since bearing strength tests generally destroy bolts, and clampup force is difficult to measure directly without expensive instrumented bolts, bolt torque was used as the
measure of clampup force in these experiments. Thus, torque was varied as the independent variable, and bearing strength was measured as the dependent variable.
In order to measure the bearing strength, an MTS 100,000 pound capacity
testing machine with hydraulic grips was used. The hydraulic grips, which were 3.5
inches wide, were set to grip the specimens at a pressure of 1000 psi . The load range
L
0.375
-Instrumented Bolt
was limited to 50,000 lbs, and the extension rate was set at a constant 950 seconds per half-inch of displacement. A plot of load versus displacement was generated by a graphic plotter.
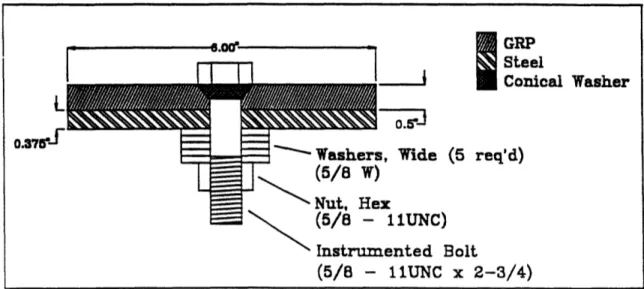
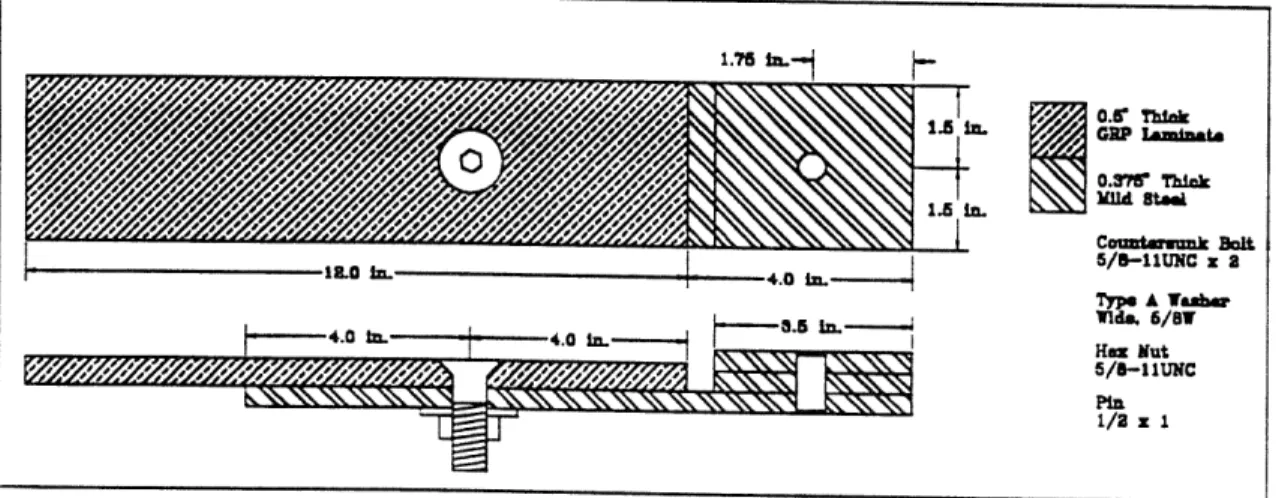
Single-lap joint specimens were prepared by overlapping one twelve-inch long steel panel with one twelve-inch long composite laminate panel, and bolting the composite to the steel using one of the countersunk, flathead bolts. A single flat washer was placed over the protruding end, and the threads were lubricated with the dry moly lubricant. A nut was then threaded on and made up finger-tight. Sixteen such specimens, all identical, were prepared; the configuration of each was as illustrated in Figure 2-4.
Figure 2-4. Bearing Strength Experiments Joint Specimen Configuration
O.Ir Tlnta GRP lamin&ta 0.371 Thick lMld Stael Count-ronmk Bolt 5/,-11UNC x 2 ype A Wabser Vide. 6/8W Hez Nut 5/-i11IUNC Pin i/2 x 1 __ __ ~ _ __ ___
The twelve specimens were divided randomly into four groups of four each.
The first group was to be torqued to 50 ft-lb, the second to 33 ft-lb, the third to
17 ft-lb, and the last group to 0 ft-lb. (The last group was tightened finger tight, using a wrench to hold the bolt stationary.) The actual torquing of the bolts was performed just prior to each test, such that no stress relaxation would occur in the joint prior to the test.
In order to establish a baseline against which the performance of countersunk bolts could be measured, four single-lap joints with standard hex-head bolts were assembled. These were similar to the countersunk bolt joints, except that a washer was placed under the head of each hex-head bolt, and two washers were used under the nut to prevent bottoming out of the threads. One of these joints was torqued to 50 ft-lbs, one to 33 ft-lbs, one to 17 ft-lbs, and one to 0 ft-lbs (finger-tight).
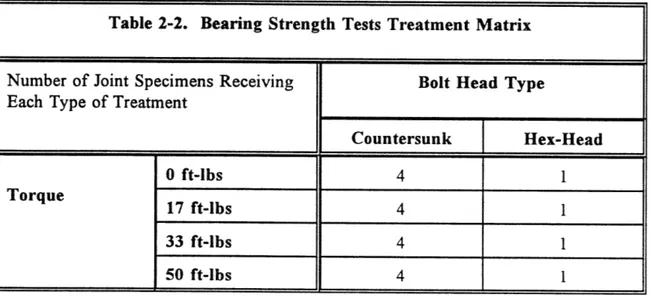
Table 2-2 shows the number of specimens receiving each type of treatment.
Table 2-2. Bearing Strength Tests Treatment Matrix
Number of Joint Specimens Receiving Bolt Head Type
Each Type of Treatment
Countersunk Hex-Head
0 ft-lbs 4 1
Torque 17 ft-lbs 4 1
33 ft-lbs 4 1
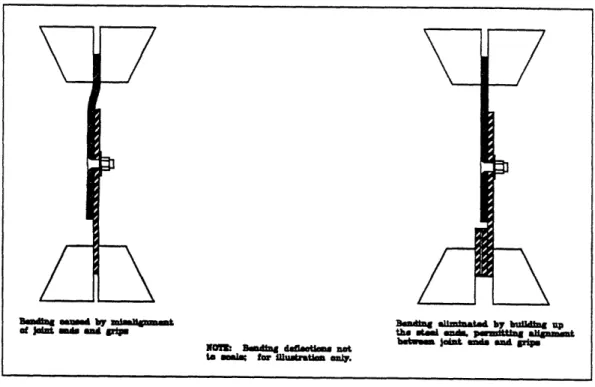
To eliminate bending to the maximum extent practical, the end of each steel panel away from the joint was pinned to the two 3.0 x 3.5 inch steel panels, resulting in a thickness of 0.75 inches. The effect of this was to better align the centers of the ends of the joint specimens, so that when the specimens were placed in the testing machine, the closing of the grips on the specimen ends did not cause excessive
specimen bending. Figure 2-5 illustrates this bending effect, and how the building up of the steel panel virtually eliminates it.
*Oa kala by amlnvou not to asL•a for muarstoa oaly.
C
dug• amated by buUid up
tI ma e 16n. p-mt.ag
bhatwm •ut om and rpio
Figure 2-5. Testing Configuration to Minimize Initial Bending
At the start of each test, a joint specimen was placed between the grips on the testing machine. The sample axis was aligned as best as possible with the load axis of
the machine, and the grips were closed on the specimen. The joint specimen was then loaded in tension, and the load was increased until bearing failure of the composite. The load at which failure occurred was recorded, as well as a graph of load versus displacement. This was repeated until all twenty joint specimens had been tested.
Chapter Three
Experimental Results and Discussion
3.1 Results of the Relaxation Experiments
The data collected in the relaxation experiments consisted of output voltages
from the instrumented bolt strain gage circuits, measured at nominal 8-hour intervals after the initial torquing of the ten specimen joints. These voltages were converted to bolt clampup force by the following equation:
F C (3.1)
G
VE
where: F is bolt clampup force (pounds);
Vo is measured output voltage (volts) from the signal amplifier; G is the signal amplifier gain (volts per millivolt);
VE is the bridge excitation voltage (volts); and
C is the slope of the strain gage calibration curve (pounds per millivolt
per volt).
Individual strain gage calibration data, for each bolt at an ambient temperature of 70°F, were provided by the manufacturer of the instrumented bolts. These data are provided in Appendix A.
The measured output voltages and corresponding clampup forces, as well as
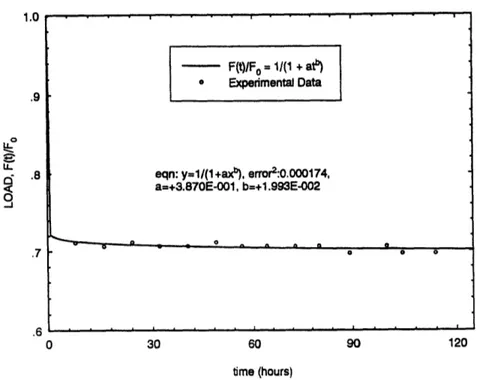
force relaxation graphs for each specimen, are provided in Appendix B. Figure 3-1 is
an initial torque of 60 ft-lbs. Figure 3-2 is a relaxation curve for specimen R-6, which is representative of the behavior of specimens R-6 through R-9, each of which was torqued to an initial torque of 35 ft-lbs. Finally, Figure 3-3 is a plot of the relaxation
behavior of specimen R-10, which was torqued to an initial torque of 35 ft-lbs. This
curve is provided separately because of the significantly different behavior of
specimen R-10 when compared to the other specimens.
1.u .9 o IL U-v O. .8 7 0 30 60 90 120 time (hours)
Figure 3-1. Relaxation Behavior, Specimens with 60 ft-lbs Initial Torque F(t)/Fo = 1/(1 + atb )
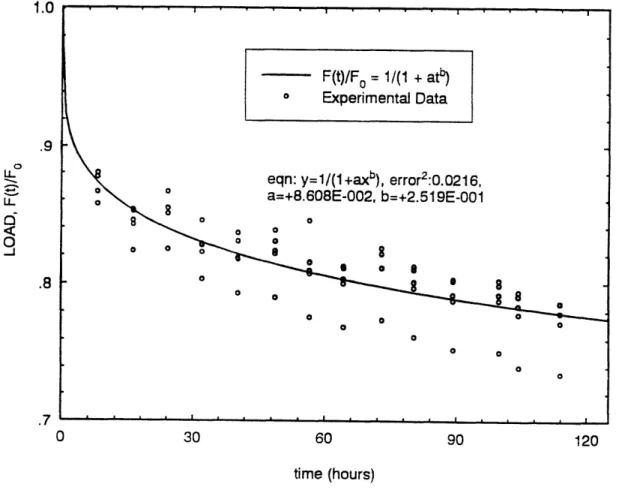
Experimental Data
eqn: y=l/(1+axb), error2:0.0216,
o a=+8.608E-002, b=+2.519E-001 8 •
8
8o
0
0
o 0 o0 0 0 . . . . .I . . I . . .time (hours)
Figure 3-2. Sample R-6 Relaxation Behavior (35 ft-lbs Initial Torque Specimen)
- F(t)/Fo= 1/(1 + at ) . , Experimental Data o 0 a o o n a o oa
eqn: y=1/(1+axb), error2:0.000372, a=+4.245E-002, b=+2.260E-001
time (hours)
Figure 3-3. Relaxation Behavior of Specimen R-10
." I
F(t)/Fo= 1/(1 + atb)
* Experimental Data
eqn: y=1/(1 +ax). error2:0.000174,
a=+3.870E-001, b=+1.993E-002 0C p p 1.00 .95 .85 .80 ... · r.··~l~~·r'···" I · · · · --E
F
3.2 Results of the Bearing Strength Experiments
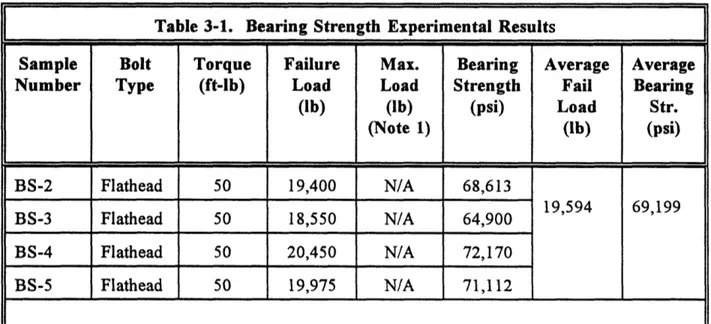
The data collected in the bearing strength experiments consisted of load-displacement curves generated by the testing machine (contained in Appendix C), videotapes of each test, and the failed physical specimens themselves. The load-displacement curves describe the behavior of the overall specimen/testing machine combination, and as such do not precisely describe the mechanical behavior of the GRP laminate. Nevertheless, these curves are useful indicators of the progression of events from initial load to failure, and were used to determine the onset of bearing failure in the samples. Table 3-1 summarizes the failure loads and maximum loads (where applicable) reached in each bearing strength experiment.
Table 3-1. Bearing Strength Experimental Results
Sample Bolt Torque Failure Max. Bearing Average Average
Number Type (ft-lb) Load Load Strength Fail Bearing
(lb) (lb) (psi) Load Str. (Note 1) (lb) (psi) BS-2 Flathead 50 19,400 N/A 68,613 BS-3 Flathead 50 18,550 N/A 64,900 19,594 69,199 BS-4 Flathead 50 20,450 N/A 72,170 BS-5 Flathead 50 19,975 N/A 71,112
BS-7 Flathead 33 18,400 N/A 63,619 BS-8 Flathead 33 19,750 N/A 69,098 19,350 68,037 BS-9 Flathead 33 19,875 19,875 69,006 BS-10 Flathead 33 19,750 19,750 70,425 BS-12 Flathead 17 19,075 19,075 67,317 BS-13 Flathead 17 18,350 19,800 64,759 18,694 65,632 BS-14 Flathead 17 17,000 19,500 59,253 BS-15 Flathead 17 20,350 20,350 71,198 BS-17 Flathead 0 17,500 18,700 63,004 BS-18 Flathead 0 17,350 19,100 61,638 17,481 62,041 BS-19 Flathead 0 15,825 19,250 55,730 BS-20 Flathead 0 19,250 19,625 67,791 BS-1 Hexhead 50 24,250 N/A 84,934 N/A N/A
BS-6 Hexhead 33 23,125 N/A 81,795 (due to (due to
(due to
(due to
BS-11 Hexhead 17 22,100 N/A 78,988 variable variable
BS-16 Hexhead 0 22,075 N/A 77,191 torque) torque
(1) Maximum loads are only provided for those samples which were allowed to
fail catastrophically subsequent to bearing failure.
An Analysis of Variance (ANOVA) table listing the results of an analysis of the effect of torque on bearing strength is presented as Table 3-2.
In order to conclude from Table 3-2 that bolt torque has any effect on bolt bearing strength in countersunk bolt joints of the type tested, the F-ratio from the data must exceed F (a; k-I; N-k) = F (a; 3; 12). At a reasonable tail probability (a) of
0.5, however, F (0.05; 3; 12) = 3.49 [9]. Thus, the data do not support the conclusion that torque has any effect on bearing strength.
Examination of the data, however, suggests that there is probably a positive
correlation between torque and bearing strength . (Verification of this hypothesis would
require that the experiments be repeated withn a sample size of at least 45.) A graph of the bearing strength data is provided as Figure 3-4.
Table 3-2. ANOVA Table for Torque Effect on Bearing Strength
Variance Sum of Degrees of Mean F ratio Probability
Source Squares Freedom Square
Torque 119,945,639 3 39,981,880 2.31 0.1283
Error 207,851,506 12 17,320,959
8xo104 6x10⁴ 2-C 4xlo1 CD cu 2x10⁴ 0 20 40 60 Toraue (ft-lbs)
Figure 3-4. Bearing Strength of Countersunk Bolt Joints, GRP/Steel
3.3 Discussion of Relaxation Experiment Results
Correlation of Initial Torque with Initial Clampup Force
Specimen Variation
The first observation that can be made concerning the relaxation behavior data is that there is much variation in the observed initial clampup force produced by identical levels of initial torque in countersunk, bolted joints between vinylester/glass laminates and steel (henceforth termed "subject joints"). This is illustrated in Table
Table 3-3 shows a general positive correlation between initial torque and initial clampup force, but the variation in clampup force at each torque level is very large. At 60 ft-lbs of torque, the clampup force ranges from 925 lbs to 2028 lbs, or by a factor of 2.19. At 35 ft-lbs of torque the variation is even more extreme, with clampup force ranging from 244 lbs to 2016 lbs, a factor of 8.26.
Shigley and Mitchell [8] suggest the following equation for correlation of torque and clampup force in protruding-head bolted joints in metal:
T
=
kTFd
where:(3.2)
T is torque;
F is clampup force;
Table 3-3. Initial Clampup Force in Relaxation Experiments
Specimen Initial Torque Initial Clampup Force
(ft-lbs)
(lbs)
R-1 60 1474 R-2 60 925 R-3 60 1257 R-4 60 2028 R-5 60 1316 R-6 35 343 R-7 35 369 R-8 35 244 R-9 35 400 R-10 35 2016d is the bolt diameter; and
kT = dm tan + p sec + 0.6251.c
T 2d 1 - I tanX seca
(3.3)
BI is the coefficient of sliding friction between the nut and the bolt;
ý1t is the coefficient of sliding friction between the nut and the washer;
cX, X, d, and dm are bolt thread geometrical parameters as defined in
Figure 3-5.
2ax
Figure 3-5. Bolt Thread Geometrical Parameters
There are many joint parameters that influence the correlation between torque and clampup force, as illustrated by the relative complexity of equation (3.3). A change in geometry from protruding-head bolt to countersunk bolt requires the consideration of additional parameters (e.g., the coefficient of friction between the where :
inclined portion of the bolt head and the panel, and the precision of the fit between the bolt head and the countersunk hole). If one or both of the panels being bolted are
anisotropic, heterogeneous, and viscoelastic (e.g., GRP), there are yet more issues to consider. Finally, the normal dimensional variation in the bolt and the hole will have an effect on clampup force.
It is well-known that lubrication of the threads prior to joint assembly improves the torque-clampup force correlation by making the nut-bolt friction coefficients more uniform [8]. For this reason, all bolt threads in the relaxation and bearing strength experiments were lubricated. However, as illustrated in Table 3-3, there was still a wide variation in clampup force in countersunk bolt joints in GRP/steel, for a given amount of initial torque. The possible reasons for an individual observation of low clampup force for a given torque level include the following:
a. Relative poor mating of the nut threads to the bolt threads. In a joint with this
phenomenon, a relatively large fraction of the total torque is used merely to rotate the nut ("running torque"); this torque is then unavailable for elastically lengthening the bolt and producing clampup force.
b. Relatively poor fit between the bolt head and the countersunk hole. Ideally, the
clampup load is carried uniformly by the entire area of the countersunk hole. If the bolt head fit is poor, this load will be carried by local "high spots" on the hole surface, producing locally high stresses and local deformation. This
relax the load.
c. Location of the bolt hole at a locally "soft" area of the GRP panel. Because of
the nature of GRP, there are always areas in the panel where imperfections (low fiber density, voids, inclusions, etc.) reduce the through-thickness stiffness of the panel. If the material near the bolt hole edges contain such
imperfections, there will be more deflection of the GRP under the clampup
load, which will permit bolt shortening and load relaxation.
d. A relatively large diameter of the non-countersunk portion of the bolt hole,
relative to the bolt major diameter, d. Empty space between the bolt and bolt hole allows flow of the panel material towards the bolt, and thus more local panel deformation than in a joint in which the bolt fits snugly in the hole. This additional deformation allows bolt shortening and load relaxation.
Similarly, if the above conditions are favorable, the initial clampup force produced by a certain level of torque would be increased.
Variation Due to Measurement Technique
The final sources of clampup force variation were the inevitable measurement errors. Each relaxation experiment relied on a Wheatstone bridge circuit containing four strain gages and at least four resistors, a combination power supply/signal amplifier, and a digital multimeter. Due to the generally high reliability of electrical components, outright malfunctions would have been easy to detect.
non-linearities in the signal amplifier, which would increase as the input signal approaches zero. Because the bridge circuits had very low impedances and the clampup force in the subject joints remained relatively low even with 60 foot-pounds of torque
(compared with, say, steel), the output signals from the bridge circuits never exceeded four millivolts. This is at the low end of the linear range of the amplifier, which was designed for an input voltage range of 4 to 20 millivolts.
Another source of measurement errors was the relatively low signal-to-noise ratio associated with such a small signal.
Other error was associated with temperature fluctuations; it was noted that the voltages recorded in the afternoon frequently exceeded the readings from the same morning. This is believed to have been caused by resistance changes in the strain gages, as the ambient temperature rose over the course of the day.
These measurement errors would not, of course, result in an eightfold increase of measured voltage; additionally, the data were relatively well-behaved, with the readings decreasing in an orderly and predictable fashion. Thus, it is concluded that variation in the specimens themselves was the major source of clampup force variation at a certain torque level, and that the correlation between torque and clampup force in the subject joints is widely variable even for nominally identical specimens. In fact, an analysis of variance does not support the conclusion that clampup force is a
Clampup Force Relaxation Behavior
Examination of the clampup force relaxation data for all ten specimens indicates that relaxation in countersunk bolted joints between vinylester/glass GRP laminates and steel can be described by an equation of the form proposed by Shivakumar and Crews [2] for describing relaxation in conventional bolt joints in carbon/epoxy laminates, namely:
F(t)_
1
F 1 t n (3.4)
1 + F,( )
aT/where the terms are defined as in Chapter One. If temperature and humidity are not
varied, as in the present study, equation (2) can be simplified to:
F(t) 1 (3.5)
Fo 1 + kt"
where the constant k is defined as:
F,
k- (3.6)
aTH
Equation (3.5) relaxation constants for each specimen, as well as overall relaxation constants based on specimens R-1 through R-5, are listed in Table 3-4.
Differences in Relaxation Behavior Among the Specimens
Table 3-4 and the relaxation graphs in Appendix B reveal a marked difference in relaxation behavior between the joints with 60 ft-lbs of initial torque, and joints R-6 through R-9 with 35 ft-lbs of initial torque. The reason for this difference is the variation in initial clampup force among the ten specimens.
Specimens R-1 through R-5 were each torqued to 60 ft-lbs at the start of the experiment. As discussed earlier, the observed clampup forces varied widely, but the force in each of these five specimens was at least 925 lbs. Specimen R-10, while only torqued to 35 ft-lbs, nevertheless reached an initial clampup force of 2016 lbs. In all six of these specimens, the initial clampup force was high enough to preclude
Table 3-4. Experimentally-Determined Relaxation Equation Constants
Specimen/Initial Torque
n (dimensionless)
k (hours
-")
R-1 / 60 ft-lbs 0.2450 0.08663 R-2 / 60 ft-lbs 0.2733 0.07059 R-3 / 60 ft-lbs 0.2580 0.08355 R-4 / 60 ft-lbs 0.2314 0.08718 R-5 / 60 ft-lbs 0.2816 0.09200 R-6 / 35 ft-lbs 0.01993 0.3870 R-7 / 35 ft-lbs 0.01409 0.4767 R-8 / 35 ft-lbs 0.1441 0.01261 R-9 / 35 ft-lbs 0.04683 0.5479 R-10 / 35 ft-lbs 0.2260 0.04245 Overall (R-1 thru R-5) 0.2519 0.08608
relaxation to a level insufficient to cause further relaxation ( designated as "effective
zero") during the duration of the experiments (six days).
Specimens R-6 through R-9 were each torqued to 35 ft-lbs. Each of these specimens reached relatively low levels of initial clampup force; the highest was R-9 at 400 lbs. Shivakumar and Crews [2] describe an initial clampup force relaxation effect due to joint settlement, etc., that is observed even in metal-to-metal joints. It is the opinion of the author that the majority of the clampup force relaxation
observed in specimens R-6 through R-9, almost all of which occurred in the first eight hours of the experiment, was due to this initial settling effect.
The limiting value of clampup force reached in these specimens, approximately 240 lbs, corresponds to a output voltage reading of approximately 0.100 volts.
Disassembly of specimens R-6, R-7, and R-9 indicated that there is a residual output voltage of approximately 0.096 volts (0.0384 mVN bridge output) remaining after complete unloading of the bolt. The output voltage associated with the limiting value of clampup force is only 4 millivolts above the residual voltage; this represents a bridge output signal of 0.0016 mvN, which is comparable to the noise level in the system.
The differences in clampup relaxation between samples R-6 through R-9 and the remaining specimens are thus explainable by the low initial clampup force in the four indicated specimens, which quickly relaxed to an effective zero value, beyond which no relaxation occurred.
Subject Joint Relaxation Behavior Compared With Hex-Head. Carbon/Epoxy Results
Table 3-5 compares the relaxation behavior of the subject joints with the
relaxation behavior of protruding head bolt double-lap joints in carbon fiber/epoxy laminates, as reported by Shivakumar and Crews [2].
The data indicate that clampup force in the protruding-head bolt joints in carbon/epoxy relax more slowly than the subject joints. This difference is explainable by:
Material Yroperties; and Joint Configuration.
Differences in the mechanical properties of the two types of laminates
compared in Table 3-5 undoubtedly account for a portion of the relaxation behavior
differences. However, without viscoelastic property data for the vinylester/glass panels
Table 3-5. Relaxation Behavior in Bolted Joints
Time (hours) Clampup Force, Clampup Force,
Countersunk Bolt, Protruding-Head Bolt, Glass/Vinylester (F(t)/F0) Carbon/Epoxy (F(t)/F0)
0 1.00 1.00
10 0.87 0.93
used in the present experiments, this effect cannot be quantified.
The difference in joint configuration is likely the major reason for the observed
relaxation behavior difference. Figure 3-6 illustrates the two types of joint
configuration.
Possible No constraint
Deformation at surface constraint
Countersunk Bolt Joint Protruding Head Bolt Joint
Figure 3-6. Bolted Joint Configurations
As illustrated in Figure 3-6, the protruding-head bolt joint allows the use of washers on both sides of the joint. The washers provide constraints on the creep behavior of the panels. Because of this, the only allowable deformations of the panel in the vicinity of the bolt hole are compression (volume reduction) through the joint