Publisher’s version / Version de l'éditeur:
Inorganic Chemistry, 41, 26, pp. 7064-7071, 2002-11-26
READ THESE TERMS AND CONDITIONS CAREFULLY BEFORE USING THIS WEBSITE. https://nrc-publications.canada.ca/eng/copyright
Vous avez des questions? Nous pouvons vous aider. Pour communiquer directement avec un auteur, consultez la première page de la revue dans laquelle son article a été publié afin de trouver ses coordonnées. Si vous n’arrivez pas à les repérer, communiquez avec nous à [email protected].
Questions? Contact the NRC Publications Archive team at
[email protected]. If you wish to email the authors directly, please see the first page of the publication for their contact information.
NRC Publications Archive
Archives des publications du CNRC
This publication could be one of several versions: author’s original, accepted manuscript or the publisher’s version. / La version de cette publication peut être l’une des suivantes : la version prépublication de l’auteur, la version acceptée du manuscrit ou la version de l’éditeur.
For the publisher’s version, please access the DOI link below./ Pour consulter la version de l’éditeur, utilisez le lien DOI ci-dessous.
https://doi.org/10.1021/ic0203771
Access and use of this website and the material on it are subject to the Terms and Conditions set forth at
Structure and dynamics of ND
₃BF₃ in the solid and gas phases : a
combined NMR, neutron diffraction, and Ab initio study
Penner, Glenn H.; Ruscitti, Bruno; Reynolds, Julie; Swainson, Ian
https://publications-cnrc.canada.ca/fra/droits
L’accès à ce site Web et l’utilisation de son contenu sont assujettis aux conditions présentées dans le site LISEZ CES CONDITIONS ATTENTIVEMENT AVANT D’UTILISER CE SITE WEB.
NRC Publications Record / Notice d'Archives des publications de CNRC:
https://nrc-publications.canada.ca/eng/view/object/?id=3b866b1c-a42c-45a1-8e4f-e309cd7617fd https://publications-cnrc.canada.ca/fra/voir/objet/?id=3b866b1c-a42c-45a1-8e4f-e309cd7617fdStructure and Dynamics of ND
3BF
3in the Solid and Gas Phases: A
Combined NMR, Neutron Diffraction, and Ab Initio Study
Glenn H. Penner,*,†Bruno Ruscitti,†Julie Reynolds,†and Ian Swainson‡
Department of Chemistry, UniVersity of Guelph, Guelph, Canada N1G 2W1, and NRC Canada, Steacie Institute for Molecular Sciences, Neutron Program for Materials Research,
Chalk RiVer, Canada K0J 1J0
Received June 3, 2002
The decrease in DfA bond lengths, previously reported for some Lewis acid/base complexes, in going from the gas to the solid phases is investigated by obtaining an accurate crystal structure of solid ND3BF3 by powder
neutron diffraction. The B−N internuclear distance is 1.554(3) Å, 0.118 Å shorter than the most recent gas-phase microwave value and 0.121 Å shorter than the single molecule geometry optimized (1.672 Å, CISD/6-311++ G-(d,p)) bond length. The crystal structure also shows N−D‚‚‚F−B hydrogen bonds. The effects of this change in structure and of intermolecular hydrogen-bonding on nuclear magnetic shielding (i.e., chemical shifts) and the nuclear quadrupolar coupling constants (QCC) are investigated by ab initio molecular orbital and density functional theory calculations. These calculations show that the nitrogen (15N and14N) and boron (11B and 10B) chemical
shifts should be rather insensitive to changes in rBN and that the concomitant changes in molecular structure.
Calculations on hydrogen-bonded clusters, based on the crystal structure, indicate that H-bonding should also have very little effect on the chemical shifts. On the other hand, the 11B and 14N QCCs show large changes
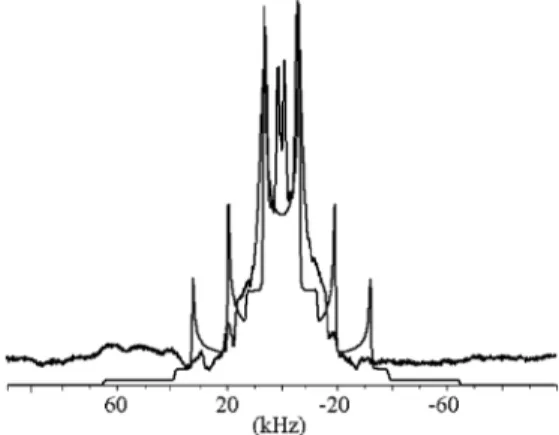
because of both effects. An analysis of the10B{19F}line shape in solid ND
310BF3yields a11B QCC of±0.130 MHz.
This is reasonably close an earlier value of±0.080 MHz and the value of±0.050 MHz calculated for a [NH3BF3]4
cluster. The gas-phase value is 1.20 MHz. Temperature-dependent deuterium T1measurements yield an activation
energy for rotation of the ND3group in solid ND3BF3of 9.5±0.1 kJ/mol. Simulations of the temperature-dependent
T1anisotropy gave an Eaof 9.5±0.2 kJ/mol and a preexponential factor, A, of 3.0±0.1×10¹²s-1. Our calculated
value for a [NH3BF3]4 cluster is 16.4 kJ/mol. Both are much higher than the previous value of 3.9 kJ/mol, from
solid-state proton T1measurements.
Introduction
The charge transfer, Lewis acid-base complex, NH3BF3,
was first prepared in the early 19th century1and has since
been synthesized by countless students in introductory inorganic laboratories.2 An early (1951) X-ray crystal
structure provides what could best be described as estimates of rBN (1.60 Å), rBF (1.38 Å), and θNBF (107°).3 A more
recent, and higher quality, structure of the methylene chloride solvated 18-crown-6 ether complex of NH3BF3 has been
reported.4 To date no high quality structure, including
accurate hydrogen positions, is available for solid NH3BF3.
Determination of the gas-phase structure of NH3BF3 by
rotational spectroscopy eluded researchers until the past decade.5This was due to the tendency of the vapor of the
solid adduct to form NH2dBF2. It is evident from the X-ray
and microwave structures that the BN bond length in NH3
-BF3is shorter in the solid state. This puts NH3BF3in a class
of donor-acceptor complexes in which the DfA bond length decreases significantly in going from the gas to the solid phases. Other examples where this bond length decrease is observed are as follows: NH3BH3,6N(CH3)3BF3,7NH3
-SO3,8N(CH3)3SO3,9N(CH3)3SO2,10CH3CNBF3,11and
HC-NBF3.12In the last case the decrease is particularly large at
0.835 Å!
* Author to whom correspondence should be addressed. E-mail: gpenner@ uoguelph.ca.
†University of Guelph.
‡Steacie Institute for Molecular Sciences.
(1) (a) Gay-Lussac, J. L.; The´nard, J. L. Mem. Phys. Chim. Soc. d’Arcueil
1809, 2, 210. (b) Davy, J. Philos. Trans. 1812, 102, 365.
(2) Marr, G.; Rockett, B. W. Practical Inorganic Chemistry; Van Nostrand Reinhold: London, 1972.
(3) Hoard, J. L.; Geller, S.; Cashin, W. M. Acta Crystallogr. 1951, 4, 396.
(4) Colquhoun, H. M.; Jones, G.; Maud, J. M.; Stoddart, J. F.; Williams, D. J. J. Chem. Soc., Chem. Commun. 1984, 63.
(5) Legon, A. C.; Warner, H. E. J. Chem. Soc., Chem. Commun. 1991, 1397.
Inorg. Chem. 2002, 41, 7064
−
7071
7064
Inorganic Chemistry, Vol. 41, No. 26, 2002 10.1021/ic0203771 CCC: $22.00 © 2002 American Chemical SocietyThere have been three recent ab initio calculations on NH3
-BF3. Fujiang et al. report an MP2/TZ2P geometry
optimiza-tion of NH3BF3and calculate the BN bond length dependence
of the energy, dipole moment, and electric field gradients at N and B.13 Jonas and Frenking give r
BN for optimized
geometries at various levels, including MP3/6-31(d,p) and QCISD/6-31G(d,p).14Jonas et al. have produced a
compre-hensive theoretical study of several Lewis acid-base com-plexes including NH3BF3. Aside from a geometry
optimi-zation of NH3BF3at several levels of theory, they showed
that rBNdecreases by about 0.05 Å upon dimerization.15
The dynamics of the NH3and BF3groups in solid NH3
-BF3have been investigated by variable temperature1H and 19F spin-lattice time (T
1) measurements.16This study yields
activation energies for rotation of the BF3and NH3groups
of 25.02 and 3.91 kJ/mol. This latter value seems unusually small considering the possibility of N-H‚‚‚F-B hydrogen-bonding. Turning to the gas phase, an A,E splitting in the rotational spectrum of about 60 kHz led Legon and Warner to estimate an internal rotational barrier, V3, of approximately
7 kJ/mol.5This is nearly twice the Ea found in the solid.
NMR parameters are known to be sensitive probes of molecular structure and dynamics. The isotropic11B and19F
chemical shifts of NH3BF3have been measured in solution.17
In addition, the11B nuclear quadrupolar coupling constant
has been reported for solid NH3BF3.18 The spectrum was
recorded at low field (1.41 T) in CW mode without 19F
decoupling. The rather poor quality spectrum gave an11B
QCC of 80 ( 8 kHz. This value is over an order of magnitude smaller than that measured in the gas phase (about 1.2 MHz, depending on the torsional state).5
The purpose of this study is to determine the molecular structure of solid NH3BF3 including accurate hydrogen
positions, to determine the activation parameters for ammonia group rotation in solid ND3BF3 by deuterium T1 and T1
anisotropy measurements, and to redetermine the boron
quadrupolar coupling constant in solid NH3BF3. We will also
employ ab initio molecular orbital and density functional theory (DFT) methods to calculate the barrier to rotation of the NH3group, the N and B nuclear quadrupolar coupling
constants, and the chemical shielding (i.e., shift) parameters. These will be compared to experimental values available in the gas and solid phases.
Theoretical Background
Deuterium Line Shapes.The solid-state deuterium NMR spectral line shape is dominated by the quadrupolar interac-tion. This is the interaction between the nuclear quadrupole moment, eQ, and the largest component of the electric field gradient (efg) tensor at the nucleus, eqzz. The quadrupolar
coupling constant, χ, which is a measure of the strength of the quadrupolar interaction, is given as
The line shape is also influenced by the asymmetry parameter of the efg tensor, η, which is defined as the difference between the two smaller principal components of the diagonalized efg tensor, eqxx and eqyy, with respect to the
largest component, eqzz
For the molecule studied here, the η values are very small (<0.1), and it will be assumed that the efg is axially symmetric along the N-D bond. In that case, the spectrum from a deuterium nucleus located in a static N-D bond consists of a doublet with spacing
where R is the angle between the X-D bond and the static magnetic field, B0. In powdered samples, the line shape is
determined by the random distribution of the X-D bond orientations with respect to B0, yielding a typical Pake
doublet with a characteristic splitting between peaks (R ) 90°) of 3χ/4 and shoulders (R ) 0°) separated by 3χ/2 (see Figure 4). The effects of motion on the deuterium powder spectrum are 2-fold. First the width of the spectral line is narrowed by the motion. In the case of a jumping motion of the X-D bond between three or more equally populated sites, as is expected for ND3and BD3groups, η is averaged
to zero and, if the motion is fast as compared to the quadrupolar interaction (i.e., >106 s-1), the quadrupolar
splitting, ∆ν, is reduced to
where θ is the angle between the X-D bond and the rotational axis. If the motional rate, k, is of the order of P (∼104-106s-1) the spectral line shape is severely distorted
because of the large T2 anisotropy associated with the (6) Klooster, W. T.; Koetzle, T. F.; Siegbahn, P. E. M.; Richardson, T.
B.; Crabtree, R. H. 1999, 121, 6337.
(7) (a) Geller, S.; Hoard, J. L. Acta Crystallogr. 1951, 4, 399. (b) Iijime, K.; Shibata, S. Bull. Chem. Soc. Jpn. 1979, 52, 711. (c) Cassoux, P.; Kuczowski, R. L.; Serafini, A. Inorg. Chem. 1977, 16, 3005. (8) (a) Bats, J. W.; Coppens, P.; Koetzle, T. F. Acta Crystallogr. 1977,
B33, 37. (b) Canagaratna, M.; Phillips, J. A.; Goodfriend, H.; Leopold, K. R. J. Am. Chem. Soc. 1996, 118, 5290.
(9) (a) Morris, A. J.; Kennard, C. H. L.; Hall, J. R.; Smith, G.; White, A. H. Acta Crystallogr. 1983, C39, 81. (b) Fiacco, D. L.; Leopold, K. R. Inorg. Chem. 2000, 39, 37.
(10) (a) Van Der Helm, D.; Childs, J. D.; Christian, S. D. J. Chem. Soc., Chem. Commun. 1969, 887. (b) Oh, J. J.; LaBarge, M. S.; Matos, J.; Kamp, J. W.; Hillig, K. W.; Kuczkowski, R. L. J. Am. Chem. Soc.
1991, 113, 4732.
(11) Swanson, B.; Shriver, D. F.; Ibers, J. A. Inorg. Chem. 1969, 8, 2182. (12) (a) Cabaleiro-Lago, E. M.; Rios, M. A. Chem. Phys. Lett. 1998, 294, 272. (b) Burns, W. A.; Leopold, K. R. J. Am. Chem. Soc. 1993, 115, 11622.
(13) Fujiang, D.; Fowler, P. W.; Legon, A. C. J. Chem. Soc., Chem. Commun. 1995, 113.
(14) Jonas, V.; Frenking, G. J. Chem. Soc., Chem. Commun. 1994, 1489. (15) Jonas, V.; Frenking, G.; Reetz, M. T. J. Am. Chem. Soc. 1994, 116,
8741.
(16) Yamauchi, J.; McDowell, C. A. J. Chem. Phys. 1981, 75, 577. (17) (a) Heitsch, C. W. Inorg. Chem. 1965, 4, 1019. (b) Dugan, C. H.;
Van Wazer, J. R. Compilation of19F NMR Chemical Shifts;
Wiley-Interscience: Toronto, 1970.
(18) Olliges, J.; Lo¨tz, A.; Voitla¨nder. J. Magn. Reson. 1986, 69, 302.
χ )e 2 qzzQ h (1) η )eqxx -eqyy eqzz (2) ∆ν )3e 2 qzzQ 4h (3 cos 2R -1) (3) ∆νeff)3χ 2 8 (3 cos 2 θ - 1) (4)
Structure and Dynamics of ND3BF3
dynamic process. The distorted line shapes can readily be simulated for a given combination of χ, θ, and k.
Deuterium Relaxation Times.The spin-lattice relaxation time, T1, characterizes the return of the bulk magnetization
to its equilibrium state after a perturbing pulse. Relaxation is stimulated by time-dependent nuclear spin interactions and is most efficient when these fluctuations occur at the resonance frequency of the nucleus. For deuterons, the primary source of these fluctuating fields is the time-dependent part of the quadrupolar interaction.
When the reorientational motion can be described by an exponential correlation function and the temperature depen-dence of the correlation time follows Arrhenius behavior, the rate of relaxation may be fit to the following equations:
where τcis the correlation time for the motion (τc∝k-1), τ∞
is its value at infinite temperature, and ω0 is the Larmor
precession frequency. In addition, Eais the activation energy
for the motion influencing T1, and K depends on the strength
of the dominant nuclear spin interaction (in this case χ2) and
the exact nature of the reorientational motion. For jumps of the X-D bond between three or more equivalent positions oriented at an angle θ about the rotational axis, K is given by
In this case, if a plot of ln(T1) versus inverse temperature
is made, one often sees a V-shaped curve, with a T1minimum
at τ0ωc)0.62. There is, in general, much information to be
extracted from this T1plot. The slope of the curve on either
side of the T1 minimum is characteristic of the activation
energy for the motion influencing T1. The intercept at 1/T
)0 yields a value for τ∞, while the depth of the minimum can be used to determine a value for the effective quadrupolar coupling constant. Note that knowledge of τ∞and Eaallows
calculation of the motional rate at any temperature through eq 6.
Boron-10Line Shapes. For the case where η ) 0 the10B line shape consists of three pairs of Pake doublets, for the 0T(1, (1T(2, and (2T(3 transitions (compare to the deuterium case that has only one, 0T(1, set of transitions, hence one doublet). A simulation of such a set of doublets is shown in Figure 11. The separation between the peaks or horns of the Pake doublets is χ/20, 3χ/20, and 5χ/20, respectively.
Experimental Section
Three different isotopomers were prepared for this study. Initially a sample of N2H
3BF3(hereafter referred to as ND3BF3) was used
for the deuterium line shape and T1work. Later a sample of N2H311
-BF3was required for the neutron diffraction structure determination.
To maximize the signal-to-noise ratio in the10B study, a sample of
ND310BF3was prepared. Deuterium was included in this sample to
reduce the10B-1H dipolar line broadening in the10B spectrum.
This allows us to perform a double resonance10B{19F}experiment
rather than the more demanding10B{1H,19F}experiment.
All three isotopomers were prepared by bubbling ammonia-d3
gas (MSD isotopes) through a solution of11BF
3or10BF3in ether
(Aldrich). The solid product simply precipitated out of solution, was filtered, and was washed with dry ether. The sample is stable in air, but the deuterium will eventually be replaced by hydrogen when exposed to moisture. The purity of the samples was checked by19F and11B (or10B) spectra of the solid dissolved in D
2O. Some
samples contained an impurity that was determined to be NH4BF4.
Structural data for ND311BF3were determined by powder neutron
diffraction measurements at 5 K. The powder samples were contained in vanadium tubes of 5 mm i.d. and wall thickness of 0.18 mm, which were filled with helium gas. The samples were rotated about one axis throughout data collection to improve averaging over crystallite orientations. The experiments were done on the C2 Dualspec high-resolution powder diffractometer at the NRU reactor at Chalk River, and data were collected from 5 to 120°with a step size of 0.025°. The monochromator was Si(531), and the takeoff angle was 2θ ) 92.7°. The neutron wavelength of 1.3284 Å was calibrated using a separate Si powder standard. The sample temperature was controlled by a commercially available open cycle design helium cryostat, with separate silicon diodes for the measurement and control of temperature. Structure refinement was carried out using the GSAS Rietveld refinement code.19
Deuterium spectra, obtained at 30.74 MHz on a Bruker ASX-200, of a 100 mg sample of solid ND3BF3employed a quadrupolar
echo pulse sequence.20The spectra were obtained at temperature
intervals of about 20 K from room temperature (291 K) down to 110 K. Deuterium spin-lattice relaxation times were measured at temperatures down to 110 K using an inversion-recovery quadru-polar echo pulse sequence. For each temperature 16 different variable delays were used. The T1 at each temperature was
determined using the TONE program. For all deuterium experiments a π/2 pulse of 2.6 µs, a pulse spacing of 40 µs, and a relaxation delay of at least 5T1were used. After each temperature change a
period of 15 min was allowed for the sample to reach thermal equilibrium. A Eurotherm B-VT2000 was used for temperature regulation, and the sample temperature was checked before each run by lowering a thermocouple down the bore of the magnet into the sample compartment.
Solid-state10B spectra were obtained on a Chemagnetics CMX
Infinity (B0 )4.7 T, ν0(10B) ) 21.5 MHz) NMR spectrometer.
Single pulse experiments were used with pulses of 2 µs (90°pulse was 5.5 µs). The spectra were acquired with 19F high power
decoupling.
Theoretical calculations were performed with Gaussian 98.21
Nuclear quadrupolar coupling constants were obtained from the calculated electric field gradients via the relationship χ ) -235Qqzz,
where χ is the QCC in kiloHertz, Q is the nuclear quadrupole moment in millibarns, and qzzis the largest calculated electric field
gradient at the nucleus of interest in atomic units. The Q values recently published by Pyykko were used.22The values used in this
study are as follows: Q(2H) ) 2.86, Q(11B) ) 40.59, Q(10B) )
84.59, and Q(14N) ) 20.1.
(19) Larson, A. C.; Von Dreele, R. B. Report No. LA-UR-86-748; Los Alamos National Laboratory: Los Alamos, 1987.
(20) Davis, J. H.; Jeffrey, K. R.; Bloom, M.; Valic, M. I.; Higgs, T. P. Chem. Phys. Lett. 1976, 42, 390.
1 T1 )K
(
τc 1 + ω02τc2 + 4τc 1 + 4ω02τc2)
(5) τc)τ∞exp(
Ea RT)
(6) K )9π 2 χ2 20 (3 cos 2 θ - 1) (7) Penner et al.The deuterium line shapes and T1anisotropies were simulated
with the program MXET1.23The10B spectrum was simulated with
the WSOLIDS software.24 Results and Discussion
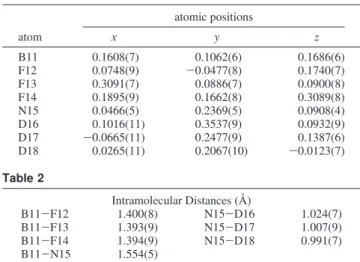
Neutron Diffraction Structure of ND3BF3.The analysis of the neutron diffraction pattern was accomplished by starting with the published X-ray structure and refining the structural parameters, including the deuterium positions. The results of the refinement of the structure of solid ND3BF3
are summarized in Tables 1-6. Figure 1 shows the observed and calculated powder patterns. The unit cell, which contains eight molecules, is depicted in Figure 2. The crystal structure indicates that each fluorine atom on one molecule is hydrogen-bonded to one deuterium atom from each of three neighboring molecules, thus forming an infinite network of hydrogen bonds throughout the crystal lattice. This arrange-ment is shown in Figure 3a. Similarly, each deuteron of a ND3BF3molecule is hydrogen-bonded to one fluorine from
each neighboring molecule. This arrangement is shown in Figure 3B. Table 7 compares our neutron diffraction analysis to the earlier results of Geller et al.3 The most important
difference is that the neutron diffraction analysis yields a B-N bond that is shorter by 0.046 Å.
Deuterium NMR Spectra andT1.The2H line shape of solid ND3BF3 does not change in the temperature region
between 300 and 110 K. This spectral line shape (see Figure 4 for an example) is consistent with a ND3 group rapidly
rotating at a rate, k, greater than 108s-1. If one assumes a
rapid interchange between the three N-D deuterons and uses the neutron diffraction structure, eq 4 yields a χ(2H) of 184
kHz for the nonexchanging deuterons. Values for other ND3
donor-acceptor complexes are 198 ( 5 kHz for ND3BH325
and 162 ( 5 kHz for ND3SO3.26 The deuterium QCC is a
local property and is relatively independent of the acceptor group. On the other hand, it is rather sensitive to N-D‚‚‚ X-A interactions. For example, gas-phase rotational spectra and molecular orbital calculations show that χ(2H) for
isolated NH3 is 290.6 kHz, whereas solid-state NMR
experiments yield a χ(2H) value of 156 kHz.27Similarly, our
calculations of χ(2H) for single molecules of NH
3BF3give
values of 252 (B3LYP/6-311++G**) and 255 kHz (MP2/ 6-311++G**). Evidently there is a significant intermolecular N-H‚‚‚F-B interaction, as implied by the neutron diffrac-tion structure, which lowers the deuterium QCC. Details of the calculations of hydrogen-bonding effects on χ(2H) in ND3
-BF3will be presented later (vide infra).
A plot of the deuterium T1 as a function of sample
temperature is shown in Figure 5. A low-temperature T1
minimum could not be reached with our apparatus. This is consistent with the ND3rotational rate being in excess of
108s-1at temperatures above 110 K. The slope of the ln T 1
versus 1/T plot gave an activation energy of 9.1 ( 0.1 kJ/ mol. Since the T1minimum could not be reached, it was not
possible to determine the temperature-dependent rates for ND3rotation. In this case the alternative is to measure the
T1anisotropy.28For a three-site exchange the anisotropy in
the rate of relaxation of the powder line shape is dependent on the exchange rate. The inversion recovery deuterium spectra for one temperature are shown in Figure 6. As can be seen, the shoulders of the spectral line shape relax faster than the peaks. A plot of ln k versus 1/T is shown in Figure 7. A linear regression yields Ea)9.5 ( 0.2 kJ/mol and a
preexponential factor, A, of 3.0 ( 0.1 × 10¹²s-1for rotation
of the ND3group. Earlier proton T1measurements provide
Ea and A values of 3.91 kJ/mol and 8.99 × 10¹⁰ s-1,
respectively.16Although our results are not consistent with
these numbers, there is agreement in Ea between our
independent T1and T1anisotropy measurements. The
pre-exponential factor, A, also known as the frequency factor or attempt frequency, is often identified with the torsional frequency for that motion. The attempt frequency for rotational motion of the ND3group, A, is in good agreement
with the torsional frequency, ν6, of 5.7 × 10¹²s-1obtained
from the far-infrared spectrum of solid ND3BF3.29
Barrier to Internal Rotation. The gas-phase barrier to internal rotation in NH3BF3has been estimated to be 7 kJ/
mol.5Fluorine-19 and proton T
1measurements yield barriers (21) Frisch, M. J.; Trucks, G. W.; Schlegel, H. B.; Scuseria, G. E.; Robb,
M. A.; Cheeseman, J. R.; Zakrzewski, V. G.; Montgomery, J. A., Jr.; Stratmann, R. E.; Burant, J. C.; Dapprich, S.; Millam, J. M.; Daniels, A. D.; Kudin, K. N.; Strain, M. C.; Farkas, O.; Tomasi, J.; Barone, V.; Cossi, M.; Cammi, R.; Mennucci, B.; Pomelli, C.; Adamo, C.; Clifford, S.; Ochterski, J.; Petersson, G. A.; Ayala, P. Y.; Cui, Q.; Morokuma, K.; Malick, D. K.; Rabuck, A. D.; Raghavachari, K.; Foresman, J. B.; Cioslowski, J.; Ortiz, J. V.; Stefanov, B. B.; Liu, G.; Liashenko, A.; Piskorz, P.; Komaromi, I.; Gomperts, R.; Martin, R. L.; Fox, D. J.; Keith, T.; Al-Laham, M. A.; Peng, C. Y.; Nanayakkara, A.; Gonzalez, C.; Challacombe, M.; Gill, P. M. W.; Johnson, B. G.; Chen, W.; Wong, M. W.; Andres, J. L.; Head-Gordon, M.; Replogle, E. S.; Pople, J. A. Gaussian 98, revision A.3; Gaussian, Inc.: Pittsburgh, PA, 1998.
(22) Pyykko, P. Mol. Phys. 2001, 99, 1617.
(23) Greenfield, M. S.; Ronemus, A. D.; Vold, R. L.; Vold, R. R.; Ellis, P. D.; Raidy, T. R. J. Magn. Reson. 1987, 72, 89.
(24) Eichele, K.; Wasylishen, R. E. WSOLIDS NMR Simulation Package, version 1.17.26, 2000.
(25) Laaksonen, A.; Wasylishen, R. E. Z. Naturforsch. 1995, 50A, 137. (26) Penner, G. H.; Chang, Y. C. P.; Hutzal, J. Inorg. Chem. 1999, 38,
2868.
(27) Penner, G. H.; Chang, P.; Grandin, H. M. Unpublished results.
(28) (a) Torchia, D. A.; Szabo, A. J. Magn. Reson. 1982, 49, 107. (b) Wittebort, R. J.; Olejniczak, E. T.; Griffen, R. G. J. Chem. Phys. 1987, 86, 5411.
(29) Anderson, A.; Bobbie, B. A. Spectrosc. Lett. 1978, 11, 939.
Table 1 atomic positions atom x y z B11 0.1608(7) 0.1062(6) 0.1686(6) F12 0.0748(9) -0.0477(8) 0.1740(7) F13 0.3091(7) 0.0886(7) 0.0900(8) F14 0.1895(9) 0.1662(8) 0.3089(8) N15 0.0466(5) 0.2369(5) 0.0908(4) D16 0.1016(11) 0.3537(9) 0.0932(9) D17 -0.0665(11) 0.2477(9) 0.1387(6) D18 0.0265(11) 0.2067(10) -0.0123(7) Table 2 Intramolecular Distances (Å) B11-F12 1.400(8) N15-D16 1.024(7) B11-F13 1.393(9) N15-D17 1.007(9) B11-F14 1.394(9) N15-D18 0.991(7) B11-N15 1.554(5)
Structure and Dynamics of ND3BF3
for rotation of the BF3and NH3groups in the solid as 25.0
and 3.91 kJ/mol, respectively, while our deuterium T1
anisotropy measurements give a value of 9.5 kJ/mol for NH3
rotation. The internal rotational barrier in isolated NH3BF3
is exclusively due to intramolecular interactions between the N-H and the B-F bonds. In the solid one must take into account the decrease in the B-N bond length and
intermo-lecular N-H‚‚‚F-B hydrogen-bonding. MP2 and B3LYP calculations, using the 6-311++G(d,p) basis set and the gas-phase bond length of 1.672 Å, yield Ea values of 4.5 and
3.5 kJ/mol, respectively. If the bond length is shortened to the solid-state value of 1.551 Å, these values increase to 7.0 and 5.6 kJ/mol. Figure 8 shows the calculated barrier height, V3, as a function of rBN. These curves can be fit to the
equation V3)Ae-Br. The MP2 calculations are best fit with
A and B values of 2330 ( 70 kJ/mol and -3.75 ( 0.02, whereas the B3LYP values were 2080 ( 60 kJ/mol and -3.82 ( 0.02. The effect of hydrogen-bonding is much more difficult to calculate. As a first approximation one can start with the tetramer shown in Figure 3B and calculate the energy profile as the NH3group is rotated. Such a calculation
assumes that the fluorine atoms of the three neighboring molecules are essentially stationary as the NH3group rotates.
Our deuterium T1measurements yield a rate of 6.2 × 10¹⁰
s-1for the three-site jumps of the NH
3group in solid NH3
-BF3at 295 K. Earlier19F T1measurements provide a rate of
3.9 × 10⁷s-1for the BF
3rotational rate; a factor of about
1600 slower. An additional simplification is that the structure is not allowed to relax during the rotation of the NH3group.
A B3LYP/6-311++G** calculation yields a barrier of 16.4 kJ/mol. The relative energy as a function of rotational angle is shown in Figure 9. The points nearly follow the equation V(θ) ) 16.4 sin2(3θ/2) (also shown in Figure 9). If the structure were allowed to relax during the NH3 group
rotation, the barrier would be expected to decrease by a few kiloJoules per mole, bringing the calculated V3closer to our
experimental Ea value. One can also use the torsional
vibrational frequency to estimate the barrier, V3. If a high
Table 3
Intramolecular Angles (deg)
F12-B11-F13 110.4(5) F12-B11-F14 110.2(6) F12-B11-N15 108.03(7) F13-B11-F14 112.0(6) F13-B11-N15 109.02(6) F14-B11-N15 107.16(4) B11-N15-D16 109.94(8) B11-N15-D17 112.36(7) B11-N15-D18 111.99(5) D16-N15-D17 107.8(8) D16-N15-D18 108.0(8) D17-N15-D18 107.1(7) Table 4 Intermolecular D‚‚‚‚F Distances (Å) D16‚‚‚‚F23 1.994(9) 1/2-x,1/2+y, z D17‚‚‚‚F84 2.107(11) -1/2+x, y,1/2-z D18‚‚‚‚F32 2.110(10) -x, -y, -z Table 5
Intermolecular Angles (deg)a
N15-D16‚‚‚‚F23 175.11 N15-D17‚‚‚‚F84 154.32 N15-D18‚‚‚‚F32 151.70
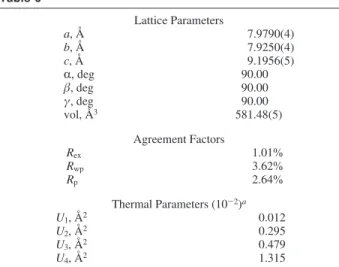
aObtained using PLUTON33and does not provide esd values. Table 6 Lattice Parameters a, Å 7.9790(4) b, Å 7.9250(4) c, Å 9.1956(5) R, deg 90.00 β, deg 90.00 γ, deg 90.00 vol, Å3 581.48(5) Agreement Factors Rex 1.01% Rwp 3.62% Rp 2.64% Thermal Parameters (10-2)a U1, Å2 0.012 U2, Å2 0.295 U3, Å2 0.479 U4, Å2 1.315
aThese values were refined but damped during the analysis.
Figure 1. Neutron diffraction intensity profile and calculated fit for solid
ND3BF3at 5 K. The upper part of the diagram shows the observed and calculated profiles, and the lower part of the diagram shows the difference between observed and calculated profiles.
Figure 2. Crystallographic unit cell for solid ND3BF3.
barrier is assumed, the potential function V3 sin2(3θ/2) is
replaced by 3V3θ2/2, and a harmonic oscillator Schro¨dinger
equation can be solved to give
where Iris the reduced moment of inertia for the rotation of
the ND3group; Ir)3mDrNDsin θ.30The previously measured
torsional frequency in solid ND3BF3gives a V3value of about
19 kJ/mol. Since the model used to obtain this number assumes a very high barrier to rotation, this number is an overestimation of V3. Either way, our calculated and
experi-mental values and the value estimated from the torsional
(30) Lister, D. G.; MacDonald, J. N.; Owen, N. L. Internal Rotation and InVersion; Academic Press: London, 1978.
Figure 3. (A) Tetramer cluster showing one BF3group and the surrounding hydrogen-bonded molecules. (B) Tetramer cluster showing one ND3group and the surrounding hydrogen-bonded molecules.
Table 7
Lattice Parameters
our results Geller et al.
space group Pbca Pbca
a, Å 7.9790(4) 8.22(3) b, Å 7.9250(4) 8.11(3) c, Å 9.1956(5) 9.31(3) R, deg 90.00 90.00 β, deg 90.00 90.00 γ, deg 90.00 90.00 vol, Å3 581.48(5) 620(7) rNB, Å 1.554(5) 1.60(5)
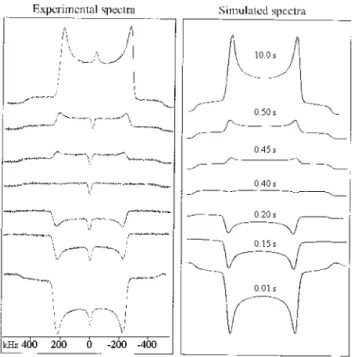
Figure 4. Experimental (upper) and simulated (lower) deuterium NMR
spectrum of solid ND3BF3. The narrow peak in the center of the experimental spectrum is due to ND4BF4.
Figure 5. Plot of the deuterium ln T1vs inverse temperature for solid ND3BF3.
Figure 6. Deuterium inversion recovery spectra for solid ND3BF3at 290 K and simulated spectra for different values of the interpulse spacing.
V3)89π2Irν2
Structure and Dynamics of ND3BF3
frequency for the barrier to NH3rotation in solid NH3BF3
are all significantly higher than the earlier solid-state experimental values.16
Boron, Nitrogen, and Deuterium Quadrupolar Coup-ling Constants.Calculations (B3LYP/6-311++G(d,p)) of
14N and11B nuclear quadrupolar coupling constants were
performed for boron-nitrogen bond lengths ranging from 1.4 to 1.8 Å, with optimization of all other structural parameters. The results are shown in Figure 10. The14N QCC
appears to be rather insensitive to changes in rBN, and no
clear trend is discernible. On the other hand, the11B QCC
changes significantly and, in fact, passes through zero and changes sign at about 1.50 Å. This difference can be easily explained electrostatically. Isolated BF3is planar and has a
large11B QCC. The calculated and experimental values are
2.53 (B3LYP/6-311++G**) and 2.64 MHz, respectively.31
As a B-N bond is formed, the arrangement around the boron
becomes tetrahedral with the fourth atom being the nitrogen. Since fluorine and nitrogen are rather electronegative atoms, there will be some arrangement where the electric field gradients along the three B-F bonds and along the B-N bond will cancel. For B-F bond lengths of about 1.4 Å this occurs when the B-N bond length is about 1.5 Å. In contrast, the geometry of the NH3moiety shows relatively little change
as the B-N bond is being formed. This together with the lower electron density around the boron results in the 14N
QCC being rather insensitive to rBN. Since the electric field
gradient at the nucleus, and hence the QCC, is a local molecular electronic property, the presence of the fluorine atoms on the boron has very little effect on the 14N QCC.
Now that we have determined the crystal structure of NH3
-BF3, it is possible to calculate the χ(14N) and χ(11B) for
gas-phase and solid NH3BF3. These values are presented in Table
8 together with the previously reported gas-phase microwave and solid-state NMR values. The quality of the spectrum previously presented by Olliges et al. is rather poor.18This
is primarily due to strong 11B-19F and 11B-1H dipolar
couplings exacerbated by the small11B QCC (relative to the
dipolar couplings). Our attempts to eliminate these dipolar couplings by19F decoupling and replacement of the protons
by deuterons resulted in very modest improvements. An alternative is to examine the10B spectrum. A10B spectrum
of solid ND310BF3, with19F decoupling, is shown in Figure
11. The most prominent feature is the so-called Pake doublet
(31) Casabella, P. A.; Uja, T. J. Chem. Phys. 1969, 50, 4814.
Figure 7. Plot of ln k vs 1/T for the rotation of the ND3group in solid ND3BF3.
Figure 8. Plot of the calculated barrier height in gas-phase NH3BF3as a function of B-N distance, rBN. The solid curve is a fit to the equation V3 )Ae-Br.
Figure 9. Plot of the calculated (B3LYP/6-311++G(d,p)) relative energies
for the rotation of the NH3group in the tetramer depicted in Figure 3B. The solid curve is the equation V(θ) ) 16.4 sin2(3θ/2).
Figure 10. Calculated11B and14N nuclear quadrupolar coupling constants for NH3BF3as a function of B-N bond length.
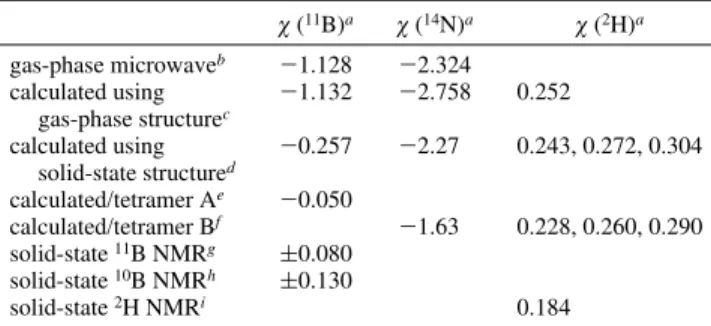
Table 8. Calculated and Experimental Nuclear Quadrupolar Coupling
Constants for ND3BF3in the Gas and Solid Phases
χ (11B)a χ (14N)a χ (2H)a gas-phase microwaveb -1.128 -2.324 calculated using gas-phase structurec -1.132 -2.758 0.252 calculated using solid-state structured -0.257 -2.27 0.243, 0.272, 0.304 calculated/tetramer Ae -0.050 calculated/tetramer Bf -1.63 0.228, 0.260, 0.290 solid-state11B NMRg (0.080 solid-state10B NMRh (0.130 solid-state2H NMRi 0.184
aQuadrupolar coupling constants in MHz.bRef 5.cStructure from
microwave study.dStructure from present neutron diffraction study.eSee
structure in Figure 3A.fSee structure in Figure 3B.gRef 18.hPresent work. iPresent work.
of the central 0T1 transition. A simulation based on a fit of this feature is also shown. The satellite 1T2 and 2T3 transitions do not have the intensity in the experimental spectrum as they do in the simulation. We cannot provide an explanation for this.
As shown in Table 8, our geometry-optimized structure for NH3BF3 gave 11B QCC that is in excellent agreement
with the observed gas-phase value. Both of these values are about an order of magnitude larger than the two experimental values for the solid state. If a calculation is done on a single molecule with the neutron diffraction structure, the QCC drops to 257 kHz, much closer to the NMR values. If intermolecular N-H‚‚‚F-B hydrogen-bonding is taken into account by calculating the QCC for the tetramer shown in Figure 3A, the value drops by a further factor of 5-50 kHz, in good agreement with experimental values.
Unfortunately there is no experimental value for the14N
QCC in solid NH3BF3. Our calculated single molecule value
agrees well with the gas-phase microwave number. Using the solid-state molecular structure reduces the QCC slightly, putting it in better agreement with the microwave value; this is fortuitous. A calculation on the tetramer depicted in Figure 3B causes a significant drop in the14N QCC. Therefore, one
can predict that, because of hydrogen-bonding effects, the solid-state14N QCC should be at least 1 MHz smaller than
the microwave value.
Going from the gas-phase structure to that in the solid and on to tetramer B appears to have very little effect on the deuterium QCC. The result of the last calculation is surprising considering that the deuterons should be directly involved in intermolecular hydrogen-bonding. It has been shown experimentally that hydrogen-bonding reduces the QCC. As pointed out in a previous section of this discussion, the deuterium QCC for ammonia drops from 290.6 kHz in the gas phase to 156 kHz in the solid state.
Chemical Shielding and Chemical Shifts.Calculations (B3LYP/6-311++G(d,p)) of the components of the nuclear magnetic shielding tensor (σ⊥and σ|for boron and nitrogen)
as a function of rBNare presented in Figure 12. The variation
of shielding with bond length is rather small, being less than 8 ppm in all cases. In addition, the anisotropy in the shielding, ∆σ ) σ|-σ⊥, is also small. The isotropic shielding is given
as σiso)1/3(σ|+2σ⊥). The nitrogen shielding values can
be converted to the chemical shift scale with respect to liquid CH3NO2according to the equation δ ) -135.8 - σ.32For
a single molecule using the solid-state structure a B3LYP/ 6-311++G(d,p) yields a δisoof -353.0 ppm. A calculation
on the tetramer (Figure 3B), where each NH3is surrounded
by three hydrogen-bonded NH3BF3molecules, gave a value
of -353.6 ppm. As can be seen, the effect of N-H‚‚‚F-B hydrogen-bonding on the 15N chemical shift is negligible.
The components of the chemical shift tensor, δ|and δ⊥, have
not been experimentally determined. Unfortunately there is no scale available to convert boron nuclear magnetic shield-ing to chemical shifts.
Conclusions
Our calculations and measurements, together with earlier measurements, show that the nuclear quadrupolar coupling constant can be a very sensitive probe of electronic, hence molecular, structure. We have successfully solved the neutron diffraction structure for solid NH3BF3. The crystal structure
shows two important features; a B-N bond length that is much shorter than that in the gas phase and N-H‚‚‚F-B hydrogen bonds. This structure, together with that from the gas phase, proved very useful for setting up the ab initio calculations. These calculations clearly demonstrated that the changes in the boron and nitrogen quadrupolar coupling constants observed in going from the gas to solid phases is a result of two effects: the large change in the B-N bond length and the N-H‚‚‚F-B hydrogen-bonding. Calculations employing the gas and solid-state structures also show that the higher barrier to rotation of the NH3moiety in the solid
is due to these factors. The calculated gas-phase deuterium QCC is much larger than that measured in the solid. Including the abovementioned, effects in the calculations do not bring the two into closer agreement. As yet we have no explanation for this.
Acknowledgment. We thank the Natural Sciences and Engineering Research Council (NSERC) of Canada for financial support. The efforts of Guy Bernard (University of Alberta) and Chris Kirby (University of Western Ontario) toward our attempts to acquire 10B spectra are greatly
appreciated. IC0203771
(32) Ha, T.-K. Chem. Phys. Lett. 1986, 107, 117. (33) Spek, A. L. Acta Crystallogr. 1990, A46, C34.
Figure 11. Experimental and simulated10B NMR line shapes for solid ND310BF3.
Figure 12. Calculated absolute boron and nitrogen nuclear magnetic
shielding values for NH3BF3as a function of B-N bond length. Structure and Dynamics of ND3BF3