HAL Id: hal-02324746
https://hal.archives-ouvertes.fr/hal-02324746
Submitted on 22 Oct 2019
HAL is a multi-disciplinary open access
archive for the deposit and dissemination of
sci-entific research documents, whether they are
pub-lished or not. The documents may come from
teaching and research institutions in France or
abroad, or from public or private research centers.
L’archive ouverte pluridisciplinaire HAL, est
destinée au dépôt et à la diffusion de documents
scientifiques de niveau recherche, publiés ou non,
émanant des établissements d’enseignement et de
recherche français ou étrangers, des laboratoires
publics ou privés.
Luminescence Properties of Mesoporous Silica
Nanoparticles Encapsulating Different Europium
Complexes: Application for Biolabelling
Séverine Lechevallier, Jose Jorge, Roberto Medeiros Silveira, Nicolas
Ratel-Ramond, David Neumeyer, Marie-Joëlle Menu, Marie Gressier, Alex
Lemes Marçal, Lucas Alonso Rocha, Marco Antônio Utrera Martines, et al.
To cite this version:
Séverine Lechevallier, Jose Jorge, Roberto Medeiros Silveira, Nicolas Ratel-Ramond, David Neumeyer,
et al.. Luminescence Properties of Mesoporous Silica Nanoparticles Encapsulating Different Europium
Complexes: Application for Biolabelling. Journal of Nanomaterials, Hindawi Publishing Corporation,
2013, 2013, pp.1-11. �10.1155/2013/918369�. �hal-02324746�
OATAO is an open access repository that collects the work of Toulouse
researchers and makes it freely available over the web where possible
Any correspondence concerning this service should be sent
to the repository administrator:
tech-oatao@listes-diff.inp-toulouse.fr
This is a Publisher’s version published in:
http://oatao.univ-toulouse.fr/24438
To cite this version:
Lechevallier, Séverine and Jorge, Jose and Silveira, Roberto Medeiros and
Ratel-Ramond, Nicolas and Neumeyer, David and Menu, Marie-Joëlle
and Gressier,
Marie
and Marçal, Alex Lemes and Rocha, Lucas Alonso and Martines, Marco
Antônio Utrera and Magdeleine, Eddy and Dexpert-Ghys, Jeannette and Verelst,
Marc Luminescence Properties of Mesoporous Silica Nanoparticles
Encapsulating Different Europium Complexes: Application for Biolabelling.
(2013) Journal of Nanomaterials (JNM), 2013. 1-11. ISSN 1687-4110
Hindawi Publishing Corporation Journal of Nanomaterials
Volume 2013, Article ID 918369,11pages
http://dx.doi.org/10.1155/2013/918369
Research Article
Luminescence Properties of Mesoporous Silica
Nanoparticles Encapsulating Different Europium Complexes:
Application for Biolabelling
S. Lechevallier,
1J. Jorge,
2R. M. Silveira,
2N. Ratel-Ramond,
1D. Neumeyer,
1M. J. Menu,
3M. Gressier,
3A. L. Marçal,
4A. L. Rocha,
4M. A. U. Martines,
2E. Magdeleine,
5J. Dexpert-Ghys,
1and M. Verelst
11Centre d’Elaboration de Mat´eriaux et d’Etudes Structurales, Universit´e de Toulouse, 29 rue Jeanne Marvig, BP 94347,
31055 Toulouse Cedex 4, France
2CCET, Universidade Federal de Mato Grosso do Sul, Campo Grande, MS, Brazil
3Centre Interuniversitaire de Recherche et d’Ing´enierie des Mat´eriaux, UPS-CNRS 5085, Universit´e de Toulouse,
118 route de Narbonne, 31062 Toulouse Cedex 9, France
4Universidade De Franca, Franca, SP, Brazil
5ICELLTIS, Prologue 1, 815 La Pyr´en´eenne, 31670 Lab`ege, France
Correspondence should be addressed to S. Lechevallier; severine.lechevallier@cemes.fr Received 5 April 2013; Accepted 25 June 2013
Academic Editor: John Zhanhu Guo
Copyright © 2013 S. Lechevallier et al. This is an open access article distributed under the Creative Commons Attribution License, which permits unrestricted use, distribution, and reproduction in any medium, provided the original work is properly cited. In this work we have synthesized and characterized new hybrid nanoplatforms for luminescent biolabeling based on the concept of Eu3+complexes encapsulation in mesoporous silica nanoparticles (≈100 nm). Eu complexes have been selected on the basis of their capability to be excited at 365 nm which is a currently available wavelength, on routine epifluorescence microscope. For Eu complexes encapsulation, two different routes have been used: the first route consists in grafting the transition metal complex into the silica wall surface. The second way deals with impregnation of the mesoporous silica NPs with the Eu complex. Using the second route, a silica shell coating is realized, to prevent any dye release, and the best result has been obtained using Eu-BHHCT complex. However, the best solution appears to be the grafting of Eu(TTA)3-Phen-Si to mesoporous silica NPs. For this hybrid, mSiO2-Eu(TTA)3(Phen-Si) full characterization of the nanoplatforms is also presented.
1. Introduction
Recent breakthroughs in the synthesis of mesoporous silica materials with the control of the particle size, the morphol-ogy, and the porosity, along with their chemical stability, have made silica matrices highly attractive as the structural basis for a wide variety of nanotechnological applications
such as adsorption, catalysis, sensing, and separation [1–
7]. In addition, some authors have highlighted that
surface-functionalized mesoporous silica nanoparticle (MSN) mate-rials can be readily internalized by animal and plant cells
without posing any cytotoxicity issue in vitro [8, 9]. These
new developments offer the possibility of designing a new generation of drug/gene delivery systems and biosensors for intracellular controlled release applications.
Another possible application consists in encapsulating a luminescent dye in plain or mesoporous silica nanoparticles
for optical biolabeling [10–12]. For this goal, the dye molecule
must be perfectly trapped inside the mesoporous matrix in order to prevent the leaching and bleaching effects. Many dye molecules can be encapsulated inside mesoporous NPs;
however, we think that lanthanide complexes as Eu3+or Tb3+
organic probes) to allow the time delayed measurement for complete extinction of the biological self-fluorescence during
the measurement [13]. Moreover, encapsulated lanthanide
chelates are not, or weakly, subjected to photobleaching or photobleaking, they are chemically very stable and non-toxic. All these factors constitute major advances, as it has been well
demonstrated by Dr. Jin and his team [14].
However, for most luminescent Eu3+and Tb3+complexes,
one of the major drawbacks is that optical excitation window is limited to the far-UV (<330 nm) range. Far-UV excitation is often problematic in biology because it causes damages to the cellular matter. Excitation below 330 nm involves poor transmission in most optics, is bulky, expensive, and has limited light sources. Most of commercial flow cytometers
and microscopes are not used at these wavelengths [14–16].
Several longer-wavelength-sensitized Eu3+ complexes
have been developed in recent years [17–22] and used as
biolabels for time-resolved luminescence bioimaging appli-cations. Their properties have been illustrated, for example, by the highly specific and sensitive imaging of an
envi-ronmental pathogen, that is, Giardia lamblia [23], and by
the use of bioconjugated silica nanoparticles embedding an
europium complex to mark cancerous cells [24]. However
for our knowledge, encapsulation of such complexes inside mesoporous nanoparticles has not been done systematically. The main advantage of mesoporous NPs is their high loading
capability compare to plain SiO2NPs, which can potentially
lead to brighter probes. Consequently, the main goal of this work is to encapsulate these new long wavelength-sensitized
Eu3+complexes and to characterize the derived new
nanohy-brids, for cellular labeling, using light excitation in the NUV range (355–365 nm) given by laser (or Hg lamp) sources available on flow cytometer or fluorescent microscope. To reach this goal we have used two different approaches. The first route consists in grafting transition metal complexes into the silica wall surface by using a bifunctional ligand which can chelate the metal on one side and react with
the silica wall on the other side (samples named as mSiO2
-XXX in the following). The second way is easier and consists
in impregnating the mesoporous silica NPs with the Eu3+
complex and then to elaborate a silica shell coating which will
prevent any dye release (samples named as mSiO2@XXX in
the following).
2. Experimental Section
2.1. Reagents and Materials. Most reagents were purchased
from Sigma-Aldrich. N,N-Dimethylformamide (DMF),
hex-ane, chloroform, and ethanol were of analytical grade and
used without any further purification. Eu(NO3)3was aqueous
stock solution from Rhodia.
2.2. Chemical Synthesis
2.2.1. Synthesis of Mesoporous Silica Nanoparticles (mSiO2).
Typically, 0.2821 g of NaOH (PRS Panreac) and 1.048 g of cetyltrimethylammonium bromide (CTAB) were mixed with 480 mL of distilled water. After this, the mixture was kept
under constant stirring, and the temperature was increased
up to 80∘C. 5 mL of tetraethyl orthosilicate (TEOS) was
added as the silica precursor, dropwise, slowly (in 20 min
approximately). The mixture was kept at 80∘C under vigorous
stirring for 20 h. The obtained precipitate was centrifuged and washed with water. The sedimented product was rapidly dried
in an oven at 60∘C and then treated at 500∘C for 5 h (increase
1∘C/min), in order to decompose all the surfactants. The final
weight of the obtained silica was approximately 1.0 g.
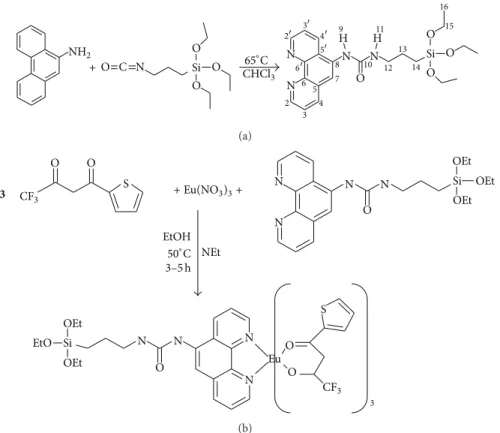
2.2.2. Synthesis of Eu(TTA)3(Phen-Si) and Grafting in mSiO2.
Eu(TTA)3(Phen-Si) complex was prepared via a two-step
process as shown inFigure 1.
(a) Synthesis of Ligand Phen-Si. The ligand was prepared
according to the procedures described by Li et al. [25,26].
Typically, 5-amino-1,10-phenanthroline (4.1 mmol, 800.4 mg)
was dissolved in CH3Cl (75 mL), and 3-(triethoxysilyl)propyl
isocyanate (4.5 mmol, 1.11 mL) was added to the solution. The mixture was then reduced to a volume of 5 mL and
refluxed at 65∘C under Ar overnight. Cold hexane was then
added to precipitate the powder. This powder was collected by centrifugation, washed with hexane, and dried under vacuum overnight.
Elemental analysis for C22H30N4O4Si, %, found
(calcd.): C 52.8 (57.4); H 5.7 (6.22); N 12.1 (13.4). 1H NMR (300.13 MHz; CDCl3,𝛿Hppm) 0.63 (2H, m, CH2, 14-H), 1.10 (9H, t,𝐽AB7, CH3, 16-H), 1.68 (2H, m, CH2, 13-H), 3.34 (2H, m, CH2, 12-H), 3.75 (6H, q,𝐽AB7, CH2, 15-H), 6.34 (1H, br, CH, 7-H), 7.20 (1H, dd, CH, 3-H), 7.57 (1H, dd, CH, 3-H), 8.15 (1H, m, CH, 4-H), 8.18 (1H, br, NH, 11-H), 8.37 (1H, m, CH, 4-H), 8.38 (1H, br, NH, 9-H), 8.86 (1H, m, CH, 2-H), 9.00 (1H, m, CH, 2-H).13C{1H} NMR (75.5 MHz; CDCl3,𝛿c ppm) 7.7 (s, CH2, 14), 18.3 (s, CH3, 16), 23.7 (s, CH2, 13), 42.8 (s, CH2, 12), 58.4 (s, CH2, 15), 118.1 (s, CH, 7), 122.4 (s, CH, 3), 123.5 (s, CH, 3), 125.0 (s, C, 6), 129.0 (s, C, 5), 131.0 (s, CH, 4), 132.8 (s, C, 5), 135.9 (s, CH, 4). 143.0 (s, C, 6), 146.2 (s, C, 8), 149.0 (s, CH, 2), 149.6 (s, CH, 2), 156.8 (s, C, 10).
(b) Synthesis of Complex Eu(TTA)3(Phen-Si). The complex
was prepared according to the procedure described by Duan
et al. [28]. 2-Thenoyltrifluoroacetone (TTA) (6 mmol, 1.332 g)
was dissolved in 20 mL of absolute ethanol, and triethylamine (6 mmol, 0.81 mL) was added. After 10 min of stirring, the ligand (Phen-Si) (2 mmol, 0.738 g) was added, followed by
Eu(NO3)3(2 mmol, 0.517 g). The reaction mixture was heated
at 50–60∘C and stirred under Ar for an appropriate time
(3–5 h). The reaction mixture was then cooled to room
temperature, and the solvent was removed at 40∘C under
reduced pressure until obtaining a powder. Then the powder was washed with water and centrifuged. The crude product was then recrystallized by refluxing in ethanol to obtain the desired product which was collected by filtration and dried
under vacuum at 40∘C.
Elemental analysis for C46H39N4O10F9S3SiEu, %, found
(calcd.): C 41.4 (44.0); H 3.6 (3.1); N 8.2 (8.16). SM. (m/z);
found 839.9. Calc. for (Eu(Phen-Si)(TTA)(NO3))+: 837. IR
Journal of Nanomaterials 3 + NH2 O O O O O O O O C N N N N N Si CHCl Si 3 65∘C 2 3 4 5 6 7 8 9 10 11 12 13 14 15 16 2 3 4 5 6 H H (a) 3 CF3 O O O S + Eu(NO 3)3+ N N N N Si OEt OEt OEt NEt EtOH 50∘C 3–5 h CF3 O O O S N N N N Si OEt OEt EtO Eu 3 (b)
Figure 1: Chemical structure of (a) the silylated phenanthroline ligand (Phen-Si) (and carbon atom numbering related to NMR data) and (b) the Eu(TTA)3(Phen-Si) complex.
1500] (C=O); 1440, 1423, 1385 ]as(C–C=C) aromatic; 737, 668
𝛾 (=C–H) aromatic.
(c) Grafting of Eu(TTA)3(Phen-Si) into mSiO2Nanoparticles.
The grafting was carried out according to a modified protocol
from Rocha et al. [27]. mSiO2 NPs were suspended in
DMF. 94.2𝜇mol/g of Eu(TTA)3(Phen-Si) complex was also
suspended with DMF. Then the two suspensions were mixed,
and the final concentration of mSiO2was 1 mg/mL. The
mix-ture was refluxed for 24 h. The powder was then centrifuged,
washed three times with ethanol, and dried at 80∘C in an oven
overnight. The europium content, determined by TEM-EDX, is 0.1% (mol).
2.2.3. Synthesis of Si-DBM-Eu(DBM)2Complex and
Grafting in mSiO2
(a) Preparation of Sodium 𝛽-Diketonate (Na-DBM). The
ligand was prepared according to the procedure described by
Machado et al. [29] and De Oliveira et al. [30]. Na(s) (0.7 g,
30.0 mmol) was dissolved in 30 mL of anhydrous methanol under an argon atmosphere to produce sodium methoxide. 6.7 g (30.0 mmol) of dibenzoylmethane (DBM) was added to the methoxide solvent to obtain a viscous suspension. Subsequently, the powder was collected by filtration, washed
with anhydrous methanol, and dried under vacuum at 50∘C
producing Na-DBM with a yield of 85%.
(b) Synthesis of Silylant Agent with 3-Chloropropyltrime-thoxysilane (TMOSCl). TMOSCl (1.13 mL, 6.0 mmol) and
1.482 g (6.0 mmol) of Na-DBM were added to 30 mL of anhydrous methanol. The solution was stirred under argon
atmosphere at 50∘C for 24 h. The silylating agent was denoted
by Na(Si-DBM).Figure 2shows the chemical structure that
represents this process.
(c) Grafting of Na(Si-DBM) inside mSiO2Nanoparticles,
Com-plexation with Eu3+. The grafting was carried out according
to a modified protocol from Rocha et al. [27]. mSiO2 NPs
(50 mg) were added to anhydrous ethanol (0.35 mol) and 30%
NH4OH (10 mmol) mixture. Na(Si-DBM) solution (1.31 mL)
was then added to the above mixture that was then stirred for 1 h. The powder was then centrifuged, washed three
times with ethanol, and dried at 50∘C in an oven overnight.
Finally, the powder was suspended in anhydrous ethanol
(10 mL) containing EuCl3(2.35 mL, 0.10 mol⋅L−1), producing
mSiO2-Eu(Si-DBM). To complete the coordination sphere
of Eu3+, 20 mg of DBM-Na was added to produce the final
luminescent material, SiDBM-Eu(DBM)2 [30]. The powder
was again centrifuged, washed three times with ethanol, and
H3C H3C CH3 O O O Si H3C H3C CH3 O O O O O O O Si Cl TMOSCl + + Na-DBM Na+ Na+ HCl Na(Si-DBM)
Figure 2: Chemical structure of the silylated Na(Si-DBM) ligand [27].
500 1000 1500 2000 2500 3000 3500 4000 Wavenumber (cm−1) 400 600 800 1000 1200 1400 1600 1800 Wavenumber (cm−1) T (%) T (%)
Figure 3: FTIR spectrum of Si-DBM-Eu(DBM)2.
FTIR spectrum of sample is presented Figure 3. The
typical bands of both DBM and silica structure, such as a large
band centered on 3434 cm−1, assigned to OH stretching of
silanol groups of inorganic mesoporous structure of material and also adsorbed and/or bonded water can be seen. Three
peaks at 2964, 2923, and 2852 cm−1 are related to C–H
stretching of CH2 and CH3 groups. The mesoporous silica
structure can also be seen with the bands at 1065, 805, and
455 cm−1, corresponding to the different Si–O–Si vibrations
(stretching, bending, and rocking, resp.). Signal related to the beta-diketone can also be observed with the four bands at
1597, 1548, 1458, and 1313 cm−1, corresponding, respectively,
to]as(C=O),] (C=C), ]s(C=O), and]as(C–C) of DBM [30].
Europium content has been quantified by EDX-MET and has been found to be 0.04% (mol).
2.2.4. Impregnation of mSiO2NPs with Eu(DBM)3(Phen) and
Eu(BHHCT) Complexes
(a) Synthesis of Eu(DBM)3(Phen) and mSiO2 Impregnation.
The complex was prepared according to Melby et al. [31]
with some modifications. The ligand was first deprotonated
by addition of 113.6𝜇L of a solution of KOH in methanol
0.990 mol⋅L−1 to 750𝜇L of an ethanolic solution of
diben-zoylmethane (DBM) 0.150 mol⋅L−1, followed by 375𝜇L of an
ethanolic solution of 1,10-phenantroline 0.1 mol⋅L−1. Then,
375𝜇L of an aqueous solution of Eu(NO3)3 0.1 mol⋅L−1 was
added dropwise under magnetic stirring, to give the
pre-cipitated complex [Eu(DBM)3(Phen)]. This suspension was
stirred for 24 h at room temperature and then centrifuged. The precipitate was carefully washed with ethanol, recovered
by centrifugation, and dried at 60∘C in air overnight. The
complex was then dissolved in DMSO and stirred with 30 mg of mesoporous silica nanoparticles during 24 h at room temperature, in order to encapsulate it. The amount of europium complex impregnated was calculated to be
6.25𝜇mol per 5 mg of mesoporous silica. Finally, the sample
was coated with silica-amine shell as described in the next
topics. After analysis, the Eu3+content has found to be 0.42%
(mol).
(b) Synthesis of Eu(BHHCT) Complex and mSiO2
Impreg-nation. The ligand 4,40-bis(1,1,1,2,2,3,3
-heptafluoro-4,6-hexanedion-6-yl) chlorosulfo-o-terphenyl (BHHCT)
was prepared as previously reported [32]. In order to form
the complex Eu-BHHCT, 5 mg (6.25𝜇mol) of BHHCT ligand
was dissolved in 15 mL of propanol. 2.29 mg (6.25𝜇mol) of
EuCl3⋅6H2O was dissolved in 0.25 mL of distilled water and
then added to the BHHCT solution. The mixture was aged at room temperature in darkness, in order to form the complex. Then, 5 mg of mesoporous silica nanoparticles was added to the complex solution, and the suspension was kept under stirring for one night, at room temperature, in darkness. In order to prevent any leak of the impregnated complex, the silica coating was elaborated without any purification.
How-ever, after silica coating, Eu3+ content has been determined
by MET-EDX and was found to be 1% (mol).
(c) Aminosilane Coating. In order to avoid the leak of the
impregnated complexes, the nanocapsules were closed by coating them with a thin silica layer. Typically 30 mg of impregnated silica nanoparticles was dissolved in 80 mL of
propanol under ultrasound for 2 h. Then, 8.94 mL of NH4OH
(28%), 7.5 mL of distilled water, and 25𝜇L of TEOS were
added to the mixture and stirred at 40∘C for 2 h. Then,
100𝜇L of (3-aminopropyl)trimethoxysilane (APTMS) was
Journal of Nanomaterials 5
(a) (b)
Figure 4: SEM (a) and TEM (b) images of synthetized mesoporous silica nanoparticles (mSiO2).
2 4 0 2000 q (nm−1) I∗ q (nm −1)
Figure 5: SAXS diagram of synthetized mesoporous silica nanopar-ticles (mSiO2).
mixture is then centrifuged and washed with propanol, and the obtained precipitate is dried in oven overnight. The final weight of the material was approximately 45 mg. Note that the APTMS molecule does not play any role to prevent the dye release. This molecule has been added at the end of the coating protocol in order to introduce amine functions which are very useful for further biofunctionalization.
2.3. Physical and Chemical Characterizations. 1H and
13C NMR spectra were recorded on Bruker Advance
300, with chemical shifts (in ppm) reported relative to tetramethylsilane. Mass spectra were recorded by FAB or IS techniques using a Normas R10-10 spectrometer. Elemental analyses were performed on elementary analyses (EA) which were performed using a Perkin Elmer 2400 series II elemental analyser. Chemical bonding was characterized by infrared spectroscopy using a Perkin Elmer spectrometer 100 series. Samples were prepared by mixing the powders
with potassium bromide (1/100 by weight) in a pellet. Nitrogen adsorption-desorption curves were measured with
a Belsorp-mini (BEL Japan Inc.) between 0 and 99 p/p0 at
77 K. Pretreatment was performed under vacuum during 24 h
at 80∘C. Small angle X-ray scattering (SAXS) analyses were
performed on an INEL XRG3D device. Small angle X-ray scattering signal from mesoporous silica was obtained with X-rays produced by a Cu anode. The X-ray beam was then filtered and focused onto the specimen using Kirkpatrick-Baez mirrors, thus delimiting a small and nondivergent beam. Scattered intensity was recorded on an imaging plate, located 38 cm behind the specimen. Particle shape, size, and composition were examinated by Transmission Electron Microscopy (TEM) using Philips CM20 FEG microscope, equipped with EDX detector. This EDX detector was used to quantify Eu contents of samples. Fluorescence spectra were recorded with a Fluorolog FL3-22 Jobin Yvon spectrometer equipped with a R928 Hamamatsu photomultiplier and a 450 W excitation lamp. For the analysis of emission decay versus time, a pulsed Xe source was employed. The emission decays have been recorded under excitation at 365 nm,
monitoring the 5D0 → 7F2 at its maximum (612 nm).
Experimental decays have been calculated according the
formula𝜏 = [∫0∞𝑡 ∗ 𝐼(𝑡)𝑑𝑡]/[∫0∞𝐼(𝑡)], with an error range
estimated to be 15%.
2.4. Cell Culture, Cytotoxicity Test, and Fluorescence Imaging.
An indirect cytotoxicity test was performed using an elution
method as described previously [33]. The used cells are
MDA-MB231 which are triple negative breast cancer cells [34].
The cells are maintained in culture in RPMI 1640 medium complemented with 10% fetal bovine serum, 1%
penicillin-streptomycin and incubated at 37∘C with 5% CO2. For in vitro
labeling as for cytotoxic tests, cells were placed in 96-well plate at 10000 cells/well. The particles were added at different concentrations to the cell medium after sonication. The MTT (methyl thiazoletetrazolium, Sigma) test is used to evaluate the viability of the MDA-MB231 in the presence of different
550 600 650 700 S1 c/R 1 (CPS/ 𝜇 A) Wavelength (nm) mSiO2-Eu(Si-DBM)
mSiO2-Eu(TTA)3(Phen-Si)
mSiO2@Eu-BHHCT mSiO2@Eu(DBM)3Phen (a)
250 300 350 400 450 500
Wavelength (nm)
mSiO2-Eu(Si-DBM)
mSiO2-Eu(TTA)3(Phen-Si)
S1 /R 1c (CPS/ 𝜇 A) mSiO2@Eu-BHHCT mSiO2@Eu(DBM)3Phen (b)
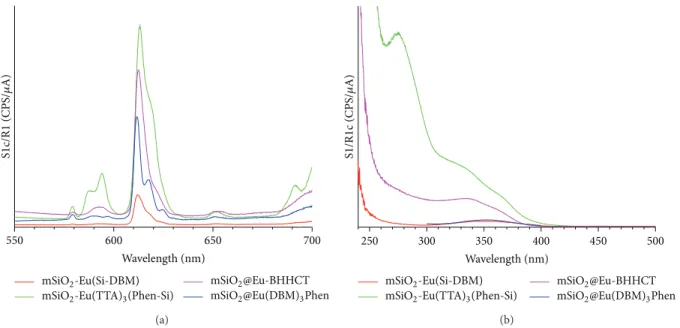
Figure 6: (a) Emission spectra (𝜆ex = 365 nm) and (b) excitation spectra (𝜆em= 612 nm) of Eu(Si-DBM)3, Eu(DBM)3-Phen, Eu-BHHCT, and Eu(TTA)3(Phen-Si) complexes incorporated in mSiO2. Particle concentration = 0.25 mg⋅mL−1in water.
500 1000 1500 2000 2500 3000 3500 4000 Eu(TTA)3(Phen-Si) Wavenumber (cm−1) mSiO2 T (%)
mSiO2@Eu(TTA)3(Phen-Si)
Figure 7: IR spectra of mSiO2, Eu(TTA)3(Phen-Si), and mSiO2 -Eu(TTA)3(Phen-Si).
concentrations of the NPs (mSiO2-Eu(TTA)3(Phen-Si)) one
and three days after their addition to cell culture medium. MTT test is a colorimetric assay for measuring the activity of enzymes that reduce MTT to formazan dye, giving a purple color. DMSO (dimethylsulfoxide) solution is added to dissolve the insoluble purple formazan product into a colored solution. The absorbance of this colored solution can be quantified by measuring at 570 nm by a spectrophotometer.
For in vitro labeling, cells were incubated with NPs (0.1 mg/mL, 24 h). Microscopic images were obtained using a “home-made” Time Gated Luminescence Microscope (TGLM) kindly built for us by Dr. Dayong Jin from Mac-quarie University of Sydney. The main interest of a TGLM
is to be able to separate long-lasting fluorescence coming from lanthanides from self-fluorescence coming from the
biological media [23].
3. Results and Discussion
3.1. Synthesis of Mesoporous Silica Nanoparticles. The
synthe-sis procedure is based on the protocol proposed by [35]. After
a full optimization procedure with many varying parameters as reactant concentration (TEOS: 0.93 mmol to 4.7 mmol and
CTAB: 0.77 mmol to 7.1 mmol), temperature (25 to 90∘C), and
reaction time (2 to 20 h), we find that the best results (average size close to 100 nm, spherical shape, no agglomeration, high surface area, and a high porous volume) were obtained
with the procedure reported in Section 2. Figure 4 shows
SEM images (a) of particles. Average particle size (feret diameter, counted on 242 particles) is 116 nm with a standard
deviation of 45 nm. On the TEM image ofFigure 4(b)one
can clearly see the well-ordered mesoporous structure of
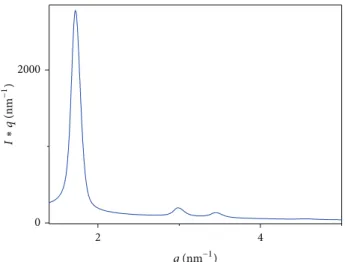
particles. SAXS analysis presented inFigure 5is characteristic
of a hexagonal MCM 41 well-organized mesostructure [36]
with three visible diffraction peaks: d(100) = 3.37 ˚A, d(110)
= 2.22 ˚A, and d(200) = 1.91 ˚A. The adsorption/desorption
isotherm (BET) experiments done at 77 K under nitrogen
give a specific surface area equal to 1018 m2g−1. The average
pore size is centered at 5.476 nm whereas total porous volume
is estimated at 1.397 cm3g−1.
3.2. Comparison of Luminescent Properties of Eu Complexes
Incorporated in mSiO2. In order to verify that no release of
complexes occurs in aqueous solution we have checked that nanoplatforms do not lose luminescence intensity (<5%) after severe water leaching (3× 1 h in water). Then, to compare performance of the different luminescent nanoplatforms
Journal of Nanomaterials 7
(a) (b)
(c) (d)
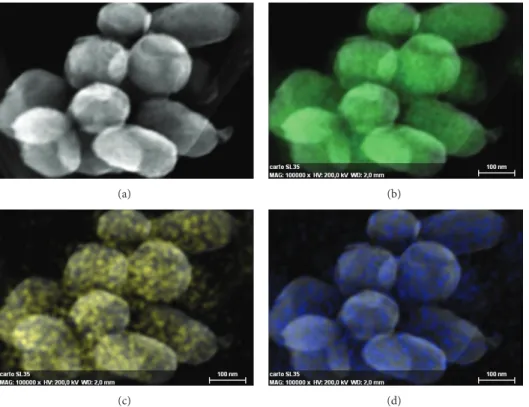
Figure 8: Electron microscope images and elemental cartography of mSiO2-Eu(TTA)3(Phen-Si). (a) STEM image, (b) Si cartography, (c) N cartography, and (d) Eu cartography.
we have recorded an emission spectrum after excitation at 365 nm (laser diode or Hg lamp wave length usually found on many epifluorescence microscope) under exactly the same
condition (0.25 mg⋅mL−1of NPs in water). Results, presented
in Figure 6, show that all complexes have a maximum
emission band centred around 613 nm. However, emission intensities, recorded under the same conditions, are different. The sample presenting the most intense luminescence is
the one with Eu(TTA)3(Phen-Si) complex, grafted inside
the mesopores of the mSiO2 NPs. As this sample presents
the highest luminescent intensity, it has been selected for further characterization.
3.3. Characterization of the Eu(TTA)3(Phen-Si) Complex
Grafted in mSiO2. Eu(TTA)3(Phen-Si) complex was
suc-cessfully prepared via a two steps process as shown in
Figure 1. Ligand (Phen-Si) was first obtained by reacting
5-amino-1,10-phenanthroline and 3-(triethoxysilyl)propyl
iso-cyanate (Figure 1(a)). Europium complex was then
pre-pared from Eu(NO3)3, 2-thenoyltrifluoroacetone (TTA), and
phenantroline ligand (Phen-Si) in the presence of
triethy-lamine in ethanol at 50–60∘C (Figure 1(b)).Figure 7shows
infrared spectra of Eu(TTA)3(Phen-Si) complex, mSiO2, and
the sample of mSiO2 incorporating the complex (mSiO2
-Eu(TTA)3(Phen-Si)). The spectrum of the complex presents
the characteristic bands of phenanthroline as well as those of TTA, indicating that the complex has been obtained. On
the mSiO2 spectrum, the well-known bands of SiO2 are
observed. The mSiO2-Eu(TTA)3(Phen-Si) spectrum exhibits
both bands of the complex and mSiO2, especially in the
region of 1700–600 cm−1.
The sample mSiO2-Eu(TTA)3(Phen-Si) has also been
investigated by BET analysis. After loading, the porous
volume decreases down to 0.9570 m3⋅g−1 (instead of
1.397 m3⋅g−1), as well as the specific area to 684 m2⋅g−1
(instead of 1018 m2⋅g−1). This loss of porous volume and
specific area confirms that the complex Eu(TTA)3(Phen-Si)
is well grafted into the mesopores of the NPs.
Figure 8presents the elemental cartography obtained by
EDX spectroscopy on STEM microscopy. It can be seen that
after incorporation, mSiO2keeps its spherical shape without
any aggregation. EDX spectroscopy results show that silicon atoms are homogenously dispersed to form the mesoporous
silica matrix (Figure 8(b)). Nitrogen and europium atoms
are also detected, corresponding to the grafted complex
(Figures8(c)and8(d)). Images reveal that these elements are
homogenously well dispersed all inside the NPs, confirming the good repartition of the complex, all around the walls of the mesoporous silica.
In Figure 9(a) emission spectra of the grafted complex
recorded in ethanol after excitation at 365 nm are gathered.
For the free complex the concentration was 0.25 mg⋅mL−1,
corresponding to 2⋅10−4mol⋅L−1 in Eu3+, and for the grafted
complex the concentration was 1 mg⋅mL−1, corresponding
to 2⋅10−5mol/L in Eu3+ (considering a grafting rate of
0.1% (mol)). The characteristic emission lines of transitions
5D
0 → 7F𝐽 of Eu3+ are observed for both samples. Some
500 550 600 650 700 750 𝜆 (nm)
mSiO2
mSiO2-Eu(TTA)3(Phen-Si)
Eu(TTA)3(Phen-Si) 5D 0→7F0 5D 0→7F1 5D 0→7F2 5D 0→7F3 5D 0→7F4 I (a.u .) (a) mSiO2
mSiO2-Eu(TTA)3(Phen-Si)
Eu(TTA)3(Phen-Si) 250 300 350 400 450 𝜆 (nm) I (a.u .) (b) 0 0.5 1 1.5 2 2.5 3 3.5 4 0 1 × 10⁷ 2 × 10⁷ 3 × 10⁷ 4 × 10⁷ 5 × 10⁷ 6 × 10⁷ Time (ms) Eu(TTA)3(Phen-Si) mSiO2-Eu(TTA)3(Phen-Si)
I
(a.u
.)
(c)
Figure 9: (a) Emission spectra recorded after excitation at 365 nm, (b) excitation spectra recorded at 612 nm, and (c) emission decay curves recorded at 612 nm under excitation at 365 nm for pure Eu(TTA)3(Phen-Si) complex and mSiO2-Eu(TTA)3(Phen-Si).
0 0.05 0.1 0.15 0.2 0 0.1 0.5 1 2 DO NPs concentration (mg/mL)
Figure 10: Cytotoxicity test of mSiO2-Eu(TTA)3(Phen-Si). The higher is the DO, the higher is the living cells number.
5D
0 → 7F1 transition and relative intensities of 5D0 →
7F
4/5D0 → 7F2.Figure 9(b)presents excitation spectra for
these samples observed at 612 nm. For the free complex, one broad band centred on 360 nm can be seen. After
incorpo-ration into mSiO2 this broad band remains, but seems to
be shifted to higher energy, around 330 nm. This is probably
due to the covalent grafting of the complex into mSiO2,
which modifies energy transfers from the antenna to Eu3+
ions. The5D0luminescence decays for the free complex and
the complex grafted into mSiO2are shown inFigure 9(c). The
free complex exhibits monoexponential decay𝐼 = 𝐼0⋅ 𝑒(−𝑡/𝜏)
with lifetime𝜏 = 0.6±0.06 ms. For grafted complex, the decay
is clearly biexponential: the faster component is the same as for pure complex, but a slower component with lifetime
Journal of Nanomaterials 9
(a) (b)
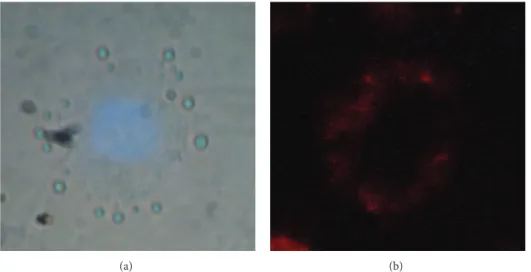
Figure 11: Internalization of mSiO2-Eu(TTA)3(Phen-Si) in MDA-MB231 cancer cells after exposure to NPs (overnight, 0.1 mg⋅mL−1). (a) Representative bright field images + UV excitation (𝜆ex: 365 nm, the blue color comes from the nucleus colored with DAPE used to help cells detection). (b) UV excitation (𝜆ex: 365 nm) and time gated detection of Eu(TTA)3(Phen-Si).
estimated to about 1 ms is also observed. The average decay,
estimated with the formula𝜏 = [∫0∞𝑡 ∗ 𝐼(𝑡)𝑑𝑡]/[∫0∞𝐼(𝑡)],
is 𝜏 = 0.80 ± 0.08 ms. From the comparison of emission
spectra and of emission decays, at least two populations
of Eu3+ are then observed after grafting into mSiO2. A
detailed investigation of luminescence data, necessary to discuss the possible structures of these populations, is beyond the scope of this paper. It is important to notice here two essential features for the potential applications. The first point is the red emission observed for the dispersed NPs and the pure complex in solution, both excited at 365 nm, that is, in the organic antenna, and recorded under the same experimental conditions and have the same intensities. The other point of interest is that the emission lifetime of the grafted NPs is suitable for microsecond time gated detection of luminescence.
3.4. Cytotoxicity Tests on Nanoparticles. The optical density
(OD) is directly proportional to the living cells number. The comparison of the proliferation of MDA-MB231 cancer cells, in contact (during 3 days) with growing concentrations of NPs 0.1; 0.5; 1; and 2 mg/mL, emphasizes a significant decrease of cell viability, and an inhibition of cell growth for
doses of NPs higher than 0.1 mg⋅mL−1(Figure 10).
Neverthe-less, for particles of concentration around 100𝜇g⋅mL−1, we
consider that the cytotoxicity of NPs is negligible.
3.5. Observation of Particles Fluorescence in Living Cells. The
spherical mSiO2-Eu(TTA)3(Phen-Si) NPs have been allowed
to react with MDA-MB231 cancer cells under conditions
where NPs are shown to be noncytotoxic (0.1 mg⋅mL−1)
overnight. Images in Figure 11 show that NPs have been
internalized by the cells. Indeed, a strong red fluorescence is observed in their cytoplasm with a higher intensity in the
perinuclear area. The nucleus, stained in blue with DAPE, appears to be totally free of NPs as shown by time gated detection. Time gated detection collects the emission light
only 100𝜇s after the excitation, keeping only the long-lasting
luminescence of Eu3+ and removing all the background
coming from the DAPE dye and self-fluorescence of the
biological media [14].
4. Conclusion
We have synthesized new hybrid nanoplatforms for
lumi-nescent biolabeling based on the concept of Eu3+
com-plexes encapsulation inside mesoporous silica nanoparticles. Europium complexes have been selected on the basis of their capability to be exited at 365 nm which is a wavelength currently available on routine epifluorescence microscope.
For Eu3+complexes encapsulation two different routes have
been used: the first route consists in grafting the transition metal complexes into the silica wall surface. The second way deals with physicochemical impregnation of the mesoporous silica NPs with the Eu complex. Then a silica shell coating will prevent any dye release. For this last protocol, the best result has been obtained using Eu-BHHCCT complex. However
the best solution appears to be Eu(TTA)3(Phen-Si) complex
covalently grafted inside the mesoporous silica NPs.
References
[1] B. I. Slowing, B. G. Trewyn, S. Giri, and V. S.-Y. Lin, “Meso-porous silica nanoparticles for drug delivery and biosensing applications,” Advanced Functional Materials, vol. 17, no. 8, pp. 1225–1236, 2007.
[2] S. Huh, J. W. Wiench, J.-C. Yoo, M. Pruski, and V. S.-Y. Lin, “Organic functionalization and morphology control of
mesoporous silicas via a co-condensation synthesis method,”
Chemistry of Materials, vol. 15, no. 22, pp. 4247–4256, 2003.
[3] B. G. Trewyn, C. M. Whitman, and V. S.-Y. Lin, “Morphological control of room-temperature ionic liquid templated meso-porous silica nanoparticles for controlled release of antibacterial agents,” Nano Letters, vol. 4, no. 11, pp. 2139–2143, 2004. [4] K. Suzuki, K. Ikari, and H. Imai, “Synthesis of silica
nanopar-ticles having a well-ordered mesostructure using a double surfactant system,” Journal of the American Chemical Society, vol. 126, no. 2, pp. 462–463, 2004.
[5] J. Y. Ying, “Design and synthesis of nanostructured catalysts,”
Chemical Engineering Science, vol. 61, no. 5, pp. 1540–1548, 2006.
[6] J. Y. Ying, C. P. Mehnert, and M. S. Wong, “A new type of metal-organic large-pore zeotype,” Angewandte Chemie, vol. 38, no. 1-2, pp. 153–156, 1999.
[7] C. T. Kresge, M. E. Leonowicz, W. J. Roth, J. C. Vartuli, and J. S. Beck, “Ordered mesoporous molecular sieves synthesized by a liquid-crystal template mechanism,” Nature, vol. 359, no. 6397, pp. 710–712, 1992.
[8] D. R. Radu, C.-Y. Lai, K. Jeftinija, E. W. Rowe, S. Jeftinija, and V. S.-Y. Lin, “A polyamidoamine dendrimer-capped mesoporous silica nanosphere-based gene transfection reagent,” Journal of
the American Chemical Society, vol. 126, no. 41, pp. 13216–13217,
2004.
[9] I. Slowing, B. G. Trewyn, and V. S. Y. Lin, “Effect of surface functionalization of MCM-41-type mesoporous silica nanopar-ticles on the endocytosis by human cancer cells,” Journal of the
American Chemical Society, vol. 128, no. 46, pp. 14792–14793,
2006.
[10] X. Zhao, R. A. P. Bagwe, and W. Tan, “Development of organic-dye-doped silica nanoparticles in a reverse microemulsion,”
Advanced Materials, vol. 16, no. 2, pp. 173–176, 2004.
[11] L. M. Rossi, L. Shi, F. H. Quina, and Z. Rosenzweig, “St¨ober synthesis of monodispersed luminescent silica nanoparticles for bioanalytical assays,” Langmuir, vol. 21, no. 10, pp. 4277–4280, 2005.
[12] S. Cousinie, L. Mauline, M. Gressier et al., “Bulk or surface grafted silylated Ru(II) complexes on silica as luminescent nanomaterials,” New Journal of Chemistry, vol. 36, no. 6, pp. 1355–1367, 2012.
[13] H. L. Handl and R. J. Gillies, “Lanthanide-based luminescent assays for ligand-receptor interactions,” Life Sciences, vol. 77, no. 4, pp. 361–371, 2005.
[14] D. Jin and J. A. Piper, “Time-gated luminescence microscopy allowing direct visual inspection of lanthanide-stained micro-organisms in background-free condition,” Analytical Chemistry, vol. 83, no. 6, pp. 2294–2300, 2011.
[15] L. Jiang, J. Wu, W. Guilan et al., “Development of a visible-light-sensitized europium complex for time-resolved fluorometric application,” Analytical Chemistry, vol. 82, no. 6, pp. 2529–2535, 2010.
[16] R. Connally, D. Jin, and J. Piper, “High intensity solid-state UV source for time-gated luminescence microscopy,” Cytometry
Part A, vol. 69, no. 9, pp. 1020–1027, 2006.
[17] Y. Bretonniere, M. J. Cann, D. Parker, and R. Slater, “Ratiometric probes for hydrogencarbonate analysis in intracellular or extra-cellular environments using europium luminescence,” Chemical
Communications, no. 17, pp. 1930–1931, 2002.
[18] J. Yu, D. Parker, R. Pal, R. A. Poole, and M. J. Cann, “A europium complex that selectively stains nucleoli of cells,” Journal of the
American Chemical Society, vol. 128, no. 7, pp. 2294–2299, 2006.
[19] R. Pal and D. Parker, “A single component ratiometric pH probe with long wavelength excitation of europium emission,”
Chemical Communications, no. 5, pp. 474–476, 2007.
[20] M. H. V. Werts, M. A. Duin, J. W. Hofstraat, and J. W. Verhoeven, “Bathochromicity of Michler’s ketone upon coordination with lanthanide(III)𝛽-diketonates enables efficient sensitisation of Eu3+for luminescence under visible light excitation,” Chemical
Communications, no. 9, pp. 799–800, 1999.
[21] C. Yang, L. M. Fu, Y. Wang et al., “a highly luminescent europium complex showing visible-light-sensitized red emis-sion: direct observation of the singlet pathway,” Angewandte
Chemie, vol. 43, no. 38, pp. 5010–5013, 2004.
[22] S. M. Borisov and O. S. Wolfbeis, “Temperature-sensitive europium(III) probes and their use for simultaneous lumines-cent sensing of temperature and oxygen,” Analytical Chemistry, vol. 78, no. 14, pp. 5094–5101, 2006.
[23] J. Wu, Z. Ye, G. Wang et al., “Visible-light-sensitized highly luminescent europium nanoparticles: preparation and appli-cation for time-gated luminescence bioimaging,” Journal of
Materials Chemistry, vol. 19, no. 9, pp. 1258–1264, 2009.
[24] S. V. Eliseeva, B. Song, C. D. B. Vandevyver, A.-S. Chauvin, J. B. Wacker, and J.-C. G. B¨unzli, “Increasing the efficiency of lan-thanide luminescent bioprobes: bioconjugated silica nanoparti-cles as markers for cancerous cells,” New Journal of Chemistry, vol. 34, no. 12, pp. 2915–2921, 2010.
[25] M. J. Li, Z. Chen, V. W. W. Yam, and Y. Zu, “Multifunctional ruthenium(II) polypyridine complex-based core-shell mag-netic silica nanocomposites: magnetism, luminescence, and electrochemiluminescence,” ACS Nano, vol. 2, no. 5, pp. 905– 912, 2008.
[26] H. R. Li, J. Lin, H. J. Zhang, L. S. Fu, Q. G. Meng, and S. B. Wang, “Preparation and luminescence properties of hybrid materials containing europium(III) complexes covalently bonded to a silica matrix,” Chemistry of Materials, vol. 14, no. 9, pp. 3651– 3655, 2002.
[27] L. A. Rocha, J. M. A. Caiut, Y. Messaddeq et al., “Non-leachable highly luminescent ordered mesoporous SiO2spherical parti-cles,” Nanotechnology, vol. 21, no. 15, Article ID 155603, 2010. [28] J. P. Duan, P. P. Dun, and C. H. Cheng, “Europium complexes
having an aminophenanthroline ligand as red dopants in electroluminescent devices,” AZojomo, vol. 1, 2005.
[29] J. K. F. B. Machado, A. L. Marc¸al, O. J. Lima, K. J. Ciuffi, E. J. Nassar, and P. S. Caleffi, “Materiais h´ıbridos orgˆanico-inorgˆanicos (ormosil) obtidos por sol-gel com potencial uso como filtro solar,” Qu´ımica Nova, vol. 34, no. 6, pp. 945–949, 2011.
[30] E. De Oliveira, C. R. Neri, O. A. Serra, and A. G. S. Padro, “Antenna effect in highly luminescent Eu3+anchored in hexag-onal mesoporous silica,” Chemistry of Materials, vol. 19, no. 22, pp. 5437–5442, 2007.
[31] L. R. Melby, N. J. Rose, E. Abramson, and J. C. Caris, “Synthesis and fluorescence of some trivalent lanthanide complexes,”
Journal of the American Chemical Society, vol. 86, no. 23, pp.
5117–5125, 1964.
[32] J. L. Yuan and K. Matsumoto, “A new tetradentate 𝛽-diketonate−europium chelate that can be covalently bound to proteins for time-resolved fluoroimmunoassay,” Analytical
Chemistry, vol. 70, no. 3, pp. 596–601, 1998.
[33] T. Mosmann, “Rapid colorimetric assay for cellular growth and survival: application to proliferation and cytotoxicity assays,”
Journal of Immunological Methods, vol. 65, no. 1-2, pp. 55–63,
Journal of Nanomaterials 11
[34] B. R. Brinkley, P. T. Beall, and L. J. Wible, “Variations in cell form and cytoskeleton in human breast carcinoma cells in vitro,”
Cancer Research, vol. 40, no. 9, pp. 3118–3129, 1980.
[35] Q. He, J. Zhang, J. Shi et al., “The effect of PEGylation of mesoporous silica nanoparticles on nonspecific binding of serum proteins and cellular responses,” Biomaterials, vol. 31, no. 6, pp. 1085–1092, 2010.
[36] D. A. Sheppard, C. F. Maitland, and C. E. Buckley, “Preliminary results of hydrogen adsorption and SAXS modelling of meso-porous silica: MCM-41,” Journal of Alloys and Compounds, vol. 404–406, pp. 405–408, 2005.
Submit your manuscripts at
http://www.hindawi.com
Scientifica
Hindawi Publishing Corporation
http://www.hindawi.com Volume 2014
Hindawi Publishing Corporation
http://www.hindawi.com Volume 2014 Hindawi Publishing Corporation
http://www.hindawi.com Volume 2014
Hindawi Publishing Corporation
http://www.hindawi.com Volume 2014
Ceramics
Journal ofHindawi Publishing Corporation
http://www.hindawi.com Volume 2014
Nanoparticles
Journal ofHindawi Publishing Corporation
http://www.hindawi.com Volume 2014
Hindawi Publishing Corporation
http://www.hindawi.com Volume 2014
International Journal of
Biomaterials
Hindawi Publishing Corporation
http://www.hindawi.com Volume 2014
Nanoscience
Journal ofTextiles
Hindawi Publishing Corporation
http://www.hindawi.com Volume 2014 Journal of
Hindawi Publishing Corporation
http://www.hindawi.com Volume 2014
Crystallography
Journal ofHindawi Publishing Corporation
http://www.hindawi.com Volume 2014
The Scientific
World Journal
Hindawi Publishing Corporationhttp://www.hindawi.com Volume 2014
Hindawi Publishing Corporation
http://www.hindawi.com Volume 2014
Coatings
Journal of Advances inMaterials Science and Engineering Hindawi Publishing Corporation
http://www.hindawi.com Volume 2014
Hindawi Publishing Corporation
http://www.hindawi.com Volume 2014
Hindawi Publishing Corporation
http://www.hindawi.com Volume 2014
Metallurgy
Journal ofHindawi Publishing Corporation
http://www.hindawi.com Volume 2014
BioMed
Research International
Materials
Journal ofHindawi Publishing Corporation
http://www.hindawi.com Volume 2014
N
a
no
ma
te
ria
ls
Hindawi Publishing Corporation
http://www.hindawi.com Volume 2014 Journal of