HAL Id: hal-01199330
https://hal.univ-reunion.fr/hal-01199330
Submitted on 14 Jun 2018HAL is a multi-disciplinary open access archive for the deposit and dissemination of sci-entific research documents, whether they are pub-lished or not. The documents may come from teaching and research institutions in France or abroad, or from public or private research centers.
L’archive ouverte pluridisciplinaire HAL, est destinée au dépôt et à la diffusion de documents scientifiques de niveau recherche, publiés ou non, émanant des établissements d’enseignement et de recherche français ou étrangers, des laboratoires publics ou privés.
Isolation and characterization of microsatellite markers
for Mimusops balata (Sapotaceae) and
cross-amplification in other Mimusops species
Stéphanie Dafreville, Claudia Baider, F. B. Vincent Florens, Gérard Lebreton,
Eric Rivière, Dominique Strasberg, Marie-Hélène Chevallier
To cite this version:
Stéphanie Dafreville, Claudia Baider, F. B. Vincent Florens, Gérard Lebreton, Eric Rivière, et al.. Isolation and characterization of microsatellite markers for Mimusops balata (Sapotaceae) and cross-amplification in other Mimusops species. Plants, MDPI, 2012, 1 (2), pp.100-105. �10.3390/plants1020100�. �hal-01199330�
plants
ISSN 2223-7747 www.mdpi.com/journal/plants
Short Note
Isolation and Characterization of Microsatellite Markers for
Mimusops balata (Sapotaceae) and Cross-Amplification in Other
Mimusops Species
Stéphanie Dafreville 1,*, Cláudia Baider 2, F. B. Vincent Florens 3, Gérard Lebreton 1, Eric Rivière 1, Dominique Strasberg 4 and Marie-Hélène Chevallier 1
1 CIRAD, UMR C53 PVBMT, Saint-Pierre 97410, La Réunion, France;
E-Mails: gerard.lebreton@cirad.fr (G.L.); riviere@cirad.fr (E.R.); marie-helene.chevallier@cirad.fr (M.-H.C.)
2 The Mauritius Herbarium, R. E. Vaughan Building, Agricultural Services, Ministry of
Agro-Industry and Food Security, Réduit, Mauritius; E-Mail: clbaider@gmail.com
3 Department of Biosciences, University of Mauritius, Réduit, Mauritius; E-Mail: v.florens@gmail.com 4 Université de la Réunion, UMR C53 PVBMT, Saint-Denis 97715, La Réunion, France;
E-Mail: umrc53@univ-reunion.fr
* Author to whom correspondence should be addressed; E-Mail: stephanie.dafreville@cirad.fr; Tel.: +262-262-499-213 (ext. 123); Fax: +262-262-499-295.
Received: 8 November 2012; in revised form: 6 December 2012 / Accepted: 11 December 2012 / Published: 17 December 2012
Abstract: Mimusops balata (Sapotaceae) is an endemic tree species from La Réunion and Mauritius. Like many species growing in lowland forests in La Réunion, it has suffered from human disturbances. We developed twelve microsatellite markers for M. balata and tested cross-amplification in five other Mimusops species to have powerful tools for genetic diversity studies. Genotyping peaks were of very low quality for two loci and were consequently abandoned for the genetic diversity analyses. Ten microsatellite loci were tested on 34 individuals of M. balata from two natural populations. The number of alleles per locus ranged from one to seven. The observed and expected heterozygosity levels varied from 0.000 to 0.823, and from 0.000 to 0.812 respectively. Two loci deviated from the Hardy-Weinberg equilibrium. The presence of null alleles was detected for one of these two loci. Nine to ten loci cross-amplified reliably in Mauritian species, for the other three species, four to six loci show successful amplifications. These polymorphic microsatellite
Plants 2012, 1 101
markers are now available for population genetic investigations in Mimusops species aiming to establish accurate guidelines for conservation managers.
Keywords: conservation genetics; genetic diversity; La Réunion; Mauritius; nuclear microsatellites
1. Introduction
La Réunion Island belongs to one of the thirty-four global biodiversity hotspots, where high concentration of endemism is undergoing severe loss of habitats [1]. Since the human colonization on the island, 70% of native vegetation have been destroyed or disturbed due to human activities [2]. Lowland forests have been particularly affected by anthropogenic disturbances like habitat destruction, forest fragmentation and logging. Preserving the last remnants of each habitat type on La Réunion is among the main conservation priority. To develop sustainable conservation plans, it is useful to assess information about the structure of genetic diversity and the patterns of gene flow between extant populations to reduce extinction risk [3].
Mimusops balata (Aubl.) C.F. Gaertn. (Sapotaceae) is one of the dominant endemic canopy trees
that evolved in lowland forests of Mauritius and La Réunion. Like most of Sapotaceae species occurring on the Mascarene Islands, M. balata has an important keystone structure role in these forests. Its natural distribution has been severely contracted and fragmented. Although M. balata remained relatively abundant in its habitat [4], investigating its genetic diversity and differentiation are essential to ensure the long-term survival of this species and its functional role in its ecosystem. Here we report the development and characterization of twelve microsatellite markers for M. balata from La Réunion Island.
2. Results and Discussion
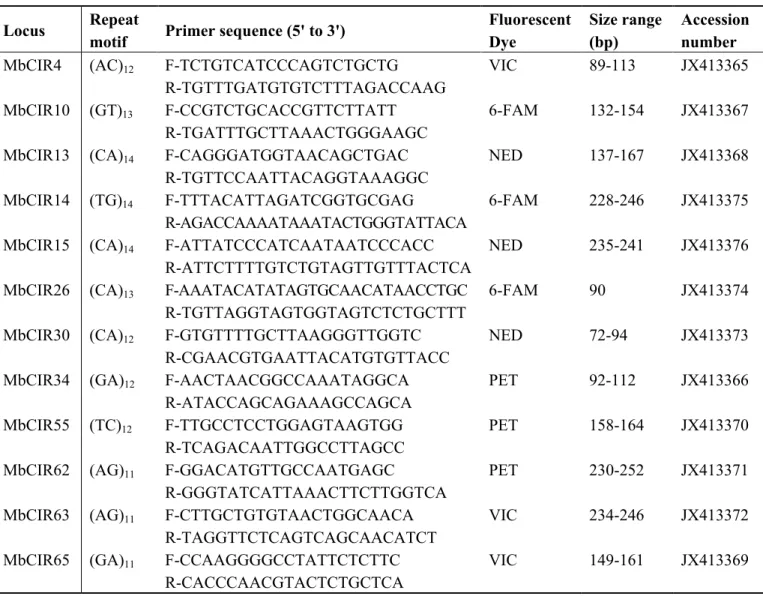
Twelve potential markers developed through 454 GS-FLX Titanium pyrosequencing were chosen to build a single primer mix for polymorphism analyses in the species M. balata. The characteristics of these twelve microsatellite loci are described in the Table 1. Genotyping peaks for the loci MbCIR26 and MbCIR15 were of low quality; allele assignment was therefore very difficult. So polymorphism analyses were not performed for these loci. The other ten markers were used to screen 34 individuals collected from two populations of M. balata (Les Makes and Sainte-Thérèse located respectively in the south-west and the south of La Réunion). The number of alleles per locus ranged from one to seven, with an average of 4.1 in Les Makes population and 4.5 in the Sainte-Thérèse population (Table 2). The observed and expected heterozygosities ranged from 0.000 to 0.823, and from 0.000 to 0.812 respectively. There was no evidence for linkage disequilibrium (p > 0.05) in any pair of loci. The locus MbCIR65 shows the lowest polymorphism levels. Two loci significantly deviated from Hardy-Weinberg equilibrium (MbCIR4, MbCIR30), suggesting the presence of null alleles, a Wahlund effect or an incomplete sample size. The presence of null alleles was confirmed at the locus MbCIR30.
Table 1. Characteristics of twelve microsatellite loci developed for the tree species
Mimusops balata.
Locus Repeat
motif Primer sequence (5' to 3')
Fluorescent Dye Size range (bp) Accession number MbCIR4 (AC)12 F-TCTGTCATCCCAGTCTGCTG VIC 89-113 JX413365
R-TGTTTGATGTGTCTTTAGACCAAG
MbCIR10 (GT)13 F-CCGTCTGCACCGTTCTTATT 6-FAM 132-154 JX413367
R-TGATTTGCTTAAACTGGGAAGC
MbCIR13 (CA)14 F-CAGGGATGGTAACAGCTGAC NED 137-167 JX413368
R-TGTTCCAATTACAGGTAAAGGC
MbCIR14 (TG)14 F-TTTACATTAGATCGGTGCGAG 6-FAM 228-246 JX413375
R-AGACCAAAATAAATACTGGGTATTACA
MbCIR15 (CA)14 F-ATTATCCCATCAATAATCCCACC NED 235-241 JX413376
R-ATTCTTTTGTCTGTAGTTGTTTACTCA
MbCIR26 (CA)13 F-AAATACATATAGTGCAACATAACCTGC 6-FAM 90 JX413374
R-TGTTAGGTAGTGGTAGTCTCTGCTTT
MbCIR30 (CA)12 F-GTGTTTTGCTTAAGGGTTGGTC NED 72-94 JX413373
R-CGAACGTGAATTACATGTGTTACC
MbCIR34 (GA)12 F-AACTAACGGCCAAATAGGCA PET 92-112 JX413366
R-ATACCAGCAGAAAGCCAGCA
MbCIR55 (TC)12 F-TTGCCTCCTGGAGTAAGTGG PET 158-164 JX413370
R-TCAGACAATTGGCCTTAGCC
MbCIR62 (AG)11 F-GGACATGTTGCCAATGAGC PET 230-252 JX413371
R-GGGTATCATTAAACTTCTTGGTCA
MbCIR63 (AG)11 F-CTTGCTGTGTAACTGGCAACA VIC 234-246 JX413372
R-TAGGTTCTCAGTCAGCAACATCT
MbCIR65 (GA)11 F-CCAAGGGGCCTATTCTCTTC VIC 149-161 JX413369
R-CACCCAACGTACTCTGCTCA
Table 2. Genetic diversity revealed by ten microsatellite loci in two natural populations of
Mimusops balata. N Number of individuals tested; NA Number of alleles detected; HO
Observed heterozygosity; HE Expected heterozygosity; Significant deviation from
Hardy-Weinberg equilibrium:* p < 0.05, *** p < 0.001.
Locus Les Makes (N = 17) Sainte-Thérèse (N = 17)
NA HO HE NA HO HE MbCIR4 7 0.625 0.812 * 7 0.588 0.708 MbCIR10 6 0.765 0.726 6 0.588 0.636 MbCIR13 6 0.588 0.710 6 0.471 0.456 MbCIR14 5 0.687 0.742 5 0.687 0.767 MbCIR30 4 0.294 0.614 * 3 0.000 0.581 *** MbCIR34 4 0.588 0.533 7 0.823 0.700 MbCIR55 2 0.471 0.426 2 0.529 0.485 MbCIR62 3 0.625 0.523 5 0.823 0.706 MbCIR63 3 0.375 0.329 2 0.118 0.114 MbCIR65 1 0.000 0.000 2 0.062 0.062
Plants 2012, 1 103
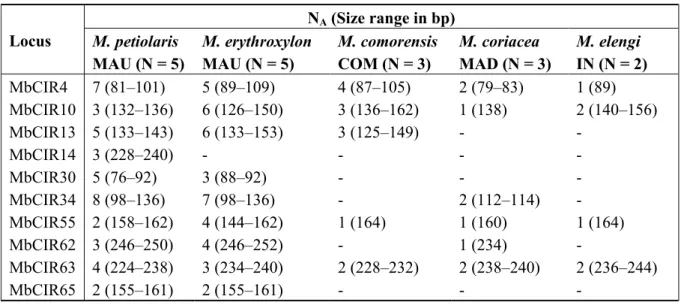
The twelve loci were tested for cross-amplification in five other Mimusops species (Table 3):
M. petiolaris (A.DC.) Dubard (MAU; N = 5), M. erythroxylon Bojer ex A.DC. (MAU; N = 5), M. comorensis Engl. (COM: Comoros; N = 3), M. coriacea (A.DC.) Miq. (MAD: Madagascar; N = 3), M. elengi L. (IN: India; N = 2). The genotyping peaks for MbCIR26 and MbCIR15 were of low
quality too. Nine to ten loci successfully amplified in Mauritian Mimusops suggesting that these species are more closely related to M. balata than the other species tested in our study for which only four to six loci were successfully transferred. The number of alleles detected with these markers in the congeneric species ranged from one to eight.
Table 3. Cross-species amplification of ten microsatellite markers developed for Mimusops
balata on species of the genus Mimusops. N: Number of individuals tested; NA: Number of
alleles detected; MAU: Mauritius; COM: Comoros; MAD: Madagascar; IN: India.
Locus NA (Size range in bp) M. petiolaris MAU (N = 5) M. erythroxylon MAU (N = 5) M. comorensis COM (N = 3) M. coriacea MAD (N = 3) M. elengi IN (N = 2) MbCIR4 7 (81–101) 5 (89–109) 4 (87–105) 2 (79–83) 1 (89) MbCIR10 3 (132–136) 6 (126–150) 3 (136–162) 1 (138) 2 (140–156) MbCIR13 5 (133–143) 6 (133–153) 3 (125–149) - - MbCIR14 3 (228–240) - - - - MbCIR30 5 (76–92) 3 (88–92) - - - MbCIR34 8 (98–136) 7 (98–136) - 2 (112–114) - MbCIR55 2 (158–162) 4 (144–162) 1 (164) 1 (160) 1 (164) MbCIR62 3 (246–250) 4 (246–252) - 1 (234) - MbCIR63 4 (224–238) 3 (234–240) 2 (228–232) 2 (238–240) 2 (236–244) MbCIR65 2 (155–161) 2 (155–161) - - - 3. Experimental Section
DNA was extracted from dried leaf tissue of five individuals of M. balata using the DNeasy Plant Mini Kit (Qiagen) and sent to GenoScreen, France [5]. Microsatellite-enriched libraries were developed through 454 GS-FLX Titanium pyrosequencing by the platform GenoScreen (Lille, France) as described in [6]. It was a rapid and low-cost opportunity to develop a library of specific nuclear microsatellite markers for M. balata. This technique allowed the identification of 955 potential markers. Twelve dinucleotide microsatellite loci were chosen to build a single primer mix containing 2 µM of each primer (Table 1) for multiplex amplifications. Levels of variation of the twelve microsatellite loci were evaluated among 34 individuals from two populations of M. balata: Les Makes (N = 17) and Sainte-Thérèse (N = 17). Multiplex PCR was performed in 15 µL reaction volumes containing 10–20 ng of genomic DNA, 7.5 µL of 2× Type-it Multiplex PCR Master Mix (Qiagen), and 0.2 µM of each primer (in each primer pair the forward primer was fluorescently labeled, see Table 1). PCR reactions were carried out in a GeneAmp PCR System 9700 thermalcycler (Applied Biosystems) with the following conditions: 5 min of denaturation at 95 °C, 28 cycles consisting of 30 s of denaturation at 95 °C, 90 s of annealing at 60 °C, and 30 s of extension at 72 °C, and a final extension at 60 °C for 30 min. One microliter of PCR products was combined with 10.7 µL deionized formamide and genotyping was
performed on an ABI PRISM 3130XL Genetic Analyser (Applied Biosystems), using 0.3 µL of Genescan AB500LIZ size standard (Applied Biosystems). Allele scoring was done using GENEMAPPER version 3.7 software (Applied Biosystems). The number of alleles, observed and expected heterozygosities and deviations from the Hardy-Weinberg equilibrium were calculated and tested with the software GENEPOP version 4.0 [7,8]. The linkage disequilibrium was tested using FSTAT version 2.9.3.2 [9,10] and the presence of null alleles was estimated by MICRO-CHECKER version 2.2.3 [11,12].
4. Conclusions
These results show the potential of these markers for investigating population genetic structure and diversity analyses throughout M. balata and closely related Mimusops species. Genetic diversity studies can generate helpful information for conservation managers that face the challenge of preserving biodiversity after severe human-induced disturbances.
Acknowledgments
The authors thank the “Office National des Forêts”, the “Parc National de la Réunion”, the “Conseil Général de la Réunion” and the “National Parks and Conservation Services” of Mauritius for the leaf collection permits. The “Région Réunion” and “CIRAD” supported this study.
References
1. Mittermeier, R.A.; Robles Gil, P.; Hoffman, M.; Pilgrim, J.; Brooks, T.; Mittermeier, C.G.; Lamoureux, J.; da Fonseca, G.A.B. Hotspots Revisited: Earth’s Biologically Richest and Most
Endangered Terrestrial Ecoregions; Conservation International: Washington, DC, USA, 2005; p. 392.
2. Strasberg, D.; Rouget, M.; Richardson, D.M.; Baret, S.; Dupont, J.; Cowling, R.M. An assessment of habitat diversity and transformation on La Réunion Island (Mascarene Islands, Indian Ocean) as a basis for identifying broad-scale conservation priorities. Biodivers. Conserv. 2005, 14, 3015–3032. 3. Frankham, R. Genetics and extinction. Biol. Conserv. 2005, 126, 131–140.
4. Florens, F.B.V.; Baider, C.; Martin, G.M.N.; Strasberg, D. Surviving 370 years of human impact: What remains of tree diversity and structure of the lowland wet forests of oceanic island Mauritius? Biodivers. Conserv. 2012, 21, 2139–2167.
5. GenoScreen Homepage. Available online: http://www.genoscreen.fr/ (accessed on 6 December 2012). 6. Malausa, T.; Gilles, A.; Meglécz, E.; Blanquart, H.; Duthoy, S.; Costedoat, C.; Dubut, V.; Pech, N.; Castagnone-Sereno, O.P.; Délye, C.; et al. High-throughput microsatellite isolation through 454 GS-FLX Titanium pyrosequencing of enriched DNA libraries. Mol. Ecol. Resour. 2011, 11, 638–644. 7. Raymond, M.; Rousset, F. GENEPOP (Version 1.2): Population genetics software for exact tests
and ecumenicism. J. Hered. 1995, 86, 248–249.
8. Genepop on the web. Available online: http://genepop.curtin.edu.au/ (accessed on 6 December 2012). 9. Goudet, J. FSTAT: A computer program to calculate F-statistics, version 1.2. J. Hered. 1995, 86,
Plants 2012, 1 105
10. FSTAT. Available online: http://www2.unil.ch/popgen/softwares/fstat.htm/ (accessed on 6 December 2012).
11. Van Oosterhout, C.; Hutchinson, W.F.; Wills, D.P.M.; Shipley, P. MICRO-CHECKER: Software for identifying and correcting genotyping errors in microsatellite data. Mol. Ecol. Notes 2004, 4, 535–538.
12. Microsatellite Data Checking Software. Available online: http://www.microchecker.hull.ac.uk/ (accessed on 6 December 2012).
© 2012 by the authors; licensee MDPI, Basel, Switzerland. This article is an open access article distributed under the terms and conditions of the Creative Commons Attribution license (http://creativecommons.org/licenses/by/3.0/).