HAL Id: hal-01630226
https://hal.archives-ouvertes.fr/hal-01630226
Submitted on 28 Nov 2017
HAL is a multi-disciplinary open access
archive for the deposit and dissemination of
sci-entific research documents, whether they are
pub-lished or not. The documents may come from
teaching and research institutions in France or
abroad, or from public or private research centers.
L’archive ouverte pluridisciplinaire HAL, est
destinée au dépôt et à la diffusion de documents
scientifiques de niveau recherche, publiés ou non,
émanant des établissements d’enseignement et de
recherche français ou étrangers, des laboratoires
publics ou privés.
Simulation Toolbox for Studying Energy Consumption
in Wired Networks
Anne-Cécile Orgerie, Betsegaw Lemma Amersho, Timothée Haudebourg,
Martin Quinson, Myriana Rifai, Dino Lopez Pacheco, Laurent Lefèvre
To cite this version:
Anne-Cécile Orgerie, Betsegaw Lemma Amersho, Timothée Haudebourg, Martin Quinson, Myriana
Rifai, et al.. Simulation Toolbox for Studying Energy Consumption in Wired Networks. CNSM:
International Conference on Network and Service Management, Nov 2017, Tokyo, Japan. pp.1-5.
�hal-01630226�
Simulation Toolbox for Studying Energy
Consumption in Wired Networks
Anne-C´ecile Orgerie
∗, Betsegaw Lemma Amersho
†, Timoth´ee Haudebourg
‡, Martin Quinson
‡,
Myriana Rifai
§, Dino Lopez Pacheco
§and Laurent Lef`evre
¶∗ CNRS, IRISA, Rennes, France – Email: [email protected]
† Universit´e Rennes 1, France & Aalto University, Finland – Email: [email protected] ‡ENS Rennes, IRISA, Rennes, France – Email: {timothee.haudebourg, martin.quinson}@ens-rennes.fr
§ Universit´e Nice Sophia Antipolis, I3S, France – Email: {mrifai, dino.lopez}@unice.fr ¶ Inria, LIP, ENS Lyon, University of Lyon, France – Email: [email protected]
Abstract—Networking infrastructures are considered to con-sume as much energy as terminal end-user equipment or data-centers. While energy consumption of wireless networks is a matter of concern since their beginning, it is not the case for wired networks as they do not rely on batteries, but on plugged equipment. Yet, facing growing consumption, energy-efficient techniques start to be implemented in wired networks. However, measuring the end-to-end energy consumption of wired networking infrastructures remains a real challenge for network operators and scientists. This article presents the ECOFEN (En-ergy Consumption mOdel For End-to-end Networks) framework which allows to support precise simulation of energy consumption of large-scale complex wired networks. The experimental valida-tion shows that Ecofen provides accurate energy consumpvalida-tion values.
Index Terms—Energy consumption, simulation, wired net-works, green device, ns3
I. INTRODUCTION
Networking infrastructures are considered to consume as much energy as terminal end-user equipment or data-centers [3]. But contrary to the two last families of consumers, networks can be very complex by nature with remote or legacy devices. Thus measuring end-to-end energy consump-tion of networking infrastructures can be unreachable or at least remains a real challenge for network operators and scientists. Simulation of energy consumption of networks is an alternative way in order to understand the energy impact of networking scenarios. This simulation approach has been widely studied in wireless open-source context where relevant devices are battery based and need to optimize their energy consumption [8], [11]. But such simulation frameworks ded-icated for energy usage of wired infrastructures are mainly designed by network operators for specific networks. Based on ns-2 simulator, the Ecofen framework (End-to-end energy Cost mOdel and simulator For Evaluating power consumption in large-scale Networks) has been proposed in 2011 [7]. In 2013, Ecofen, has been refined and re-designed for ns-3 [5] simulator, a discrete-event simulator for Internet systems, targeted primarily for research and educational use. Since then, Ecofen has been used by several research teams for studying various networking infrastructures. Ecofen has become a ma-ture framework able to simulate complex networking scenarios
in order to study energy consumption and energy leverages in networks.
The main goal of the Ecofen toolbox is to provide a simulating environment for large-scale wired networks where users can obtain the energy consumption of their new pro-tocols, algorithms and frameworks involving different types of technologies and equipment. It is endowed with several energy models, and several representative network devices are pre-defined using energy consumption values found in the literature.
The article is organized as follows. Section II presents the related works. Section III introduces the Ecofen model and simulator. Section IV analyzes a validation of the framework. Section V concludes and presents future work.
II. RELATED WORK AND CONTEXT
Several network simulators are available for studying and analyzing wired networks like OMNET++ discrete event sim-ulator [6] or the ns-* frameworks. One of the most famous network simulator is the ns-2 simulator [4]. Ns-2 is a discrete-event network simulator and has been widely employed to study several transport and network layer protocols over wired-and wireless-based networks. While the high popularity of ns-2 catalyzed the implementation of several protocol models, the simplicity of the implemented models might lead to results dif-ferent to the ones that would be obtained in real networks [2], [10]. This is the case for instance of the by-default TCP models in ns-2 and this is why a Linux-based code, known as the TCP-Linux ns-2 agent, has been implemented for instance.
To tackle the accuracy problems in the ns-2 results, the ns-3 network simulator has been developed [5]. Note that the ns-2 and the ns-3 simulators are incompatible. Ns-3 is a discrete-event network simulator, built as a C++ library which may be statically or dynamically linked to a C++ main program that defines the simulation topology and starts the simulator. In ns-3, the accuracy of the results are improved with the introduction of several Linux protocols implementations and kernel modules in its framework (e.g. the TCP/IP Linux implementation). Additionally, external Linux-based user-land tools can be plugged to the ns-3 simulator by means of the
ns-3-dce API. Hence, iperf or still Quagga can be used in ns-3 simulations.
III. THEECOFEN FRAMEWORK
This section describes the Ecofen features and implemen-tation. The Ecofen simulator has an architecture comprising three layers: energy models, green functions and network man-agement. The energy models define the energy consumption values for each device and thus the relation between energy consumption and traffic load. The green functions are energy-aware levers to enable devices to be put to sleep or to be completely turned off for example. They come with their own energy model (energy required to switch off an interface for instance).
The state-of-the-art services provide network-wide functions such as energy-aware routing protocols or network manage-ment algorithms. Such services are not yet implemanage-mented in Ecofen but can be added by users using the green functions (to switch off nodes for instance, or to get the energy consumption of each device).
The simulator provides energy consumption values at differ-ent levels: for the differ-entire studied network (to compare network-wide frameworks); for a given equipment (to compare node-level optimizations); for a given transfer or flow (to evaluate the cost of a service or a data transfer). It is implemented within the ns-3 network simulator, and can thus benefit from all the protocols already implemented in this simulator. A. Energy models
To model the energy consumption at a low level, the Ecofen simulator provides different energy models and dif-ferent energy profiles for several categories of devices. The consumption of each equipment is divided between the chassis consumption and the consumption of the interfaces (or ports). Different models are proposed for the interfaces and for the moment, only one model is proposed for the chassis. These models can be configured for each modeled device using measured values or values taken from literature. So, according to the values used for the ports and for the chassis, users can simulate Ethernet cards, routers, switches, etc. Currently in Ecofen, the ns-3 supported models include PointToPointNetDeviceand CsmaNetDevice for the net device models (interfaces), and Ipv4 and Ipv6 for the IP layer.
Currently, only one model is implemented for the nodes (chassis consumption). It allows users to specify an OnConso: the node’s power consumption (in Watts) when it is on, and an OffConso: the node’s power consumption when the node is switched off. These values can be put to 0 if required. Each node of the simulation has its own model (so nodes can use different power values within the same simulation).
Currently, three energy models are available for the net devices (per interface consumption):
• basic, that allows user to specify the OnConso (OffConso): the interface’s power consumption when it is on (respectively off).
• linear, that allows user to specify the OffConso
(IdleConso): the interface’s power consumption when it is off (respectively on but idle, i.e. no traffic), and a ByteEnergyvalue: the energy consumed per processed Byte (incoming or outgoing).
• complete, that allows user to specify OffConso (IdleConso): the interface’s power consumption when it is off (respectively on but idle); RecvByteEnergy (SentByteEnergy): the energy consumed per Byte received (respectively sent); and RecvPktEnergy: the energy consumed per packet received (respectively sent). The last model relies on the fact that the energy consump-tion of some interfaces depends on the traffic in two ways: it depends on the number of Bytes (because they need to be written in memory for instance), and it depends on the number of packets (because they need to be processed: reading the headers for instance) [9]. Table I summarizes the possible attributes per energy model, with the unit and the data format of each attribute.
TABLE I
ATTRIBUTES FOR EACH ENERGY MODEL
Model name Attribute name Expected units Format Node energy models
basic OnConso Watts double OffConso Watts double Net device energy models
basic OnConso Watts double OffConso Watts double linear IdleConso Watts double OffConso Watts double ByteEnergy nanoJoules per Byte double complete IdleConso Watts double OffConso Watts double RecvByteEnergy nanoJoules per Byte double SentByteEnergy nanoJoules per Byte double RecvPktEnergy nanoJoules per packet double SentPktEnergy nanoJoules per packet double
B. Green functions
The Ecofen simulator provides basic tools (or green func-tions) to design complex energy-efficient frameworks, proto-cols and algorithms that act at the network level. These basic tools are energy-efficient techniques that can be applied at the node level, currently on/off techniques, ALR and LPI [1]. The user is responsible to implement the coordination framework on top of these functions. For example, the simulator provides a function to switch off the devices, but the user has to determine when this function is used (e.g. autonomic decision or coordinated plan).
Ecofen enables to switch off ports. This functionality can be used to switch off unused ports or to simulate fail-ures. Switching on and off require time and energy. In the Ecofen simulator, these two parameters can be mod-ified by users. Ecofen provides several functions to the users: NetDeviceSwitchOff (NetDeviceSwitchOn) to switch off (respectively on) an interface at a given date;
LinkSwitchOff(LinkSwitchOff) to switch off (respec-tively on) a link at a given date.
Prior to use these functions, the user should precise an energy model to employ to switch on and off the interfaces. This model allows users to specify the en-ergy parameters that will be used to switch on and off interfaces: SwitchOffEnergy (SwitchOnEnergy): the total amount of energy needed to switch off (re-spectively on) the interface and SwitchOffDuration (SwitchOnDuration): the time needed to switch off (re-spectively on) the interface. A switch off interface cannot receive nor send traffic.
Along with interface switching functions, Ecofen pro-vides similar tools to switch on and off entire nodes: NodeSwitchOff(NodeSwitchOn) to switch off (respec-tively on) a node at a given date. Similarly to the interface model, for switching a node, the user should first define an energy model. When a node is switched off, all its interfaces are unreachable.
IV. VALIDATION
Both the linear and complete models can produce values of power consumption as a function of traffic. The basic model, on the other hand, produces power consumption values based on the ON or OFF state of a node, it does not consider network traffic. Therefore we describe the validation experiments for both the linear and the complete models in this section. The basic procedure for the validation experiment is first to simulate, using Ecofen, power consumption in response to traffic sent or received and then to compare the results against data obtained from literature where actual measurements are conducted.
A. Validating the Linear Model
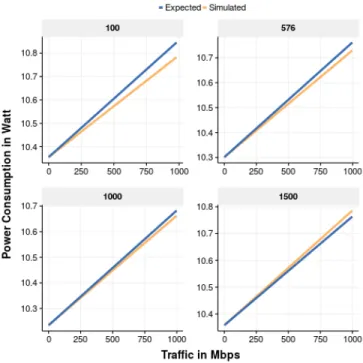
Sivaraman et al. [9] provide the results of power consump-tion experiments on real equipment. These experiments show the linear relationship that exists between traffic volume (in Mbps) and power consumption (in Watts) for fixed packet sizes of 100, 576, 1000, and 1500 Bytes. Furthermore, the linear fit equations for each of the packet size are also provided.
The authors’ intention in these experiments is to determine values of the per-byte and the per-packet processing energy consumption, however, our intention is to use the per-byte energy consumption value that they have experimentally deter-mined and to use it in Ecofen to get power consumption values for a given volume of traffic. We then compare the results we obtained with the linear fit models provided in [9]. In their experiments, the authors used three kinds of hardware devices: (1) NetFPGA router card that has four 1 Gbps Ethernet ports, (2) IXIA hardware traffic-generator for generating packets with the desired packet-size and data-rate, and (3) high-fidelity oscilloscope for measuring the power consumed by the NetFPGA card as a consequence of the packets send or received.
In this validation experiment we wish to simulate the exper-iments conducted by Sivaraman et al. as closely as possible.
Fig. 1. Power consumption vs data-rate comparison between expected (or measured) values (in blue) and simulated values (in yellow) for a fixed packet size of 100, 576, 1000, and 1500 Bytes.
With this in mind, we setup, in our ns-3 simulation script, a three node simple network with first and third nodes connected to the second node. All the three nodes are connected to each other by links that have maximum bandwidth capacity of 1 Gbps and delay of 10 ms.
For the generated traffic volume in the simulation, we used uniform random number generator provided by ns-3. Finally, each experiment was run 40 times, each time with a different value for the random number generator. The results obtained are depicted in Figure 1. In the graph the expected power consumption values from the linear fit models shown in [9] along with the simulated values for each of the packet sizes (100, 576, 1000, and 1500 bytes) are displayed.
Visually, the simulated and the expected values seem to agree very well, even though a gap draws between them as the data rate increases (specially true for the case of 100-bytes packet lengths). Hence, to better assess the accuracy of our results, we run unpaired t-test statistical test using the produced data. The summary of this test is shown in Table II. The 95% confidence interval values shown in Table II of difference in mean between the measured and simulated values are very close to zero and in fact zero is also one of the values. According to the P-values, the null hypothesis that the difference in mean between the simulated and the expected values is zero is not rejected.
The conclusion in this validation test is that the linear model of Ecofen is accurate in predicting the power consumed by NetFPGA router for a given volume of traffic.
TABLE II
UNPAIRED T-TEST RESULTS FOR SIMULATED AND MEASURED POWER
CONSUMPTION VALUES FORECOFEN’S LINEAR
Packet Size Confidence Interval of difference in mean Mean of Expected Mean of Simulated P-Value 100 [-0.027, 0.110] 10.640 10.599 0.230 576 [-0.039, 0.082] 10.544 10.523 0.480 1000 [-0.043, 0.073] 10.466 10.451 0.6131 1500 [-0.062, 0.048] 10.566 10.573 0.796
B. Validating the Complete Model
Roughly, in this validation experiment, we have used the same experimental configuration and procedure as that of the linear validation experiment that we have described in the previous section.
One of the main difference between the complete and the linear model of Ecofen is that the complete model distin-guishes between the received and sent bytes. Which means that different energy consumption values can be assigned to bytes based on the direction of transfer. The linear model, on the other hand, assigns same value for both. The other main difference is that the complete model considers the packet processing energy consumption cost both for the sent and received packets.
Sivaraman et al. [9] also conducted experiments to deter-mine energy consumption values for per-byte receive or trans-mit and per-packet processing. The experimentally determined values for per-byte receive is 1.3 nJ, for per-byte transmit is 2.1 nJ, and for per-packet processing is 197.2nJ.
1000 0 50 100 150 200 250 10.5 10.6 10.7 10.8 10.9 11.0 Traffic in Kilo PPS Power Consumption in W att Expected Simulated
Fig. 2. Power consumption vs data-rate comparison between expected (or measured) values (in blue) and simulated values (in yellow) for a fixed packet size of 1000 Bytes for the sending end
The results for the sending and receiving are shown in Figures 2 and 3, respectively.
Table III shows the unpaired t-test result for one packet-sizes in the transmitting side (Tx) and for two packet-packet-sizes in the receiving side (Rx).
Again in this case, the 95% confidence interval values shown in Table III of difference in mean between the measured and simulated values are very close to zero and in fact zero
Fig. 3. Power consumption vs data-rate comparison between expected (or measured) values (in blue) and simulated values (in yellow) for a fixed packet size of 576 and 1500 Bytes for the receiving end
TABLE III
UNPAIRED T-TEST RESULTS FOR SIMULATED AND MEASURED POWER
CONSUMPTION VALUES FORECOFEN’S COMPLETE MODEL
Packet Size End Confidence interval of difference in mean Mean of Ex-pected Mean of Sim-ulated P-Value 576 Rx [-0.067, 0.039] 10.770 10.784 0.598 1500 Rx [-0.010, 0.095] 10.778 10.736 0.114 1000 Tx [-0.096, 0.053] 10.750 10.773 0.560
is also one of the values. According to the P-values, the null hypothesis that the difference in mean between the measured and the simulated values is zero is not rejected.
The conclusion from this validation experiment is also the same as the previous one, the Ecofen’s complete energy consumption model accurately predicts power consumed by NetFPGA router for a given volume of sent or received traffic.
V. CONCLUSION
Studying and understanding the energy consumption of the network infrastructures can be very complex due to the presence of multiple forwarding devices and middle-boxes, potentially spread over multiple countries. Simulation tools are good candidates to study the energy consumption of networks. However, while multiple solutions exist to study the energy consumption in wireless networks (e.g. in 802.11 networks) through simulation, little attention has been put over wired networks.
The Ecofen model, proposed in this article, aims at filling the void of energy modeling in wired networks. Ecofen was initially designed to be integrated into the ns-2 simulator. Currently, we have redesigned and updated Ecofen to be integrated within the ns-3 network simulator. Since ns-3 is able to run native Linux code to provide results close to the real life, ns-3 with Ecofen is expected to provide valuable insights about the energy consumption of real networks and energy efficient protocols.
REFERENCES
[1] T. Haudebourg and A.-C. Orgerie, “On the Energy Efficiency of Sleeping and Rate Adaptation for Network Devices,” in International Conference on Algorithms and Architectures for Parallel Processing (ICA3PP), 2017.
[2] G. F. Lucio, M. Paredes-farrera, E. Jammeh, M. Fleury, and M. J. Reed, “Opnet modeler and ns-2: Comparing the accuracy of network simulators for packet-level analysis using a network testbed,” in In 3rd WEAS International Conference on Simulation, Modelling and Optimization (ICOSMO), 2003, pp. 700–707.
[3] Nokia, “Global what-if analyzer of network energy consumption,” http: //gwatt.net, 2016.
[4] ns-2. [Online]. Available: https://www.isi.edu/nsnam/ns/
[5] ns3 network simulator. [Online]. Available: http://www.nsnam.org/ ns-3-11/
[6] OMNeT++ Discrete Event Simulator. [Online]. Available: https: //omnetpp.org/
[7] A.-C. Orgerie, L. Lef`evre, I. Gu´erin-Lassous, and D. Lopez Pacheco, “Ecofen: an end-to-end energy cost model and simulator for evaluating power consumption in large-scale networks,” in SustaInet: First Interna-tional Workshop on Sustainable Internet and Internet for Sustainability (in conjunction with WoWMoM), 2011.
[8] P. Serrano, A. Garcia-Saavedra, G. Bianchi, A. Banchs, and A. Azcorra, “Per-Frame Energy Consumption in 802.11 Devices and Its Implication on Modeling and Design,” IEEE/ACM Transactions on Networking, vol. 23, no. 4, pp. 1243–1256, 2015.
[9] V. Sivaraman, A. Vishwanath, Z. Zhao, and C. Russell, “Profiling per-packet and per-byte energy consumption in the NetFPGA Gigabit router,” in 2011 Conference on Computer Communications Workshops (INFOCOM Workshops), 2011, pp. 331–336.
[10] D. X. Wei and P. Cao, “Ns-2 tcp-linux: An ns-2 tcp implementation with congestion control algorithms from linux,” in Proceeding from the 2006 Workshop on Ns-2: The IP Network Simulator, ser. WNS2 ’06. New York, NY, USA: ACM, 2006. [Online]. Available: http://doi.acm.org/10.1145/1190455.1190463
[11] H. Wu, S. Nabar, and R. Poovendran, “An Energy Framework for the Network Simulator 3 (NS-3),” in International ICST Conference on Simulation Tools and Techniques (SIMUTools), 2011, pp. 222–230.