HAL Id: cea-02428833
https://hal-cea.archives-ouvertes.fr/cea-02428833
Submitted on 6 Jan 2020
HAL is a multi-disciplinary open access
archive for the deposit and dissemination of
sci-entific research documents, whether they are
pub-lished or not. The documents may come from
teaching and research institutions in France or
abroad, or from public or private research centers.
L’archive ouverte pluridisciplinaire HAL, est
destinée au dépôt et à la diffusion de documents
scientifiques de niveau recherche, publiés ou non,
émanant des établissements d’enseignement et de
recherche français ou étrangers, des laboratoires
publics ou privés.
Laser induced breakdown spectroscopy application in
joint European torus
A. Semerok, D. l’Hermite, J.-M. Weulersse, J.-L. Lacour, G. Cheymol, M.
Kempenaars, N. Bekris, C. Grisolia
To cite this version:
A. Semerok, D. l’Hermite, J.-M. Weulersse, J.-L. Lacour, G. Cheymol, et al.. Laser induced breakdown
spectroscopy application in joint European torus. Spectrochimica Acta Part B: Atomic Spectroscopy,
Elsevier, 2016, 123, pp.121-128. �10.1016/j.sab.2016.08.007�. �cea-02428833�
Laser induced breakdown spectroscopy application in joint
European torus
☆
A. Semerok
a,⁎
, D. L'Hermite
b, J.-M. Weulersse
a, J.-L. Lacour
b, G. Cheymol
a, M. Kempenaars
c,
N. Bekris
d, C. Grisolia
ea
CEA Saclay, DEN/DPC/SEARS/LISL, P.C. 56, 91191 Gif sur Yvette, Cedex, France
b
CEA Saclay, DEN/DPC/SEARS/LANIE, P.C. 56, 91191 Gif sur Yvette, Cedex, France
c
EURATOM/CCFE Fusion Association, Culham Science Centre, Abingdon, OX14 3DB, United Kingdom
d
EUROfus Program Management Unit PMU, ITER Phys Dept, Culham Sci Ctr, Abingdon OX14 3DB, Oxon, United Kingdom
eCEA Cadarache, IRFM/DIR, 13108 St Paul lez Durance, Cedex, France
a b s t r a c t
a r t i c l e i n f o
Article history: Received 15 January 2016
Received in revised form 3 August 2016 Accepted 5 August 2016
Available online 8 August 2016
The results on thefirst successful application of Laser Induced Breakdown Spectroscopy (LIBS) for remote in situ diagnostics of plasma facing components (a deposited layer on a divertor tile) in Joint European Torus (JET) are presented. The studies were performed with an available JET EDGE LIDAR laser system. For in-depth analysis of deposited layers on JET divertor tiles, a number of laser shots were applied onto the same divertor place without laser beam displacement. The spectral lines of D, CII and impurity elements (CrI, BeII,…) were identified in a wide spectral range (400–670 nm). With the increase in a number of laser shots applied onto the same divertor place, we observed consecutive changes in spectral line intensities of deuterium, carbon, and impurities with the ap-pearance of spectral lines of tungsten substrate (WI). In-depth analysis of deposited layers on JET divertor tiles was made on the basis of the spectral line behaviour in reference to the applied laser shots. The possibility of sur-face cartography with laser beam displacement on the tile sursur-face was demonstrated as well. Based on the results obtained, we may conclude that LIBS method is applicable for in situ remote analysis of deposited layers of JET plasma facing components.
© 2016 Elsevier B.V. All rights reserved.
Keywords: Tritium retention Deposited layer LIBS JET ITER 1. Introduction
Tritium retention on plasma facing components (PFC), such as divertors, antennas, chamber walls, etc., is seen as a very serious problem for a proper and safe operation of thermonuclear installations
[1–3]. Tritium cartography is required to determine tritium overall con-tent for consecutive detritiation. Two main types of tritium deposition and retention in tokamak thermonuclear installations may be described as follows. Thefirst one is hydrogen isotopes trapping on plasma facing walls of a vacuum chamber by its implantation and diffusion on approx-imately 10 nm depth, while the second one is hydrogen isotopes co-de-position on PFC of a vacuum chamber with an eroded wall material resulted in formation of deposited layers (DL). It was revealed that in to-kamak installations, the hydrogen isotopes are mostly trapped in the deposit of the second type (graphite DL with a thickness up to 100μm
for divertor tiles)[4]. Such thick DL are generally friable (porous) and inhomogeneous with hydrogen atomic content (up to 50%) and other impurities (lower than 1%) resulted from PFC erosion. Friable DL are the source of the dusts which may perturb fusion plasma parameters and reduce thermo-fusion efficiency. Thus, it is very important to search for an adequate method for remote and in situ characterisation and control of DL on PFC.
Laser methods for tokamak surface characterisation were under in-tensive investigations[5–28]. They were aimed to study in situ diagnos-tics in tokamaks with a particular interest in realisation and test of LIBS design. Our laboratory LIBS experiments with different DL were also aimed to study how quantitative data from LIBS signal and its evolution may be extracted. The studies were made in CEA, France within the frames of EFDA programs and ITER project[5–11]. Feasibility of LIBS re-mote measurements was demonstrated with nanosecond Nd-YAG la-sers (at 5–10 m distance, under a reduced pressure) with the samples from the European tokamaks (TORE SUPRA, France and TEXTOR, Ger-many) and with ITER-like samples. The laboratory results have demon-strated possibility to distinguish DL from a graphite or metal substrate, at least on the bench. In addition, based on the comparison of evolution of carbon, hydrogen and impurities spectral lines versus the ablated ☆ Selected Paper from the 8th Euro-Mediterranean Symposium on Laser Induced
Breakdown Spectroscopy (EMSLIBS 2015), Linz, Austria, 14-18 September 2015. ⁎ Corresponding author.
E-mail address:alexandre.semerok@cea.fr(A. Semerok).
http://dx.doi.org/10.1016/j.sab.2016.08.007 0584-8547/© 2016 Elsevier B.V. All rights reserved.
Contents lists available atScienceDirect
Spectrochimica Acta Part B
j o u r n a l h o m e p a g e :w w w . e l s e v i e r . c o m / l o c a t e / s a bdepth, it was possible to get information on both composition and thick-ness of a DL.
For further development of LIBS and in situ application of this meth-od in a future ITER, it is quite important to obtain a DL in-depth charac-terisation (composition and elemental in-depth distribution), surface cartography, and to determine analytical spectral lines and their proper-ties (lifetime, intensiproper-ties) under real conditions of a thermonuclear in-stallation. The content of Be atoms as a major element of a future ITER installation (vacuum chamber walls) is of a special analytical interest.
In this paper, we present the results of our study on LIBS method fea-sibility for in situ analysis of DL from Joint European Torus (JET). JET is the biggest European thermonuclear installation of TOKAMAK type (2.96 m major radius, 1.25–2.10 m minor horisontal and vertical radii, 100 m3plasma volume, in operation since 1984). It is necessary to point out that JET parameters and those of the future ITER are quite sim-ilar. JET deposited layer composition and properties may be regarded as very representative to those expected in the ITER (Be and W content). Plasma fusion experiments were performed with D/H/He plasmas (10−8Bars high vacuum, 3.45 T toroidal magneticfield) with Be-atoms (Be-powder) injected in the vacuum chamber for chemical neutralisation of the residual oxygen. LIBS measurements were performed with the JET EDGE LIDAR laser system.
To determine the optimal regime of our specific JET in situ measure-ments, preliminary laboratory LIBS studies (on laser/target interaction regime, collection optics, optical spectrometer features, ICCD-camera and detection regime, analytical wavelengths and spectral line intensi-ties) were made with the tiles from TEXTOR (Jülich, Germany) and TORE Supra (Cadarache, France) tokamaks and with ITER-like samples
[5–11]. The laboratory LIBS studies were made with the installation de-veloped earlier in CEA for the Mars surface analysis (the NASA Mars Rover Curiosity mission, within the ChemCam project[29–31]). The de-veloped installation was applicable for our laboratory studies as specific conditions for LIBS application in JET and those for the Mars surface analysis are quite similar (remote measurements, reduced pressure, un-known sample properties).
This paper presents the results on thefirst successful application of in situ LIBS analyses in JET. The results may be considered as very prom-ising for in situ remote diagnostics of PFC in JET. This is especially true for the cases when a laser beam is targeted at the inner leg of the divertor where heavy deposition is observed. The EDGE LIDAR laser and its collection optics may be used for LIBS measurements. Though any application of new diagnostics on JET seems to be a tough challeng-ing task, we have the reasons to believe that LIBS analyses performed with the EDGE LIDAR laser system mayfind their application for in situ remote diagnostics of PFC in JET. LIBS-method may also be applica-ble for other thermonuclear installations (WEST, ITER).
2. Experiments
Remote LIBS measurements were performed in JET when plasma and magneticfield were shut off. In the JET design of a vacuum chamber, the optical window (125 mm diameter) had limited apertures. The col-lection distance from the target (divertor tile) to the window was 5.36 m. LIBS spectrometer was at approximately 7 m from the optical window. Thus, the total distance of remote measurements wasN10 m. High vacuum environment (10−8Bar) in the zone of the analysis and a long collection distance from the laser plasma to collection optics were the particular features of these LIBS measurements in JET.
LIBS analyses were performed on a graphite divertor tile with a W-stripe (20 mm × 142 mm). The deposit on the W-W-stripe was formed after a certain number of JET fusion plasma shots with D/H/He mixture. The main deposit components were carbon sputtered from the graphite tiles and hydrogen isotopes used for tokamak fusion plasma (94% deu-terium, 5% hydrogen, and 1% He). The possible impurity content in the deposits was supposed as Fe, Cr, Be and other elements associated with the erosion of the PFC materials of a known composition. However,
neither the layer thickness, nor the elemental in-depth and surface dis-tributions were known. Thus, the sample under study may be described as a W-stripe with D/H/He and C deposit (with Be and other elements as impurities) of unknown thickness. Generally, the DL thickness is about 10–100 μm.
LIBS studies were performed with JET EDGE LIDAR laser system de-signed for plasma temperature measurements by the Thomson scatter-ing. It comprised a Ruby laser with the following parameters: 3 ± 0.5 J per pulse energy, 690 nm wavelength, 300 ps pulse duration, a near Gaussian beam, a very low repetition rate of 1 shot per 5 min[32]. Laser beam was focused inside the vacuum chamber and reached the divertor tile with the spot of 15–20 mm diameter. In such a case, the laserfluence on the tile was about 1 J/cm2(3 GW/cm2laser beam inten-sity), which was not sufficient to create a bright LIBS plasma and to ob-serve any spectral lines emission. To increase the laser beam intensity for our LIBS experiments, the optical scheme of the EDGE LIDAR system was slightly modified without upsetting the operation of the whole sys-tem. An additional divergent lens (20 m focal length) was used tofix the laser beam focal point on the divertor tile surface with the spot of d = 4 mm diameter, thus allowing us to increase the laser intensity up to 80 GW/cm2, which was sufficient to create the bright laser plasma and to ablate the DL by consecutive pulses. The lens parameters and its po-sition were determined by exhaustive calculations. He-Ne alignment laser (coaxial to the Ruby one) was visible on a control camera used to monitor laser beam displacement on the tiles surface.
2.1. Spectrometer choice
As hydrogen isotope content comprised 94% of deuterium (D) and only 5% of hydrogen (H), the hydrogen isotope spectral line resolution was of minor importance in our study. To optimize the signal/noise ratio and to distinguish LIBS spectral lines, a spectrometer with high col-lection efficiency and moderate spectral resolution (≥2000:1) is re-quired for remote measurements without isotope resolution. With this consideration in mind, we have chosen a spectrometer ANDOR Sham-rock SR-303i with a large numerical aperture f/4 (as an advantage in our case) and 303 mm focal length, but with a narrow working spectral range of 22 nm (as an inevitable disadvantage). The spectral resolution could be varied very easily by setting one of three available gratings (300 l/mm, 1800 l/mm, and 2400 l/mm) and by adjustment of the spec-trometer entrance slit width (50–500 μm). We applied a 1800 l/mm grating blazed at 520 nm. A 200μm slit width was chosen for reliable detection of LIBS signals (spectral lines) in the visible spectral range with≈0.3 nm spectral resolution. It should be noted that for the spec-trometer used in our studies, we have observed a certain asymmetry of the spectral lines in 630–660 nm spectral range which resulted in the deformation of the spectral shape of Dαline (656 nm). Taking into account that the spectrometer was rented solely for the JET experi-ments, the particular feature of this asymmetry and the reason of its ap-pearance was disregarded.
2.2. Optical detector choice
To decide between EMCCD and ICCD camera available for ANDOR Shamrock spectrometers, our considerations were as follows. EMCCD for detection of a lowflux of photons has an advantage of a slightly bet-ter signal/noise ratio, but the difference is less than a factor of two. With ICCD camera (13.5μm pixel size), the loss of spectral resolution was not important for our experiments. In addition, with ICCD camera, we could use the time gating which provides the possibility of temporal resolu-tion of the spectrum and a direct (without opticalfilters) spectral anal-ysis near the laser beam wavelength. Photon counting may be used for a very low signal. Thus, ICCD camera was preferred for our experiments. The camera comprised an intensifier with multi-channel plates (MCP) of 18 mm diameter. The intensifier was trigged by a delay generator which itself was triggered by an electric signal from the nearby Ruby
laser. The triggering signal from laser arrived 50 ns prior to the light from the LIBS plasma.
The ICCD may be calibrated at a low photonflux. From the spectrum recorded with a short time gate, we can count the electrons emitted by the photo cathode and measure the signal in terms of counts × pixels. Each electron generates about 2 counts × pixels with MCP gain of 25 and 23 counts × pixels with MCP gain of 100.
2.3. Collection system
One of six lenses (125 mm diameter) of the available EDGE LIDAR collecting system was used for light collection. With LIBS optical scheme, it was possible to image the laser plasma plume at the entrance of ANDOR Shamrock SR-303i spectrometer with the total 1/12× magni-fication. We were able to image it with the spectrometer ICCD camera by using the grating at a zero order. The plasma plume size on the en-trance of the LIBS spectrometer was of 1.06 mm (FWHM). Thus, the es-timated plasma plume diameter (∅) was about 12.7 mm. The numerical aperture of the collection system was 1/43 (125 mm diameter lens at 5.36 m). With the total 1/12 × magnification, the resulting numerical aperture of the collection optics was 1/3.6 whichfitted quite well a 1/ 4 numerical aperture of the spectrometer for efficient light collection. 2.4. Alignment procedure
The optical scheme for collection optics alignment is presented in
Fig. 1. With a sliding mirror (M5) positioned at the spectrometer en-trance, it was possible to provide the alignment by auto collimation of the second He-Ne laser (installed on the bench). The laser beam was set parallel to the spectrometer axis to allow its pass in the centre of the slit and then near the centre of lenses and mirrors. A mirror (M1) was then positioned and oriented in such a way that the alignment He-Ne beam was allowed to follow the EDGE LIDAR optical collection path. The spot of the He-Ne beam on the tile could be easily observed on the monitor of the JET camera. Then the alignment procedure was continued to move and rotate a mirror (M2) to superpose this spot on the one of the alignment beam of the EDGE LIDAR laser. Some rotations of both mirrors (M1 and M2) were necessary. The above procedure with 200–500 μm spectrometer slit width has always resulted in a good LIBS signal. The position of the plasma image at the spectrometer entrance was controlled and checked with the spectrometer in a zero order of grating. While moving the EDGE LIDAR laser spot on the tile (for surface cartography), the EDGE LIDAR collection system was realigned by mov-ing the He-Ne spot on the one of EDGE LIDAR alignment lasers. An opaque protective material to cover the measuring devices was used during all manipulation procedures of our experiments.
3. Experimental results
The detection regime was adjusted by varying the spectrometer and ICCD camera in their parameters ranges: spectrometer slit width (50– 500μm), ICCD camera delay (180–680 ns), ICCD camera gate width (2–10 μs) and MCP gain (25–250). With the adjusted detection param-eters (200μm spectrometer slit width, 180 ns ICCD camera delay, and 25 or 100 MCP gain), we observed the spectra with well resolved spec-tral lines of a high intensity and without saturation. The ICCD camera gate width did not affect the spectra. It was chosen as 10μs to make sure that all photons from the spectral lines with different lifetimes have been detected. Registration tests were made with a laser pulse en-ergy E = 3.2 ± 0.5 J following each laser shot (nth) in a set of consecu-tive laser shots (up to ten on the selected zone). The registration was made on the divertor surface with a DL on the W-stripe.Fig. 2presents the examples of LIBS spectra with Dα, Dβand Dγdeuterium atoms tral lines registered after optimisation of the ICCD camera and spec-trometer parameters.
LIBS in-depth characterisation of a virgin DL on the W-stripe was made in two neighbouring zones (zone 1 and 2, being 10 mm distance apart).
For zone 1, ten laser shots were made onto the same divertor surface without laser beam displacement. Each spectrum was registered follow-ing each laser shot. For in-depth characterisation, the spectral range of 425–440 nm with the spectral lines of Dγ, CII, CrI, and BeII was used (Fig. 2c). With the increase in the number of laser shots without the laser displacement, the deuterium line intensity was decreasing with the appearance of tungsten (WI) spectral lines with the 5th–6th laser shot (Figs. 3 and 4). The spectral line intensities of the impurities (Cr, Be) were decreasing somewhat slower.
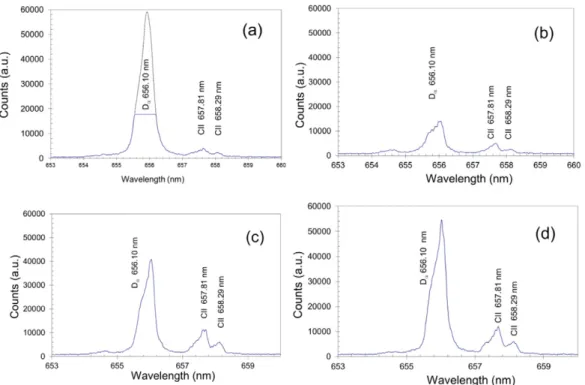
For LIBS in-depth characterisation of a virgin DL on the W-stripe on zone 2 (at≈10 mm distance from zone 1), a set of only four consecutive laser shots was made. This was associated with the necessity to respect rigid time limitations authorized for our experiments. The spectrum registration procedure was the same as for zone 1 - each spectrum was registered following each laser shot onto the same divertor surface (without laser beam displacement). The spectral range of 650–660 nm with the spectral lines of Dαand CII was used (Fig. 2a). LIBS spectra of deuterium and carbon after the 1st - 4th laser shot are presented on
Fig. 5(a-d, respectively). Saturated Dαspectral line from the 1st laser shot (Fig. 5a) was approximated byfitting the typical spectral broaden-ing profiles of Dαlines of non-saturated signals. The obtained deuterium and carbon in-depth distributions are presented inFig. 6.
In LIBS application for tritium inventory, the determination of life-time of hydrogen isotope spectral line was of high interest. The lifelife-time of deuterium Dαspectral line (656 nm) was determined experimentally by detection of the line intensity at different ICCD camera delays (180 ns, 380 ns, 780 ns, and 2180 ns) with 10μs gate width. Spectral line behaviour with the time delay was obtained by subtracting consec-utive Dαspectra (Dαspectral line amplitudes in our case). The obtained
Plasma
plume
image
plane
f
2=100mm
M1
M2
M3
M4
M5
W1
LIBS
Spectrometer
ICCD
Entrance
slit
Entranc
f
1=600mm
Fig. 1. Optical scheme for collection optics alignment. M1M4 reflecting mirrors, M5 -sliding mirror, W1 - semi-transparent mirror, f1and f2- lenses.
Dαspectral line evolution was decreasing with the time delay (Fig. 7, solid line rectangulars). From this spectral line behaviour, it was possi-ble to derive Dαlifetime asτ = 700 ± 100 ns.
Table 1presents LIBS spectral lines obtained for 360–665 nm spec-tral range. Solely intensive and well distinguished specspec-tral lines are pre-sented. Spectral line reference data are taken from[33].
4. Discussion
Our investigations were aimed to study feasibility of in situ LIBS ap-plication in JET. Significant efforts were made to optimize the design and measuring features of the available JET EDGE LIDAR detection
system to characterize a DL on JET divertor by LIBS analytical method. For our LIBS measurements in JET, it was necessary to satisfy rigid limi-tations imposed by the JET authorities. They were as follows: a limited 5-day period was allowed for LIBS experiments (including installation, adjustment, and measurements); LIBS optical scheme insertion should not upset the operation of the EDGE LIDAR diagnostics scheme; the tar-get (the zone under analysis) was in vacuum chamber at 5 m distance from the vacuum chamber optical window and without an access for operator. In addition to these limitations and difficulties, we should also mention that in the available EDGE LIDAR system, the laser beam is focalized not on the divertor tiles, but rather on the fusion plasma. This particular feature of the system results in the limited intensity on the target (divertor tile) which was not enough for LIBS analyses. In our previous experiments in JET, it was revealed that a large laser spot (15–20 mm diameter) does not create any detectable LIBS signal. To Fig. 2. The examples of LIBS spectra obtained from DL on the JET divertor tile with the laser pulse energy (E = 3.2 ± 0.5 J) and with the optimal set of registration parameters: 200μm spectrometer slit width, 180 ns ICCD camera delay, 10μs gate width, vacuum. (a) E = 3.0 J, MCP gain = 25, after 1st laser shot, (b) E = 3.3 J, MCP gain = 100, after 5th laser shot, (c) E = 3.0 J, MCP gain = 100, after 1st laser shot.
Fig. 3. LIBS spectrum after the 1st (solid curve) and 10th laser shot (pointed curve) on the W-stripe zone with the DL in zone 1 (laser pulse energy E = 3.2 ± 0.5 J, 200μm spectrometer slit width, 1800 mm−1grating, 180 ns ICCD camera delay, 10μs gate width, MCP gain = 25, vacuum).
Fig. 4. In-depth characterisation of the DL (zone 1). Dγ, WI, BeII, CII and CrI spectral line
increase the laser beam intensity and to make it sufficient for our LIBS measurements, an additional corrective lens with pre-calculated pa-rameters was installed without upsetting the optical scheme of EDGE LIDAR system.
The analysis of deuterium spectral lines (Fig. 2) has revealed that the Stark line broadening was comparable with the spectrometer resolution (0.45 nm and 0.30 nm for 656 nm and 434 nm deuterium wavelengths, respectively). For the spectral transitions of other elements (C, W, Be), we observed that their spectral line broadening was lower than the spectrometer resolution and Dαbroadening.Table 1presents wave-lengths and intensities for the well resolved spectral lines registered in our study. This data may be of interest for future LIBS application for JET and ITER deposited layer characterisation and for tritium in situ inventory.
FromFig. 4, one can see that the spectra registered on the same zone following shot-to-shot laser ablation have revealed a non-homoge-neous deuterium depth distribution in the DL. The obtained in-depth distribution of such elements as H, C (the major elements) and impurities is not very pronounced and not sharp. This result is also
valid for tungsten (that is, the layer substrate). This can be associated with the Gaussian laser beam intensity distribution and with the con-secutive non homogeneous in-depth ablation which is more rapid for the central zone with higher laser intensity[8]. One should note that transportation of a top-hat laser beam for remote measurements (10 m distance, in our case) is not possible. To improve in-depth resolu-tion and to provide a more homogeneous laser in-depth ablaresolu-tion with reduced thermal perturbation of hydrogen distribution, LIBS-analysis with ultrashort double pulses may be advised[34–36].
FromFigs. 4 and 6, one can see that the spectra registered on the neighbouring zones 1 and 2 (10 mm apart) on the DL have revealed a quite similar in-depth distribution of (D) and (C) for both the zones. Thus, the surface distribution of the deposit may be supposed as suf fi-ciently homogeneous (at least, on the 10 mm scale).
The results obtained on LIBS-application for DL characterisation on the neighbouring zones may be regarded as a good demonstration of the possibility to make not solely in-depth analysis, but also rapid sur-face cartography measurements. Rapid cartography should be regarded as obligatory for LIBS-diagnostics for JET and ITER safe operation. Thus, Fig. 5. LIBS spectrum of deuterium and carbon in zone 2 after the 1st (a), 2nd (b), 3rd (c) and 4th (d) laser shot on the W-stripe zone with the DL (200μm spectrometer slit width, 1800 mm−1grating, 180 ns ICCD camera delay, 10μs gate width, MCP gain = 100, vacuum). Laser pulse energy E = 2.9 J (a), 3.0 J (b), 3.5 J (c) and 3.8 J (d). Spectral line asymmetry is related with the spectrometer particular feature on the spectral range of 630–660 nm.
0 5 10 15 20 0 1 2 3 4 5 Line intensity (a.u.) Shot number
D
C
Fig. 6. In-depth characterisation of the DL for zone 2. Dαand CII spectral line intensities are
presented as a function of a number of applied laser shots.
Fig. 7. Dαspectral line (656 nm) decrease with the time delay (solid line rectangulars). An
approximation of Dαspectral line exponential decrease for the time delay derives
an optical design without necessity of additional adjustment of optical collection of a laser beam following its displacement on the tested sur-face is required.
We should stress that LIBS-method feasibility has been demonstrated for solely qualitative characterisation of the layer under extremely severe environmental conditions of JET experiments. Neither a DL thickness, nor its elemental content may be deduced from the obtained results. For DL thickness measurements, a laser ablation rate should be determined. Nu-merous intensive studies on tokamak DL ablation and reference database creation are required to obtain this unknown feature. For in situ and on-line (real time) measurements of laser ablation rate, the integration of LIBS-method and speckle interferometry may be advised[37]. For LIBS quantitative measurements of deposited elemental content, two solu-tions may be advised. Thefirst one is ablation of etalon samples with the known elemental content which is followed by calibration curve method. LIBS studies with ITER-like samples have already been initiated
[8]. Calibration-free method may be advised as another solution[11,38– 39]. In this method, one should consider not solely the existence of a local thermodynamic equilibrium, but also plasma stoichiometry and a possible modification of hydrogen distribution resulting from crater heating by previous laser pulses.
The possibility to make LIBS-measurements with a single laser pulse may be regarded as one of the important results of our study. These measurements were performed following a very thorough parameter optimisation of laser and detection systems. A powerful (3 J) and short pulse (300 ps) laser allowed us to create a bright powerful plasma plume (∅ ≈ 10 mm) with a controllable ablation rate. The ablation rate may be estimated from a typical layer thickness (δ ≈ 15 μm) in the tested zone[40–41]. FromFig. 4, one can see that 5 pulses were required to ablate the DL and to reach the substrate (tungsten). Thus, the laser ablation rate may be estimated as 3μm per pulse. For applied laser beam with d = 4 mm spot diameter, ablation rate is≈4 × 10⁻⁵cm3 per pulse, that is, for typical solid matter density of 1023atoms/cm3, we can estimate that Npulse≈ 5·1018atoms per pulse were ablated. Supposing that total atomisation of this ablated matter took place, one may estimate that plasma plume density was about Npulse/ ∅3~ 1018atoms/cm3. Even with 10% of plasma ionisation for ps laser pulse of 80 GW/cm2intensity, the electron density was ~ 1017cm−3, that is, it was sufficient to reach local thermal equilibrium for hydrogen atoms[42].
Plasma plume temperature may be estimated from hydrogen Dα spectral line lifetime (τ ≅ 700 ns) and its diameter (∅ ≅ 12.7 mm). Thus, plasma plume expansion velocity was vp≈ ∅/τ ≅ 18·103m/s and the corresponding deuterium atoms kinetic energy Ek≅ 3.4 eV. For a laser plasma plume expansion in vacuum, its temperature was of the same order as for kinetic energy Ek[43–47]. Thus, a mean tempera-ture of LIBS plasma may be estimated as T≈ 3 eV, though this estima-tion data should be very carefully verified in future experiments. Such high LIBS plasma temperature is in accordance with the pronounced presence of intense ionic spectral lines (CII and BeII) and those of deuterium with high excitation energy (≈10 eV).
The hydrogen isotopes content measurements were of a minor im-portance in our experiments as the major hydrogen isotopes in the de-posits was deuterium (94%). For LIBS-analysis with the spectral line resolution of D/T hydrogen isotope, the spectral resolution of the spec-trometer should be better than 10,000:1, and hydrogen spectral line broadening should be less than their isotopes shifts (≅0.06 nm for Dα/ Tαand≅0.04 nm for Dβ/Tβor Dγ/Tγ)[48–49].This resolution may be ob-tained even with a conventional spectrometer (like the one applied in our studies, but with the slit width of 20μm). The spectral line broaden-ing in the LIBS plasma may be seen as a major problem for measure-ments of isotopic resolution. In this case, a more intense hydrogen spectral line (Hα, Dα, and Tα) may not be regarded as the best choice if its Stark broadening is higher than the one for Hγ, Dγ, and Tγ transi-tions (Figs. 2a and5). Further investigations are required to study the possibility to make measurements of hydrogen isotope content with Dγand Tγ(or with Dβand Tβ) transitions with a less pronounced line broadening (Figs. 2b and c).
Some features of plasma spectroscopy and LIBS-method application in relation to magneticfield effects should be noted. In this case, the magneticfield of some Tesla may result in additional spectral line broadening by the Zeeman splitting. For Dαtransitions, this splitting is (≈0.04 nm/Tesla)[50]and is comparable with the isotopes shift. For Dβand Dγtransitions, the Zeeman splitting is lower, but not negligible
[51–52]. The Zeeman broadening together with the Doppler and the Stark ones may reduce the spectral line resolution, and, consequently, result in a lower LIBS potentiality for isotopic measurements. This is regarded as a negative effect of the magneticfield. However, with the magneticfield parallel to the sample surface, the LIBS plasma may be confined, thus resulting in a longer lifetime of spectral lines and in Table 1
Identified LIBS spectral lines detected for divertor DL in JET environmental conditions. Observed spectral line intensities (second column) are related to 25 MCP gain.
Wavelength (nm) Intensity (a.u.) Transition type Aij(107Hz) Ej(eV) low Ei(eV) upper Shot no
658.29 400 C II 3.66 14.45 16.331 1 657.81 1000 C II 3.67 14.45 16.333 1 656.10 (multiple) 6000 1400 1600 Dα 23 10.2 12.1 1 2 5 654.8 (multiple) 80 Be II – 14.81 16.7 2 589.59 900 Na I 6.14 0.0 2.10 10 532.83 5 Cr I 6.2 2.91 5.24 3 529.74 10 Cr I 3.88 2.9 5.24 3 527 (multiple) 400 Be II 9.7 11.96 14.32 3 521.82 160 Cu I 7.5 3.82 6.19 3 515.32 100 Cu I 6.0 3.79 6.19 3 490–515 (multiple) 800 Ni I – – ≈6 4 486.00 (multiple) 1600 Dβ 7.16 10.20 12.75 5 482.8 (multiple) 200 Be II 1.75 12.16 14.72 5 467.34 (multiple) 5000 Be II 44.27 12.16 14.81 6 457.27 4500 Be I 7.62 5.28 7.99 6 440.79 100 Be I 1.01 5.28 8.09 7 436.1 (multiple) 2500 Be II 21.81 11.96 14.81 2 433.93 (multiple) 1000 Dγ 3.26 10.20 13.06 1 428.97 150 Cr I 3.16 0.0 2.9 2 427.48 150 Cr I 3.07 0.0 2.9 2 426.73 (multiple) 2000 C II 47.69 18.05 20.95 1 425.43 150 Cr I 3.15 0.0 2.91 2
higher LIBS analytical signals[53–56]. In case of a high magneticfield, one should mention the effect of the Larmor rotational movements of ions as another plasma spectroscopy particularity[57–58]. However, this effect may be neglected in transient (plasma lifetime of 700 ns) and collisional LIBS plasma.
To summarise the above considerations, we may conclude that our results on LIBS in situ application in JET may be regarded as very satis-factory and inspiring to continue the multi-aspect study of LIBS analyt-ical method in search for the best efficient design for LIBS diagnostics for tritium inventory in Tokamaks.
5. Conclusions
Feasibility of LIBS remote measurements was demonstrated with JET EDGE LIDAR laser system (300 ps Ruby laser, laser intensity up to 80 GW/cm2, 10 m distance, vacuum) and a thick deposited layer (~10μm) on JET divertor tile. A number of analytical spectral lines (D, CII, CrI, and BeII) in 400–600 nm spectral range were distinguished and identified.
Based on the successful qualitative results on in situ LIBS application in JET, we may conclude that LIBS method along with the available JET EDGE LIDAR system is applicable for in situ analysis of deposited layers of the JET divertor.
Further development of the available EGDE LIDAR Laser System and optimisation of LIBS analytical features may result in a fruitful realisa-tion of a permanent LIBS system.
Acknowledgements
The authors are grateful to the JET administration for authorization to perform a set of LIBS studies on JET installation with EGDE LIDAR Laser System.
References
[1] G. Counsell, P. Coad, C. Grisolia, et al., Tritium retention in next step devices and the
requirements for mitigation and removal techniques, Plasma Phys. Controlled Fu-sion 48 (2006) B189–B199.
[2] C. Grisolia, S. Rosanvallon, P. Coad, et al., JET contributions to ITER technology issues,
Fusion Eng. Des. 81 (2006) 149–154.
[3] C. Grisolia, G. Counsell, G. Dinescu, et al., Treatment of ITER plasma facing
compo-nents: current status and remaining open issues before ITER implementation, Fu-sion Eng. Des. 82 (2007) 2390–2398.
[4] T. Loarer, Fuel retention in tokamaks, J. Nucl. Mater. 390–391 (2009) 20–28.
[5] F. Le Guern, F. Brygo, P. Fichet, et al., Co-deposited layer characterisation and
remov-al control by opticremov-al emission spectroscopy coupled to nanosecond laser ablation, Fusion Eng. Des. 81 (2006) 1503–1509.
[6] A. Semerok, S.V. Fomichev, J.M. Weulersse, et al., Heating and ablation of tokamak
graphite by pulsed nanosecond Nd-YAG lasers, J. Appl. Phys. 101 (2007) 084916.
[7] L. Mercadier, J. Hermann, C. Grisolia, et al., Plume segregation observed in hydrogen
and deuterium containing plasmas produced by laser ablation of carbonfiber tiles
from a fusion reactor, Spectrochim, Acta Part B 65 (2010) 715–720.
[8] L. Mercadier, A. Semerok, P.A. Kizub, et al., In-depth analysis of ITER-like samples
composition using laser-induced breakdown spectroscopy, J. Nucl. Mater. 414 (2011) 485–491.
[9] L. Mercadier, J. Hermann, C. Grisolia, et al., Analysis of deposited layers on plasma
facing components by laser-induced breakdown spectroscopy: towards ITER tritium inventory diagnostics, J. Nucl. Mater. 415 (2011) S1187.
[10]A. Semerok, S.V. Fomichev, F. Brygo, et al., Pulsed repetition rate nanosecond laser
heating and ablation of the tokamak graphite tile deposited layers, J. Nucl. Mater. 420 (2012) 198–206.
[11] L. Mercadier, J. Hermann, C. Grisolia, et al., Diagnostics of nonuniform plasmas for
el-emental analysis via laser-induced breakdown spectroscopy: demonstration on car-bon-based materials, J. Anal. At. Spectrom. 28 (2013) 1446–1455.
[12]A. Semerok, C. Grisolia, LIBS for tokamak plasma facing components
characterisa-tion: perspectives on in situ tritium cartography, Nucl. Instrum. Methods Phys. Res., Sect. A 720 (2013) 31–35.
[13] S. Almaviva, L. Caneve, F. Colao, et al., Remote-LIBS characterization of ITER-like
plasma facing materials, J. Nucl. Mater. 421 (2012) 73–79.
[14]S. Almaviva, L. Caneve, F. Colao, et al., Laboratory feasibility study of fusion vessel
inner wall chemical analysis by laser induced breakdown spectroscopy, Chem. Phys. 398 (2012) 228–232.
[15] S. Almaviva, L. Caneve, F. Colao, et al., Double pulse laser induced breakdown
spec-troscopy measurements on ITER-like samples, Fusion Eng. Des. 96–97 (2015) 848–851.
[16]S. Almaviva, L. Caneve, F. Colao, et al., Measurements of deuterium retention and
surface elemental composition with double pulse laser induced breakdown spec-troscopy, Phys. Scr. T167 (2016) 014043.
[17] V.M. Kozhevin, E.E. Mukhin, G.T. Razdobarin, et al., Laser induced breakdown spec-troscopy technique for in-situ dust detecting in a next-step tokamak, in“Hydrogen and Helium Recycling at Plasma Facing Materials”, NATO Science Series II: Mathe-matics, Physics and Chemistry, vol. 54, pp. 213-226, published 2002, Edited by A. Hassanein.
[18] E. Mukhin, K. Vukolov, V. Semenov, et al., Progress in the development of deposition
prevention and cleaning techniques of in-vessel optics in ITER, Nucl. Fusion 49 (2009) 085032.
[19] P. Gasior, M. Bieda, M. Kubkowska, et al., Laser induced breakdown
spectrosco-py as diagnostics for fuel retention and removal and wall composition in fusion reactors with mixed-material components, Fusion Eng. Des. 86 (2011) 1239–1242.
[20]G. Shaw, M.Z. Martin, R. Martin, et al., Preliminary design of laser-induced
break-down spectroscopy for proto-material plasma exposure eXperiment, Rev. Sci. Instrum. 85 (2014) 11D806.
[21] C. Li, D. Zhao, X. Wu, H. Ding, Spatial resolution measurements of C, Si and Mo using
LIBS for diagnostics of plasma facing materials in a fusion device, Plasma Sci. Technol. 17 (2015) 638–643.
[22] C. Li, D. Zhao, Z. Hu, X. Wu, G.-N. Luo, J. Hu, H. Ding, Characterization of deuterium
retention and co-deposition of fuel with lithium on the divertor tile of EAST using laser induced breakdown spectroscopy, J. Nucl. Mater. 463 (2015) 915–918.
[23] H.J. van der Meiden, M.A. van den Berg, S. Brons, et al., Laser-based diagnostics
ap-plications for plasma-surface interaction studies, J. Instrum. 8 (2013) C11011.
[24] A. Malaquias, V. Philipps, A. Huber, et al., Development of ITER relevant laser
tech-niques for deposited layer characterisation and tritium inventory, J. Nucl. Mater. 438 (2013) S936–S939.
[25] Q. Xiaoa, A. Huber, G. Sergienko, et al., Application of laser-induced breakdown
spectroscopy for characterization of material deposits and tritium retention in fusion devices, Fusion Eng. Des. 88 (2013) 1813–1817.
[26] A. Huber, B. Schweer, V. Philipps, et al., Development of laser-based diagnostics for
surface characterisation of wall components in fusion devices, Fusion Eng. Des. 86 (2011) 1336–1340.
[27] P. Paris, K. Piip, A. Hakola, et al., Development of laser induced breakdown
spectros-copy for studying erosion, deposition, and fuel retention in ASDEX upgrade, Fusion Eng. Des. 98–99 (2015) 1349–1352.
[28] J. Karhunen, A. Hakola, J. Likonen, et al., Applicability of LIBS for in situ monitoring of
deposition and retention on the ITER-like wall of JET– comparison to SIMS, J. Nucl.
Mater. 463 (2015) 931–935.
[29] B. Sallé, J.-L. Lacour, E. Vors, et al., Laser-induced breakdown spectroscopy for Mars
surface analysis: capabilities at stand-off distances and detection of chlorine and sul-fur elements, Spectrochim. Acta Part B 59 (2004) 1413–1422.
[30]B. Sallé, T. David, D.A. Cremers, et al., Laser-induced breakdown spectroscopy for
space exploration applications: influence of the ambient pressure on the calibration curves prepared from soil and clay samples, Spectrochim. Acta Part B 60 (2005) 479–490.
[31] B. Sallé, J.-L. Lacour, P. Mauchien, et al., Comparative study of different
method-ologies for quantitative rock analysis by laser-induced breakdown spectrosco-py in a simulated Martian atmosphere, Spectrochim. Acta Part B 61 (2006) 301–313.
[32] M. Kempenaars, J.C. Flanagan, L. Giudicotti, et al., Enhancement of the JET edge
LIDAR Thomson scattering diagnostic with ultrafast detectors, Rev. Sci. Instrum. 79 (2008) 10E728.
[33] NIST database,http://www.nist.gov.
[34] A. Semerok, P. Mauchien, Ultrashort pulse laser ablation for surface elemental
anal-ysis, Rev. Laser Eng. 33 (2005) 5308–5336.
[35]A. Semerok, C. Dutouquet, Ultrashort double pulse laser ablation of metals, Thin
Solid Films 453–454 (2004) 501–505.
[36]A. Semerok, C. Dutouquet, Analytical performances of laser-induced micro-plasma
of Al samples with single and double ultrashort pulses in air and with Ar-jet: a com-parative study, Spectrochim. Acta Part B 99 (2014) 163–171.
[37] M. Fabert, L. Gallais, Y. Pontillon, On-line deformation measurements of nuclear fuel
rod cladding using speckle interferometry, Prog. Nucl. Energy 72 (2014) 44–48.
[38] E. Tognoni, G. Cristoforetti, S. Legnaioli, et al., Calibration-free laser-induced
break-down spectroscopy: state of the art, Spectrochim. Acta Part B 65 (2010) 1–14.
[39] J. Hermann, A. Lorusso, A. Perrone, et al., Simulation of emission spectra from
non-uniform reactive laser-induced plasmas, Phys. Rev. E92 (2015) 053103.
[40] T. Tanabe, N. Bekris, P. Coad, et al., Tritium retention of plasma facing components in
tokamaks, J. Nucl. Mater. 313–316 (2003) 478–490.
[41] N. Bekris, J.P. Coad, C. Grisolia, et al., Fusion technology related studies at JET:
post-mortem tile analysis with MKII-HD geometry, in situ laser detritiation and molecu-lar sieve bed detritiation, J. Nucl. Mater. 417 (2011) 1356–1360.
[42] J.D. Hey, C.C. Chu, J.P.S. Rash, Partial local thermal equilibrium in a low-temperature
hydrogen plasma, J. Quant. Spectrosc. Radiat. Transf. 62 (1999) 371–387.
[43] J.C.S. Kools, T.S. Baller, S.T. De Zwart, J. Dieleman, Gasflow dynamics in laser ablation
deposition, J. Appl. Phys. 71 (1992) 4547–4556.
[44] S.I. Anisimov, B.S. Luk'yanchuk, A. Luches, An analytical model for three-dimensional
laser plume expansion into vacuum in hydrodynamic regime, Appl. Surf. Sci. 96-98 (1996) 24–32.
[45]W. Pietsch, A. Petit, A. Briand, Isotope ratio determination of uranium by optical
emission spectroscopy on a laser-produced plasma - basic investigations and ana-lytical results, Spectrochim. Acta Part B 53 (1998) 75l–761.
[46] X. Ni, K.K. Anoop, X. Wang, et al., Dynamics of femtosecond laser-produced plasma
[47] A.A. Morozov, Analytical formula for interpretation of time-of-flight distributions for neutral particles under pulsed laser evaporation in vacuum, J. Phys. D. Appl. Phys. 48 (2015) 19550.
[48] C.G. Parigger, E. Oks, Hydrogen Balmer series spectroscopy in laser-induced
break-down plasmas, Int. Rev. At. Mol. Phys. 1 (2010) 13–23.
[49] A.N. Zaidel', V.K. Prokof'ev, S.M. Raiskii, V.A. Slavnyi, E.Y. Shreider, Table of Spectral
Lines, Springer Science + Business Media, New York, 1970.
[50] J.D. Hey, C.C. Chu, E. Hintz, On a heating mechanism for cold hydrogen and
deuteri-um atoms produced at the edge of a tokamak plasma, J. Phys. B Atomic Mol. Phys. 32 (1999) 3555–3573.
[51] J.D. Hey, M. Korten, Y.T. Lie, et al., Doppler broadening and magneticfield effects on
the Balmer lines emitted at the edge of a tokamak plasma, Contrib. Plasma Phys. 36 (1996) 583–604.
[52] J. Rosato, V. Kotov, D. Reiter, Modelling of passive spectroscopy in the ITER
divertor: thefirst hydrogen Balmer lines, J. Phys. B Atomic Mol. Phys. 43
(2010) 144024.
[53] V.N. Rai, A.K. Rai, F.-Y. Yueh, et al., Optical emission from laser-induced breakdown
plasma of solid and liquid samples in the presence of a magneticfield, Appl. Opt. 42
(2003) 2085–2093.
[54] R. Hai, P. Liu, D. Wu, Q. Xiao, L. Sun, H. Ding, Effect of steady magneticfield on
laser-induced breakdown spectroscopic characterization of EAST-like wall materials, J. Nucl. Mater. 463 (2015) 927–930.
[55]P. Liu, R. Hai, D. Wu, et al., The enhanced effect of optical emission from laser
in-duced breakdown spectroscopy of an Al-Li alloy in the presence of magneticfield
confinement, Plasma Sci. Technol. 17 (2015) 687–692.
[56] Q. Xiao, R. Hai, H. Ding, et al., In-situ analysis of thefirst wall by laser-induced
break-down spectroscopy in the TEXTOR tokamak: dependence on the magneticfield
strength, J. Nucl. Mater. 463 (2015) 911–914.
[57] A. Semerok, A. Pailloux, CW laser-inducedfluorescent spectroscopy of highly
mag-netized collisionless plasma, Laser Phys. 9 (1999) 244–248.
[58] A. Semerok, B. Larousse, A. Pailloux, Optical diagnostics system for measuring