HAL Id: tel-02009713
https://tel.archives-ouvertes.fr/tel-02009713
Submitted on 6 Feb 2019HAL is a multi-disciplinary open access archive for the deposit and dissemination of sci-entific research documents, whether they are pub-lished or not. The documents may come from teaching and research institutions in France or abroad, or from public or private research centers.
L’archive ouverte pluridisciplinaire HAL, est destinée au dépôt et à la diffusion de documents scientifiques de niveau recherche, publiés ou non, émanant des établissements d’enseignement et de recherche français ou étrangers, des laboratoires publics ou privés.
center
Govind Nandakumar
To cite this version:
Govind Nandakumar. Galactic archaeology and its application to the galactic center. Astrophysics [astro-ph]. Université Côte d’Azur, 2018. English. �NNT : 2018AZUR4064�. �tel-02009713�
-0.5in-0.5in
L’archéologie galactique et son
application au centre galactique
Govind NANDAKUMAR
Laboratoire J-L. Lagrange - Observatoire de la Côte d’Azur
Présentée en vue de l’obtention du grade de docteur
en Sciences de la Planéte et de l’Univers
d’Université Côte d’Azur
Thése dirigée par: Mathias Schultheis Soutenue le: 14 Septembre 2018
Devant le jury, composé de:
Mme. Vanessa Hill Chargée de recherche CNRS - HDR Président
Mme. Livia Origlia Chercheur Rang A Rapporteur
M. Karl Menten Professeur Rapporteur
Mme. Nadine Neumayer Docteur en Astronomie Examinateur
Mme. Elena Valenti Docteur en Astronomie Examinateur
L’archéologie galactique et son
application au centre galactique
Jury:
Président du Jury:
Mme. Vanessa Hill, Chargée de recherche CNRS - HDR, Université Côte d’Azur
Rapporteurs:
Mme. Livia Origlia, Chercheur Rang A, Observatoire Astronomique de Bologne (Italie) M. Karl Menten, Professeur, Ste Max-Planck (Allemagne)
Examinateurs:
Mme. Nadine Neumayer, Docteur en Astronomie, Ste Max-Planck (Allemagne)
Résumé : L’archéologie galactique consiste à disséquer et analyser les nombreuses
com-posantes de la Voie Lactée afin de mettre en évidence et distinguer les processus physiques qui contribuent à sa formation et son évolution. Ceci est possible grâce à une estimation précise des positions, des vitesses ainsi que des propriétés de l’atmosphère stellaire des étoiles individuelles qui appartiennent aux différents populations stellaires qui composent chacune de ces composantes. De ce fait, ce domaine dépend non seulement d’observations photométriques, astrométriques et spectroscopiques permettant de mesurer en détail les pro-priétés stellaires mentionnées mais également de modèles théoriques précis afin de les con-fronter avec les données observationnelles. Au cours de cette thèse, j’ai mené une étude détaillée sur les effets de fonction de sélection sur les abondances métalliques en utilisant des sondages spectroscopiques aux grandes échelles, suivi d’observations spectroscopiques de petites et grandes résolutions sur les parties internes de la Voie Lactée afin de caractériser la nature chimique du bulbe galactique ainsi que le taux de formation stellaire dans la zone centrale moléculaire (CMZ).
Avec les présents et futurs grands sondages dédiés à l’archéologie galactique tels que APOGEE, RAVE, LAMOST, GALAH, etc..., il est essentiel de connaître la fonction de sélection spécifique qui est associée à la stratégie de ciblage de chacun de ces sondages. En utilisant des champs communs et des lignes de visée similaires entre APOGEE, LAM-OST, GES et RAVE, et tout en considérant des modèles de synthèse de population stellaire, J’ai étudié les effets de fonction de sélection sur la fonction de distribution de la métallic-ité (MDF) et sur le gradient vertical de métallicmétallic-ité dans le voisinage solaire. Mes résultats indiquent qu’il y a un négligeable effet de fonction de sélection sur la MDF ainsi que sur le gradient vertical de métallicité. Ces résultats suggèrent alors que différents sondages spec-troscopiques (de différentes résolutions et de longueurs d’onde) peuvent être combinés dans des études similaires à condition que les métallicité soient placées sur la même échelle.
Tandis que de plus en plus d’observations spectroscopiques des régions externes du bulbe de la Voie Lactée révèlent la complexité de sa morphologie, sa cinétique et de sa nature chimique, les études détaillées sur les abondances chimiques de la région interne du bulbe (400-500 pc) font en revanche défaut. Je présenterai alors des spectres de haute résolution dans la bande K d’étoiles géantes K/M issues de cette région obscure et obtenus à partir du spectrographe de haute résolution dans l’infrarouge, CRIRES (R-50,000) situé au VLT. Je discuterai ensuite la MDF et les abondances chimiques détaillées de notre échantillon dans cette région et également la symétrie Nord-Sud dans la MDF le long du petit axe du bulbe.
Un enjeu majeur dans les modèles d’évolution chimique est le manque de connaissance vis à vis de l’histoire et du taux de la formation stellaire de la Voie Lactée. La partie centrale de la Voie Lactée (<200 pc), appelée communément la zone centrale moléculaire, possède un grand réservoir de gaz moléculaire avec des indications d’activités de formation stellaire du-rant les 100 000 dernières années. J’ai utilisé des spectres KMOS (VLT) de petite résolution afin d’identifier et analyser les objects stellaires jeunes et massifs (YSOs) et afin d’estimer le taux de formation stellaire dans la CMZ en utilisant la méthode de contage YSO.
Mots clefs: Voie Lactée, populations stellaires, sondages spectroscopiques, archéologie
galactique. Etoiles: abondances, "tardive" , pré-séquence principale, massive, diagramme C-M. Galaxie: bulbe, centre, contenu stellaire.
Abstract : Galactic archaeology deals with dissecting the Milky Way into its various
com-ponents with the objective to disentangle processes contributing to the Milky Way formation and evolution. This relies on precise estimation of positions, velocities as well as stellar at-mosphere properties of individual stars belonging to different stellar populations that make up each of these components. Thus this field relies on photometric, astrometric and spectro-scopic observations to measure the above mentioned stellar properties in detail in addition to accurate models to compare the observed results with. In this thesis, I have carried out a detailed study of selection function effects on metallicity trends using larges scale spec-troscopic surveys, followed by high and low resolution specspec-troscopic observations towards the inner Milky Way to characterise the chemical nature of the inner Galactic bulge and to measure the star formation rate in the central molecular zone (CMZ), respectively.
With ongoing and upcoming large Galactic archaeology spectroscopic surveys such as APOGEE, RAVE, LAMOST, GALAH etc, it is essential to know the specific selection func-tion which is related to the targeting strategy of each of them. By using common fields along similar lines of sight between APOGEE, LAMOST, GES and RAVE, and together with stel-lar population synthesis models, I investigate the selection function effect on the metallicity distribution function (MDF) and the vertical metallicitiy gradients in the solar neighbor-hood. My results indicate that there is negligible selection function effect on the MDF and the vertical metallicity gradients. These results suggest that different spectroscopic surveys (different resolutions and wavelength range) can be combined for such studies provided their metallicities are put on the same scale.
While more and more spectroscopic observations of the outer bulge regions reveal the complex morphological, kinematic and chemical nature of the Milky Way bulge, there is a lack of detailed chemical abundances studies in the inner bulge region (400-500 pc). I will present high resolution K-band spectra of K/M giants in this highly obscured region obtained using the high resolution infrared spectrograph, CRIRES (R-50,000), on VLT. I will discuss the MDF and detailed chemical abundances of our sample in this region as well as the North-South symmetry in MDF along the bulge minor axis.
A major challenge in the chemical evolution models is the lack of knowledge about the star formation history and the star formation rate in the Milky Way. The inner 200 pc of the Milky way, the so called central molecular zone, has a large reservoir of molecular gas with the evidence of star formation activity during the last 100,000 years. I used low resolution KMOS spectra (VLT) to identify and analyse massive young stellar objects (YSOs) and estimated the star formation rate in the CMZ using the YSO counting method.
Keywords: Milky Way, stellar populations, spectroscopic surveys, Galactic archaeology.
Stars:abundances, late-type, pre-main sequence, massive, C-M diagrams. Galaxy: Bulge, center, stellar content.
Acknowledgements
Following the Indian tradition, I start by thanking my amma achan (parents), Lekha and Nandakumar. The ideals and value of hard work they have instilled in me and my brother are the primary reason why we have gotten this far. I am well aware of the sacrifices you have endured to build up this family, and I hope to make you proud with the way I live my life. My brother, kannettan, had always been my best friend and a mentor, who had always been there to inspire and motivate me. I am thankful to my dearest grandparents, muthu, ammu and Rukmani ammoomma, who have always showered their blessings, love and affection on me. I still remember the inspiring letter from my uncle, Arummaan, when I joined for my Masters. I have also looked up to my aunt, Dimmaay, for the way she has determinedly pursued to obtain her masters. Kochachan and Devi chitta have also been silent supporters through all these years. In addition, I have been blessed with an extended family of cousins, aunts and uncles from both my mother’s and father’s side, who have all been very supportive in my 3 year pursuit towards doctorate. I wish to thank them all for their support.
I believe that after parents, it is guru (teacher), who play an important role in developing the personality, ideals, principles and work ethics of a child. I am thankful to my teachers in the school I studied for 14 long years for their guidance and correction (some of them by means of painful beatings). I thank Devdas sir for guiding me and a lot of other students to love mathematics. I wish to thank the friends I have made during my Engineering college days (Akshay, Ashok, Deepak, Gayathri, Jaise, Jaseel, Neetu, Nishad, Pattu, Sankaran, Se-ban, Sidharth, Sreeyesh, Vinay, Vineetha etc) for their life long friendship and experiences that have helped me grow and learn more about life. I also thank Radhamani aunty, who treated us three like her own children I am thankful to the professors - Sarita, Anandmayee, Anand, Samir, Jagdheep and Resmi of Indian Institute of space science and Technology, who introduced me to Astrophysics and observational astronomy, and were always ready to clear my doubts. I am extremely grateful to Sarita maam for her invaluable guidance during my 1 year masters thesis and Anandmayee maam for her invaluable support during the whole masters program. I also wish to express my gratitude to Anandmayee maam for introducing me to Mathias, and recommending me for the PhD program in Nice. I can’t thank Veena chechi enough for her support and guidance during masters, in writing the masters paper as well as during my PhD when I pestered her with my silly doubts.
I have no words to thank Mathias for his continuous support and guidance during these three years. Starting from the email interactions when I was in India, trying to tackle the Visa issues, he proved to be a man of unlimited patience. From the day I landed in Nice, he was at the forefront in helping me settle down, driving me around to the bank, apartment and introducing me to the beautiful city, Nice. Professionally, he was always there, either in person or through emails, to clear my doubts or for discussion. He never thought twice in offering me a ride up to the observatory in his car every morning, and I believe the discussions we had in those brief 10-15 minutes have been the source of inspiration and motivation that had driven me forward every day during my PhD. He also showed confidence in me to be part of the observing proposal, go to Chile and carry out the observations, which had induced so much confidence in me as well. Thus I have learned and gained both professionally as well as
me in their home in more than one occasion.
The Galactic Archaeology group (GAG) meetings have been helpful in developing my science communication skills. It also provided a platform for discussing other interesting papers as well as my work with the team. I would like to thank the team, comprising Ale-jandra, Vanessa, Patrick, Georges and Sebastian for their support during these three years. They have all been very welcoming and supportive. I also thank Oliver for the persistence with which he organised the Journal club and inspired me to read papers outside my research domain. Those sessions have given me a broader perspective.
I could not have survived these three years without the support of the friends I made in Nice. Srivatsan was the first, without whose friendship I couldn’t have survived the first few months in such a culturally new place (for me). Then there was my first office mate Alvaro, whose work ethics inspired me to follow his work routine (being the first to reach OCA and the last one to leave). I have to thank Nastya first and foremost for her support and help during our trip to a conference in the west coast of France (me with no bank card or local sim card) when all the trains were cancelled due to floods. I owe it to her for having reached there in one piece. Then came Marina and Katherina, with whom I shared the office for few months and made me realise my fortune to have been in a very lively office. The rude Marina (:-p) has later on become a very good friend. I still remember the initial days of ping pong and tandoori with Alkis, Alvaro, Andrea, Gerardo, Sergei and Srivatsan, that were real stress busters. With in the first year itself, my friend circle became larger as time progressed with the arrival of Michael I, Edouard and Remi. The movie nights and dinners in Michael I’s place, hikes and French sessions with Remi and Whiskey evenings with Edouard deserve special mention and will be remembered. It always feels good to speak the mother tongue, and enter Vishnu in the French class, where we spoke more malayalam than French. His company was very important during these years, and I thank him for introducing me to the Cricket club MCCC, through which I made more friends, Ashok paaji, paramjit, Somnath, Rohan, Redwan etc. Tandoori Flame is a name and restaurant that I will remember, not only for the Indian food, but also for the loving attitude with which they served it to us. I have to thank Ashok paaji and Arpan bhai for that. With second year, new adventures and trips started with the arrival of new friends, Francesco, Michael II and Surabhi. I thank them for their company during the hiking trips and road trips we had, that helped me relax during a difficult second year. It was also at this time that I was totally surprised by the gift presented to me for my birthday. I will remember it as the first time that I got such a thoughtful and considerate birthday gift, thanks to Michael II for the idea and hardwork, Nastya for the wonderful design, Surabhi and Francesco for the Tiramisu and all those who contributed the songs. I got a similar surprise again this year and it still reminds me of the wonderful friends I have made.
I thought the three months (during the start of my third year) that I spend in Lund would be the most difficult time I will have during my PhD, first due to the cold climate and second due to the fact that I only knew Nils and Brian there, whom I met in a conference. But those months turned out to be very productive as I learned a lot and I really enjoyed my stay in
Lund, all thanks to the wonderful company of Nils and Brian.
On returning to Nice and during my third year, I had a new office mate, Emma, with whom I have had a lot of stimulating scientific discussions and many other topics (even few words in spanish!). I thank her for being so kind, considerate and for her support during the stressful time I was applying for postdocs and writing this thesis. I would also like to thank Pablo who became a close friend in a very short time. I definitely have to mention the really competitive ping pong sessions I had with Emma, Francesco, Mathias, Pablo and Patrick during the last few months, during which time I was writing the thesis and preparing for the thesis defense. These sessions refreshed me, giving more energy and made me more active to work harder. I also went out to the sea most during this time, thanks to Nastya and Edouard. Talking about stress busters and times of relaxation, I will rank the one hour long amazing lunch in the cantine with the amazing view at the top of the list, thanks to the chef Khaled and the cantine staffs. I have to owe it to Khaled for a lot of French (most of them, profanity) that I have learned. It is during this lunch time that I have met other PhDs, postdocs, permanent staffs and interns in CION and other buildings in the campus. I thank them - Alexis, Andy, Brynna, Clement, Cosmin, Elena, Eric, Florian, Gabriele, Go, Jeremy, Jun, Laurent, Louic, Mateus, Michael III, Rafael, Saverio, Sofia, Tobias, Tomas, Umberto, Vincent, Vitalie Ximena (to name a few) for the interesting discussions and fun lunch conversations.
I would also like to acknowledge the co authors of my papers for their support and in-valuable contribution to them. I thank Anja for her help while preparing observations and reducing KMOS spectra. I thank Sophie Rousset, Sylvie Goletto, other administrative and IT staffs in the Lagrange laboratory for their help and support. I also thank EDSFA for funding my PhD.
Contents
1 Introduction 1
1.1 An overview of the Milky Way Galaxy . . . 1
1.1.1 A brief history : Milky Way from observations . . . 2
1.1.2 Lambda Cold Dark Matter model . . . 3
1.1.3 Components of the Milky Way . . . 5
1.2 Galactic archaeology. . . 9
1.2.1 Photometric surveys . . . 11
1.2.2 Spectroscopic surveys . . . 13
1.2.3 Stellar population synthesis models. . . 17
1.2.3.1 TRILEGAL . . . 18
1.2.3.2 Galaxia/Besançon . . . 19
1.2.4 Chemical evolution models . . . 20
1.3 The inner Milky Way . . . 24
1.4 Goals of this thesis . . . 29
1.5 Published works . . . 29
2 Selection function effects on metallicity trends 31 2.1 Selection function . . . 32
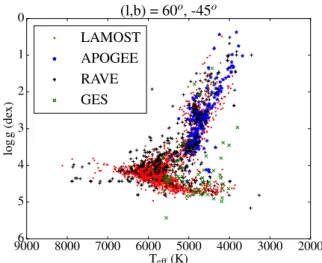
2.2 Comparison of stellar parameters. . . 39
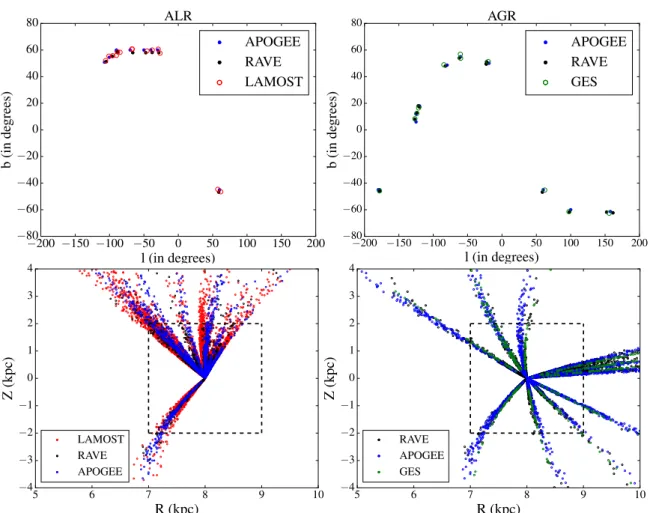
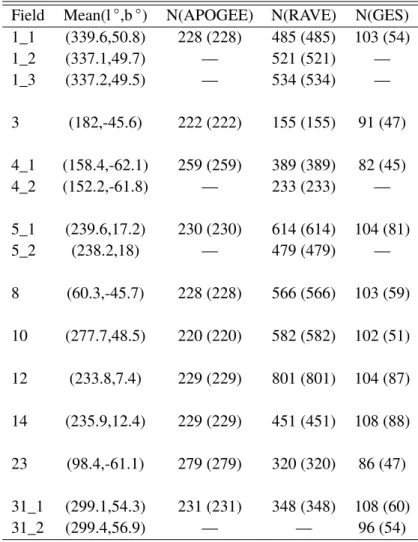
2.3 ALR and AGR . . . 41
2.4 Distances . . . 42
2.5 MOCK fields using SPS models . . . 45
2.5.1 Applying uncertainties and related checks on the models . . . 45
2.5.2 Comparison between GALAXIA and TRILEGAL . . . 46
2.6 Selection function effects on MDF . . . 51
2.6.1 AGR vs ALR . . . 54
2.7 Selection function effects on vertical metallicity gradients . . . 55
2.7.1 Vertical metallicity gradients for the observed sample . . . 56
2.8 Summary and conclusions. . . 59
3 Chemical characterization of the inner Galactic bulge 61 3.1 (Lack of) Observations in the inner Galactic bulge . . . 62
3.2 Data . . . 63
3.2.1 Target selection . . . 65
3.2.2 Observations. . . 70
3.3 Analysis . . . 72
3.3.1 SME . . . 72
3.3.2 K-band line list . . . 73
3.3.4 Stellar abundances . . . 78
3.3.5 Uncertainties. . . 78
3.3.5.1 General uncertainties . . . 79
3.3.5.2 Uncertainties related to stellar-parameters . . . 80
3.4 Homogeneous Analysis of the North-South sample . . . 82
3.5 Results . . . 83 3.6 Discussion. . . 86 3.6.1 MDF . . . 86 3.6.2 [α/Fe] vs [Fe/H] . . . 88 3.6.3 Kinematics . . . 89 3.6.4 North-South symmetry . . . 91
3.7 Summary and conclusions. . . 93
4 SFR in the CMZ 95 4.1 Estimating SFR . . . 95
4.1.1 Using cm or mm continuum emission . . . 96
4.1.2 Using infrared luminosity . . . 96
4.1.3 YSO counting . . . 97 4.2 Identifying YSOs . . . 98 4.3 SFR in the CMZ . . . 100 4.4 Data . . . 102 4.4.1 Sample selection . . . 103 4.4.2 Observations. . . 103 4.4.3 Data reduction . . . 104 4.5 Classification . . . 105 4.5.1 Spectroscopic classification . . . 105
4.5.2 Classification using photometric criteria . . . 109
4.6 Mass estimation . . . 110
4.6.1 Robitaille SED models . . . 111
4.6.2 SED fits . . . 112
4.6.3 Fit parameters and mass . . . 112
4.7 SFR estimate . . . 115
4.8 Summary and conclusions. . . 119
5 Conclusions and future works 121 5.1 Selection function effects . . . 121
5.1.1 Future works. . . 122
5.2 Galactic archaeology in the Inner Milky Way. . . 123
5.2.1 Inner Galactic Bulge . . . 123
5.2.1.1 Future works . . . 124
5.2.2 SFR in the CMZ. . . 125
Contents
Chapter 1
Introduction
Contents
1.1 An overview of the Milky Way Galaxy. . . . 1
1.1.1 A brief history : Milky Way from observations . . . 2
1.1.2 Lambda Cold Dark Matter model . . . 3
1.1.3 Components of the Milky Way. . . 5
1.2 Galactic archaeology . . . . 9
1.2.1 Photometric surveys. . . 11
1.2.2 Spectroscopic surveys. . . 13
1.2.3 Stellar population synthesis models . . . 17
1.2.3.1 TRILEGAL. . . 18
1.2.3.2 Galaxia/Besançon . . . 19
1.2.4 Chemical evolution models. . . 20
1.3 The inner Milky Way . . . . 24
1.4 Goals of this thesis. . . . 29
1.5 Published works . . . . 29
In this chapter, a brief overview of the Milky Way galaxy is given, with a little of its history from observational perspective and in detail, the different components that constitute the Milky Way. The main topic of this thesis, Galactic archaeology, is introduced focusing on various observational surveys and certain models used for the Galactic excavation. The inner kpc of the Milky Way, the region I explored in this thesis work, is introduced. Finally, I present the goals of this thesis and the list of published works during this thesis.
1.1
An overview of the Milky Way Galaxy
The first image that comes to our mind on hearing the name "Milky Way" is the dim but glowing band of light with dark patches arching across the dark night sky. This band of light is our host Galaxy in which our star, the Sun, is just one among∼1011stars. In addition to
these stars, various phases of gas as well as dust are part of the Milky way seen as diffuse light patches and dark shady patches, respectively. The inherent curiosity of humans have led to continuous efforts and advancements to decipher the Milky Way, and these investiga-tions are still ongoing. It is interesting to map the way our understanding of the Milky Way changed from generations to generations. I present a brief history of such findings, followed
Figure 1.1: The Galaxy model made by William Herschel based on star counts in different directions. Image courtesy :Longair(2008)
by the current understanding that we have about the morphological structure and the stellar populations constituting the different components of the Milky way.
1.1.1 A brief history : Milky Way from observations
Milky Way and its origin had a place in the mythology of ancient civilizations all over the world. May that be the Hindu mythology - the story of the churning of the ocean of milk, samudra manthan, that appears in ancient Hindu scriptures like Srimad Bhagavatam, the Mahabharata and the Vishnu Purana. The more popular ones from the Greek Mythology include the Milky Way being created by the Greek gods, not to mention the origin of the word Galaxy from the greek word for milk, galaktos. There are numerous other old beliefs and stories showing the interest and subsequent imaginations that the Milky Way has generated in humans.
In the early 17thcentury, the father of modern observational astronomy, Galileo Galilei,
discovered that this nebulous band consists of innumerable stars based on his observations through the telescope. This was followed up with speculative theories about solar systems, orbiting of the Sun around the ’Divine Centre’ of the star system and hierarchical or fractal models of the Universe by René Descartes (The World; 1636), Thomas Wright (An Origi-nal Theory or New Hypothesis of the Universe; 1750), Immanuel Kant (1755) and Johann Lambert (1761), respectively. All of these theories lacked observational validation.
A detailed observational study of the Milky Way star distribution was carried out by William Herschel towards the end of the 18th century. He assumed that the stars observed
in different directions had the same intrinsic luminosities. Based on this, he presented his famous picture of the structure of the Milky Way with a flattened disc of stars and the Sun located close to its center, as shown in the Figure1.1His assumption of constant luminosity for all stars was countered by John Mitchell, who advocated the existence of binary systems as well as star clusters which would lead to a dispersion in intrinsic luminosities of stars. Finally, William Herschel had to agree with John Mitchell’s conclusion when he measured the magnitudes of visual binary stars in 1802.
1.1. An overview of the Milky Way Galaxy 3
appearance, differing from the stars. Most of them were considered to be ’island universes’ similar to the Milky Way that are too distant to be resolved. Charles Messier started catalogu-ing many of these bright nebulae and the catalogue contains a mixture of brightest Galactic and extra-galactic nebulae, commonly referred to by their Messier numbers. William Her-schel and his sister Caroline also started a similar cataloguing of nebulae, continued by his son John Herschel, which resulted in the publication of the General Catalogue of Nebulae and Clusters of Starsin 1864. John Dreyer followed this up with the New General Catalogue of Nebulae and Clusters of Starsin 1888, the objects of which are commonly referred to by their NGC numbers.
It was in the year 1900 that the Milky Way was given the spiral arms for the first time by Cornelius Easton, though his model galaxy was small and Sun-centered. Harlow Shapley (1918, 1919) presented a much larger sized Galaxy, calculating the distances to globular clusters using the period-luminosity relation discovered by Henrietta Leavitt for Cepheid variable stars. He found the most distant globular cluster to be located at a distance of 67 kpc. In addition, this meant that the spiral nebulae could hardly be comparable galactic systems, rather they should belong to the enormously large Milky Way galaxy. At the same time, Heber Curtis’s Milky Way was only 10 kpc across, with the Sun located at 3 kpc from the center. He was also suggesting the spiral nebulae to be island universes citing the resemblance of the spectrum of the average spiral nebula to that of the integrated spectrum of the Milky Way. The questions about the true nature of the spiral nebulae (island universes or Milky Way subsystems) together with that about the size/structure of the Milky Way, lead to the famous ’The Great Debate’ between Harlow Shapley and Heber Curtis in 1920.
The size/structure of the Milky Way was investigated by Jacobus Katpeyn with the de-termination of the luminosity function of stars near the Sun based on star counts in different directions without accounting for absorption by dust. His model of the Milky Way had a flattened structure with the thickness of 1500 pc and extending about 8 times this size in the Galactic plane, with the Sun located slightly off from the center. Though the debate was unable to throw any significant light upon the issues, Edwin Hubble established that the spi-ral nebulae are indeed distant extragalactic systems based on his observations of cepheid variables in the Andromeda nebula. This was followed up with his finding in 1929 that the extragalactic nebulae are moving away from the Milky Way with velocities that are propor-tional to the distance from the Milky Way (Hubble,1929). This discovery lead to the theory of Big Bang cosmology and eventually the lambda cold dark matter (λ-CDM) models which describes our current understanding of the formation of the expanding Universe and the struc-tures in it. I will summarise them in the context of Galaxy formation in the section1.1.2.
1.1.2 Lambda Cold Dark Matter model
According to the Big Bang cosmology, the Universe must have started from a hot and dense state (Lemaître, 1931) and experienced inflation (a period of rapid exponential expansion ∼picosecond after the Big Bang) that lead to the primordial density enhancements in the form of quantum fluctuations to become the seeds of all structure formation. Various observations in the 20th century contributed to the validation of the Big Bang picture of formation and
evolution of the Universe : the discovery of the expansion of galaxies by Hubble, the obser-vational evidence of the cosmic microwave background radiation (CMB, the cooled remnant of the Universe’s very hot early phases;Penzias and Wilson(1965);Dicke et al.(1965)) and the finding that the Big Bang nucleosynthesis could account for the cosmic abundances of the light isotope of helium,3He, deuterium, D, and lithium,7Li.
The temperature fluctuations/intensity distributions in the CMB gave an insight into the density fluctuations at the epoch of recombination (formation of neutral hydrogen from elec-trons and protons; z∼1100) that lead to the proposal of two processes by which the present structures in the Universe formed. Both the processes agreed that the very small anisotropies in the CMB could not support a pure-baryonic universe from which the galaxies form ( Sun-yaev and Zeldovich,1970). Around the same time,Rubin and Ford(1970) found a flat rota-tion curve for Andromeda, M31, indicating the presence of non interacting matter or ’dark matter’. One of the process was the hot dark matter model/top-down process of galaxy for-mation in which the Universe was dominated by neutrinos in the pre-recombination era and they were relativistic when they decoupled from the primordial plasma. In this model, the small-scale structures formed by the fragmentation of the larger scale structures and galaxies, stars etc formed at relatively later epochs (Doroshkevich et al.,1980a,b). The other process was the cold dark matter model/bottom-up process in which matter was cold, meaning they decoupled from the thermal background once they became non-relativistic. Based on this model, small-scale structures came together to form larger structures by hierarchical cluster-ing and stars, galaxies etc form at much earlier epochs.
The evidence of the accelerating universe from the cosmological distance estimates of Type 1a supernovae (Riess et al.,1998;Perlmutter et al.,1999) lead to the inclusion of the cosmological constant, λ, in the CDM models representing the influence of the ’dark en-ergy’ in the acceleration. In addition, the detailed power spectrum of the fluctuations in the CMB from WMAP (Bennett et al. 2003; Spergel et al. 2003) helped to determine the cos-mological parameters. The latest values of coscos-mological parameters have been determined by the Planck observations of temperature and polarization anisotropies of the CMB (Planck Collaboration et al., 2016) : Hubble constant, H0 = 67.81±0.92, density parameters, Ωλ =
0.692±0.012, Ωm= 0.308±0.012, and age of 13.799±0.038 Gyr.
Thus the λCDM model was widely accepted to explain the current structure formation from the tiny fluctuations in the cold dark matter density distribution, that formed cold dark matter halos through mergers and accretion. These halos provide deep gravitational potential wells driving the baryons to collapse onto them, eventually evolving into structures that we see today as stars, galaxies and clusters. There are still unresolved issues in the λCDM model like the missing satellites problem where the models predict larger number of satellite galaxies than it has been observed around the Milky Way (Klypin et al.,1999).
Now that the general picture of structure formation in the Universe is introduced, I will move on to the different structural components of the Milky Way that are considered to be the relics of the Galaxy’s formation and evolution processes.
1.1. An overview of the Milky Way Galaxy 5
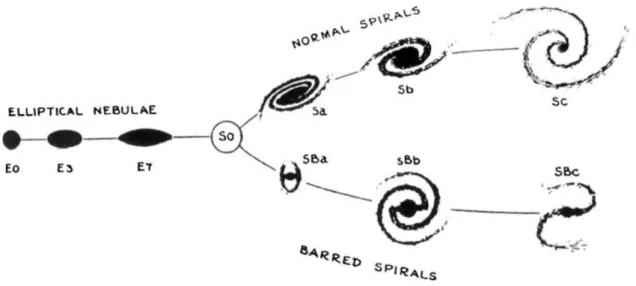
Figure 1.2: The Hubble sequence of galaxies as presented in The Realm of the Nebulae.
1.1.3 Components of the Milky Way
From the observations of the spiral nebulae, Edwin Hubble designed the Hubble sequence or the tuning fork diagram showing the morphological scheme of galaxies in The Realm of the Nebulae(Hubble, 1936), as shown in the Figure1.2. The Milky Way was identified to be a SBb type barred spiral galaxy according to the Hubble sequence.
Currently we know that the Milky Way is one among the two dominant spiral galaxies in the Local Group. The Local Group is a collection of spiral and dwarf galaxies, which in turn is a part of the Virgo supercluster of galaxies. Currently, the Milky Way is also found to be interacting with atleast three satellite galaxies : Sagittarius dwarf galaxy (Sgr), small and large magellanic clouds (SMC and LMC). The total stellar mass of the Milky Way has been estimated to be∼5×10¹⁰ M⊙(Bland-Hawthorn and Gerhard, 2016). This stellar mass
is distributed among four components that resulted from the different stages of the Galaxy’s formation process : halo, bulge, thin and thick disc. These components are considered to be axisymmetric, while bars and spiral arms are two main non-axisymmetric and rotating components of the Milky Way. Figure1.3 shows the rough schematic of the edge-on view of the Milky Way as per our current understanding. The IAU standard for the distance of the Sun from the Galactic center is R⊙=8.5 kpc, while I have used the value of R⊙=8.0 kpc
(Boehle et al.,2016;Gillessen et al.,2017) in this thesis.
In the following subsections, I will give a brief overview of the structural details of the Milky Way components, their approximate morphology and the nature of their encompass-ing stellar populations as inferred from observations as well as comparisons with extensive models.
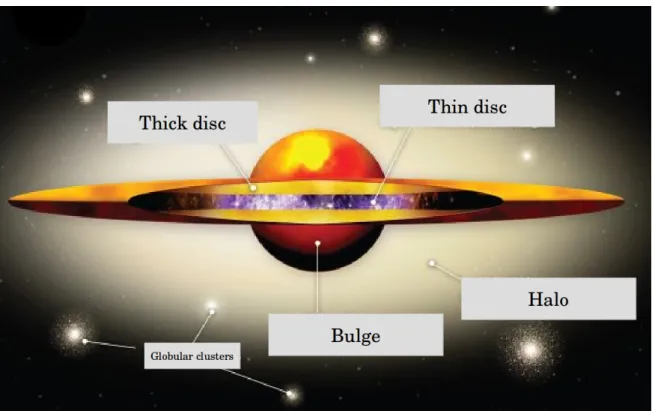
Figure 1.3: A rough diagram showing the components of the Milky Way. Image courtesy : SolSta-tion.com
Halo
The stellar halo of the Milky Way is considered to be one of the oldest components, composed of old stars (RR Lyrae, blue horizontal branch stars etc) moving on eccentric orbits and globular clusters with the metallicities of local halo stars peaking at∼-1.6 dex and extending below [Fe/H]∼-3 dex (Ryan and Norris, 1991). There are also evidences of past mergers of satellite galaxies, in the form of numerous stellar streams and overdensities (Helmi, 2008;
Bell et al.,2008).
In general, the stellar halo is believed to have formed during the initial dissipative collapse of gaseous cloud (Eggen et al.,1962), followed by the subsequent mergers of satellite galaxies (Searle and Zinn,1978). The Milky Way halo can be divided into inner and outer halo based on their spatial stellar distribution, kinematics, chemical abundance distribution, age gradient and their inferred formation scenario. The inner halo has a flattened but smooth structure with stars distributed within 15 to 20 kpc from the Galactic center and∼3 kpc from the Galactic mid-plane. Meanwhile, the outer halo stars show a spheroidal distribution at distances of 20 kpc away from the Galactic center at similar heights as the inner halo. The stars in the inner halo exhibit a slight prograde rotation and exhibit a peak metallicity, [Fe/H] = -1.6 dex while within the outer halo, stars rotate in a retrograde fashion with metallicities peaking at [Fe/H] = -2.2 dex (Carollo et al., 2007; Fernández-Alvar et al., 2015). In addition, an age gradient is observed with the inner halo being older having formed during the dissipative collapse of initial gas clouds and younger outer halo population, formed via mergers and
1.1. An overview of the Milky Way Galaxy 7
accretion of satellite galaxies (Santucci et al.,2015;Carollo et al.,2016;Das et al.,2016). In addition to the field halo stars, old globular clusters have been commonly used in the determination of the above mentioned global properties, to interpret the formation scenarios of the halo as well as to distinguish between the inner and outer halo (Searle and Zinn,1978;
Deason et al.,2011). The estimated mass of the stellar halo from main sequence stars and mass-to-light ratio of globular clusters, within radial distance of ∼45 kpc, is about from 4-7×10⁸M⊙ (Bell et al.,2008;Deason et al.,2011).
Bulge
The Milky Way bulge is located within 3 – 4 kpc from the Galactic center and on average harbors old stars (Ortolani et al., 1995; Clarkson et al., 2008; Rich, 2013; Origlia, 2014;
Ness and Freeman, 2016;Zoccali and Valenti, 2016;Bernard et al., 2018). The estimated stellar mass is around 1.2 – 1.6× 10¹⁰M⊙and constitutes nearly 15% of the total luminosity
(Portail et al.,2015). At the same time, the bulge does not show the spheroidal morphology of the classical bulge, as would have been expected for a structure built through dissipative collapse of a primordial gas cloud or through early mergers. Instead, boxy/peanut shaped (B/P) or X-shaped morphology is exhibited by the stellar populations in the bulge (red clump stars in particular) as revealed by photometric surveys (COBE/DIRBE:Weiland et al. 1994, 2MASS:McWilliam and Rich 1994, OGLE-III:Nataf et al. 2010, VVV:Wegg and Gerhard 2013;Valenti et al. 2016). The X-shape of the bulge gets prominent at a height of 400 pc from the Galactic mid-plane (Nataf et al., 2010;Wegg and Gerhard, 2013;Gonzalez et al.,
2015a) in the form of the bimodal distance distribution of red clump stars representing the near and far-sides of the peanut shaped bulge. Within the bulge, there is a longer and flatter bar oriented at an angle between 20○and 30○with respect to the Sun-Galactic center direction
(Shen et al.,2010;Wegg and Gerhard,2013). The B/P or X-shaped morphology of the bulge is considered to be the manifestation of the stellar bar that evolved secularly after buckling (Combes and Sanders,1981;Athanassoula,2005;Ness et al.,2012;Di Matteo et al.,2014). The bulge stars show multi modal metallicity distribution with [Fe/H] between -1.5 dex and 0.6 dex (Ness et al.,2013a;Rojas-Arriagada et al.,2017;Zoccali et al.,2017) indicating the presence of multiple components of stellar populations. The different proportion of these multiple components with height above the Galactic mid-plane has also resulted in the find-ing of a vertical metallicity gradient (Zoccali et al.,2008b;Gonzalez et al.,2011;Ness et al.,
2013a). The bulge stars are also found to be α enhanced suggesting a rapid chemical en-richment(Zoccali et al.,2017). Meanwhile, the cylindrical rotation exhibited by bulge stars in the outer bulge fields (BRAVA:Kunder et al. 2012, ARGOS: Ness et al. 2013b, GIBS:
Zoccali et al. 2014) have been successfully reproduced using N-body simulations of pure thin-disc models (Shen et al.,2010;Martinez-Valpuesta and Gerhard, 2011;Gardner et al.,
2014;Di Matteo et al.,2015) as the result of secular evolution of disc. Thus, this scenario is able to explain not only the morphology but also the chemical and kinematic properties of bulge stars with [Fe/H]>-0.5 dex to an extent, whereas it is unable to account for the metal-poor bulge ([Fe/H]<-0.5 dex) stars that shows an extended, centrally concentrated spheroidal distribution (Zoccali et al.,2017). However,Di Matteo et al.(2014,2015);Di Matteo(2016);
Fragkoudi et al.(2017) have suggested using N-body simulations that the Milky Way bulge is the result of the mapping of the "thin + thick" disc of the Galaxy into the boxy/peanut-shaped structure and thus also explain the origin of poor stars to be from the thick disc metal-poor population (and see alsoAthanassoula et al.(2016);Debattista et al.(2017) for similar findings using hydrodynamic simulations). To summarise, it can be assumed that the bulge formation and evolution have been very complex with contributions from more than any one of the above mentioned processes. Thus, the Milky bulge is a very active research field ex-plored in detail using observations as well as models. A part of this thesis will be focusing on a comparatively unexplored region of the bulge, the inner bulge (∣b∣<3○), where high dust
extinction prevents optical observations. I will introduce this region in the Section1.3and discuss my work in more detail in the Chapter3.
Disc(s)
The Galactic disc hosts the maximum of the baryonic content in the Milky Way in the form of gas as well as stars located in the spiral arms. The disc mass was estimated to be∼1011M⊙
byKafle et al.(2014) using the kinematic data of K-giant stars from the Sloan Extension for Galactic Understanding and Exploration (SEGUE).
Initial investigations of the disc morphology and structure have been carried out based on the stellar density/star counts and luminosity profiles of disc stars in the vertical and radial directions for the Milky Way as well as external galaxies. Based on the photometric ob-servations of disc stars in the vertical direction towards the North and South Galactic poles (Yoshii,1982;Gilmore and Reid,1983), it was found that an exponential profile could fit the observed stellar density profile but with an extra component to account for the excess of the observed stars/light emission. Thus the disc was decomposed into two components : thin and thick discs, with scale heights of∼300 pc and ∼1450 pc respectively (Gilmore and Reid,
1983). Later,Jurić et al.(2008) refined the scale height of thick disc to∼900 pc based on the density profiles of M dwarfs from SDSS.Bland-Hawthorn and Gerhard(2016) compiled the main papers on the scale height, scale length estimates at R⊙ finding 0.3 ,2.6 kpc and 0.9 ,
2.0 kpc as the scale height and scale length for thick and thin discs, respectively.
However, these classifications into thin and thick discs were purely based on geometry, and it was important to include the abundance as well as kinematic information of the stars in this classification to shed some light on the disc formation and evolution. Thus later studies found the thick disc to be older (Bensby et al.,2005), kinematically hotter (Gilmore et al.,
2002;Kordopatis et al.,2013), more metal poor and enhanced in α abundances (Reddy et al.,
2006;Haywood, 2008;Recio-Blanco et al., 2014) compared to that of the thin disc. Using mono abundance populations of dwarfs in SEGUE,Bovy et al.(2012) showed that the thick disc corresponds to the high [α/Fe], low [Fe/H] population with longer scale height and shorter scale length (∼2 kpc), while the low [α/Fe], high [Fe/H] population with shorter scale height and longer scale length (∼3.6 kpc) represents the thin disc. But the variation of [α/Fe] sequence in the [α/Fe] vs [Fe/H] plane across the disc from inner to outer parts of the Milky Way (Hayden et al.,2015) have shown that the chemical patterns found at the Solar radius are not representative of the whole disc. Very recently, Hayden et al. (2017)
1.2. Galactic archaeology 9
argued that the current chemical definitions of thin and thick discs are misleading as they found significant age overlap of low and high α sequences for main sequence turn off and sub giant stars in the solar neighbourhood. They attribute this to the radial mixing (through churning and/or blurring,Sellwood and Binney 2002;Schönrich and Binney 2009) of stellar populations from inner and outer discs at the solar position as suggested byHaywood et al.
(2013). These results suggests that the thin-thick disc naming convention is valid only in the geometrical context, while the chemical patterns in the [α/Fe] vs [Fe/H] plane suggest the division of disc into inner and outer disc.
An inside-out formation scenario for the disc with old stellar population dominating the inner disc and younger stellar population in the outer disc is supported by observations. Still, the existence of the geometrical thick disc component raises a question about the disc forma-tion and evoluforma-tion. Adhering to the hierarchical structure formaforma-tion in the λCDM paradigm, several external mechanisms have been invoked to explain the thick disc formation : accre-tion of dwarf galaxies and stars from a disrupted satellite galaxy (Statler,1988;Abadi et al.,
2003), minor merger resulting in the heating of pre-existing thin disc (Quinn et al., 1993;
Villalobos and Helmi, 2008) or merger induced star formation (Brook et al., 2004). Inter-nal formation mechanisms like radial migration (Sellwood and Binney,2002;Schönrich and Binney, 2009) and clumpy disc or turbulence dominated disc evolution (Bournaud et al.,
2009) have also been introduced to explain the thick disc.
The disc formation and evolution is not discussed in detail in this thesis. I will focus on the vertical metallicity gradient as well as the metallicity distribution function of the disc stellar population in the solar neighbourhood in the chapter2in the context of Galactic archaeology and related surveys (see Section1.2below)
1.2
Galactic archaeology
As described in the Section1.1.3above, our understanding about the Milky Way formation, evolution, the contribution of various Milky Way components and their exact order of for-mation is still intuitive. Galactic archaeology deals with dissecting the Milky Way into its various components (Freeman and Bland-Hawthorn, 2002) with the objective to disentan-gle processes contributing to the Milky Way formation and evolution. This relies on precise estimation of stellar atmosphere properties of individual stars belonging to different stellar populations that make up each of these components. Stellar atmospheres retain the compo-sition of chemical elements present in the interstellar medium at the time and place of their formation. Their orbital distributions, kinematics and ages are other reliable parameters that encode the evidences about the various physical processes that contribute to the formation and evolution of individual Milky Way components. Thus tracing chemical abundances of individual stars combined with their kinematic properties, ages and current phase-space dis-tribution is an important part of the Galactic archaeology.
Galactic archaeology studies rely on all sky photometric, astrometric and large scale spec-troscopic surveys to measure the detailed properties, i.e., six dimensional phase-space dis-tribution, age and elemental abundances of a large number of stars. We also need stellar
Figure 1.4: A schematic overview showing the logical dependencies between the stellar observables in Galactic surveys (thick dotted ovals) and the main desired parameters for each star (thin dashed ovals). The desired properties of each star include distance from the Sun (D), dust extinction (AV), age
(tage), abundances (Z) and mass (M∗). The basic observables are line-of-sight-velocity (vlos) , proper
motions (µ), parallax (π), multi-band photometry (mλ) and photospheric parameters derived from
spectra (Teff, log g , abundances, Z). Stellar isochrones and stellar atmospheric models are used to
determine the probability of the stellar observables for a given set of desired properties, for which prior probabilities are obtained from our notions about star formation (e.g. IMF), the the Galaxy structure and various constraints on the dust distribution. This model still makes a number of simplifications. Image and caption courtesy :Rix and Bovy(2013)
1.2. Galactic archaeology 11
population synthesis models to account for the target selection biases in these surveys, and chemical evolution models to test various Galactic formation and evolution scenarios. These models in turn depends on our approximate idea about the star formation rate (SFR), star for-mation history (SFH), initial mass function (IMF), age-metallicity relations, isochrones and stellar atmosphere models. A rough schematic overview fromRix and Bovy(2013) is shown in the Figure1.4 describing the way stellar parameters are constrained from observables in Milky Way surveys.
In the following subsections, I will introduce various photometric and spectroscopic sur-veys which have been used in this thesis as well as a few other current and ongoing sursur-veys. A brief description about stellar population synthesis and chemical evolution models are also given.
1.2.1 Photometric surveys
There are many imaging and photometric surveys of the Milky Way covering multiple ranges of wavelengths, that estimate flux density of point sources and provide detailed catalogs. These catalaogs can be used as input photometric catalogs for target selection in comple-mentary Milky Way spectroscopic surveys. In this subsection, I will introduce few surveys that have been used as input photometric catalog for spectroscopic surveys listed in subsec-tion 1.2.2, which in turn have been used for my study involving the selection function in Chapter2. I will also introduce a few mid and near infrared photometric catalogs that are not part of big surveys, but have been used in detail in the Chapters3and 4.
2MASS
The Two-Micron All Sky Survey (2MASS) is an all sky near infrared photometric survey covering JHK bands with 10σ Vega-based limiting magnitudes of J = 15.8, H = 15.1 and K = 14.3 with a spatial resolution of 4" (Skrutskie et al.,2006). Observations were carried out using 1.3 m telescopes at Mt. Hopkins and CTIO, Chile. 2MASS provides full sky coverage (≥ 10,000 square degree) and the 2MASS point source catalogue contains positional and photometric information for nearly half a billion sources (mostly stars). The 2MASS photometric catalog have been used as input catalog for spectroscopic surveys like APOGEE.
SDSS
The Sloan Digital Sky Survey (SDSS) is an imaging+ spectroscopy survey that focused on galaxy evolution, quasars etc, with the photmetric survey covering uptoone quarter of the celestial sphere in the north Galactic cap and a smaller area of ∼225 square degree in the southern Galactic hemisphere (York et al.,2000;Stoughton et al., 2002). Observations are carried out in five optical bands, ugriz, in ABν system with completeness of∼99.3% at the
bright end, dropping down to 95% at magnitudes of 22.1, 22.4, 22.1, 21.2 and 20.3 in u,g,r,i and z respectively with approximate spatial resolution of 1".
VHS
The VISTA Hemisphere Survey (VHS) is a near infrared survey of the southern hemisphere covering an area of∼20,000 square degrees in J and KSwavebands with 5σ Vega-based point
source limits of J = 20.2 and KS= 18.1, resulting in a depth 30 times fainter than the 2MASS
in the same bands and a spatial resolution of 0.339′′per pixel. An area of ∼5000 square
degrees in the South Galactic cap is imaged more deeply including H band with 5σ limits of J = 20.6, H = 19.8 and KS = 18.5 (McMahon et al.,2013). As the name indicates, the survey
is being carried out using the 4.1 m Visible and Infrared Survey Telescope (VISTA) located at the Paranal Observatory in Chile. VHS is used as input photometric catalog for Gaia ESO survey (GES).
VVV
The Vista Variables in the Vía Láctea (VVV) is an infrared variability survey of the Milky Way bulge and a part of the disc, performed at the 4.1 m VISTA in five passbands : Z, Y, J, H, KS (Minniti et al., 2010). VVV provide photometry for 109 point sources, among
which there are 106 expected variable sources with repeated observations over 2010-2015.
Using RR Lyrae stars as distance calibrators, VVV will provide the 3D map of its surveyed region, in addition to variable source detection, search for micro lensing events, estimate dust extinction etc (Saito et al., 2012). VVV is also used in the photometric selection function and ancillary photometric catalogs of the Gaia-ESO survey bulge felds.
Spitzer GLIMPSE and MIPSGAL
Infrared Array Camera (IRAC;Fazio et al. 2004) and Multiband Imaging Photometer (MIPS;
Rieke et al. 2004) are two instruments onboard the Spitzer Space Telescope (Werner et al.,
2004), which is a space-borne telescope with 0.85 m aperture. IRAC obtains simultaneous broadband images at 3.6, 4.5, 5.8 and 8 µm. All four detector arrays in the camera are 256× 256 pixels in size, and the FWHM of the point spread function are 1".6, 1".6, 1".8 and 1".9 at 3.6, 4.5, 5.8 and 8.0 µm, respectively. MIPS covers longer wavelengths with imaging bands at 24, 70 and 160 µm and very low resolution spectral energy distribution (SED) spectroscopy from 52 to 100 µm. MIPS achieves telescope-limited resolutions of 6", 18" and 40" at 24, 70 and 160 µm, respectively.
The Galactic Legacy Infrared Mid-Plane Survey Extraordinaire (GLIMPSE;Churchwell et al. 2009a) is one of the legacy programs of the Spitzer Space Telescope that uses IRAC observations to get a deeper understanding of the physics of interstellar dust, star formation, and the large-scale structure of the Milky Way as traced by stars. GLIMPSE consists of three surveys : GLIMPSE I covering an area of 220 deg2 of the Galactic plane from longitudes∣l∣
= 10○to 65○, GLIMPSE II fully imaging the inner 20○ of the Galactic plane and GLIMPSE
3D extending the GLIMPSE I & II latitude coverage to±3○ at nine selected latitudes and to
±4○ within 2○of the Galactic center.
MIPSGAL (Carey et al., 2009) is another legacy program of the Spitzer Space Tele-scopethat covers 278 deg2 of the inner Galactic plane using the 24 and 70 µm bands of the
1.2. Galactic archaeology 13
MIPS instrument. MIPSGAL provides far-infrared/submillimeter measurements for both point sources and diffuse emission, complementary to their observations in near infrared regime using 2MASS and GLIMPSE.
1.2.2 Spectroscopic surveys
Spectroscopic surveys of the Milky Way focusing on Galactic archaeology mainly observe in narrow spectral bands covering optical to near infrared wavebands chosen depending on their science goals and the area/component of the Milky Way being studied. The spectral resolution and quality of the spectra obtained from these surveys vary depending upon the instruments they use and the time they dedicate for observations respectively. Many of the latest surveys observe multiple targets simultaneously using dedicated multi-fiber observing plates and have dedicated pipelines to carry out spectral data reduction. They also provide final catalogs containing the reduced stellar parameters like effective temperature (Teff),
sur-face gravity (log g) and abundances for various elements (iron peak elements, alpha elements, odd-z elements etc). Below, I will briefly explain various surveys focusing mainly on few spectroscopic surveys whose data have been used in this thesis (see Chapter2)
APOGEE
The Apache Point Observatory Galactic Evolution Experiment (APOGEE;Majewski et al. 2017) is one of the four programs in the Sloan Digital Sky Survey III (SDSS-III; Eisen-stein et al. 2011), which performed a three-year survey of our Galaxy using the Sloan 2.5 m Telescope at the Apache Point Observatory (APO). APOGEE observed in the near-infrared H-band (1.5 µm− 1.7 µm) at high spectral resolution (R ∼ 22500) and high signal-to-noise ratios, S/N (>100). APOGEE was designed to obtain precise and accurate radial velocities and chemical abundances for ∼105 red giant branch stars, red clump stars and asymptotic
giant branch stars in the dust-enshrouded Galactic mid plane and inner Galaxy regions, typ-ically ignored by optical surveys.
The survey made use of the standard SDSS plugplates designed with holes for 300 APOGEE fibers, with∼230 fibers placed on science targets and ∼70 fibers reserved for telluric absorp-tion calibrators and airglow emission calibraabsorp-tion posiabsorp-tions. Each plate has a field of view (FOV) ranging from 1-3○; the number of visits per field varied from 1 to∼24 depending on
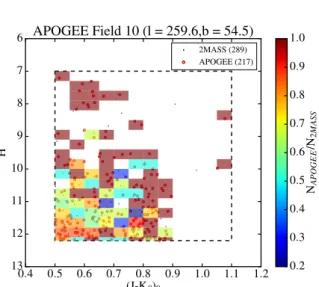
the type and location of the field. The targeting strategy of APOGEE involved grouping of stars into sets based on their apparent H-band magnitudes, called "cohorts", with the aim of obtaining desired S/N for all the stars in the cohort. Cohorts are categorised into short, medium and long in the increasing order of their number of visits. The brightest set of stars belong to the short cohorts, implying fewer number of visits than fainter ones that are in the medium and long cohorts. Each plate is drilled with a "design", made up of a particular com-bination of cohorts, which is associated with only one field (Zasowski et al., 2013). I will explain the color and magnitude cuts used for APOGEE target selection in the Chapter2.
The APOGEE Stellar Parameters and Chemical Abundances Pipeline (ASPCAP;García Pérez et al. 2016) is used to determine the stellar parameters and chemical abundances of up
to 15 elements based on a χ2 minimization between observed and synthetic model spectra.
There have been 5 public data releases of APOGEE starting from DR10 to DR14. In this work, I use the DR13 catalogue of APOGEE.
The APOGEE-2 survey (Majewski et al.,2016) is part of the Sloan Digital Sky Survey IV (SDSS-IV) and a successor to APOGEE, with the plan to observe the Northern (APOGEE-2N) and Southern (APOGEE-2S) hemispheres. The APOGEE-2N survey is carried out by the same telescope and instrument as the APOGEE, while a second observing station, the du Pont 2.5-m telescope at Las Campanas Observatory (LCO) with a similar spectrograph have been used for APOGEE-2S. Thus APOGEE-2 aims to expand the original APOGEE sample in both distance and spatial coverage, in addition to the inclusion of diverse target objects and scientific goals.
RAVE
The RAdial Velocity Experiment (RAVE) (Steinmetz et al., 2006) is a multi-fibre spectro-scopic survey that covers the entire southern celestial hemisphere except at low∣b∣ and ∣l∣. The observations were carried out at the Anglo-Australian Observatory (AAO) in Siding Spring, Australia, using the 1.2 m UK Schmidt telescope. A 6○ field multi-object spectrograph was
used to obtain the spectra in the infrared CaII-triplet region (8410 Å< λ < 8795 Å) with a spectral resolution of R∼7500. Three field plates with 150 robotically positioned fibers have been used in turn for observations.
RAVE was designed to decipher the chemical and dynamical evolution of the Galaxy, using the local dwarfs as well as giant stars. The limiting magnitude of I∼12 limit the most apparently bright targets to the thin and thick discs. RAVE was designed to be a precursor to Gaia, with the RAVE wavelength range matching to that of the Gaia Radial Velocity Spectrometer. In addition to the Ca II IR triplet lines, there are iron, silicon, magnesium and titanium lines that provide an estimate of the alpha element abundance, [α/Fe], as well as overall metallicity, [Fe/H]. RAVE data have been used to advance our understanding of the Milky Way disc (Kordopatis,2014), to estimate the Milky Way mass from extreme high velocity stars (Piffl et al.,2014b), determine the local dark matter density (Piffl et al.,2014a), to detect signatures of radial migration (Wojno et al.,2016) etc.
RAVE provides radial velocities and stellar parameters complementing the surveys that focus on astrometric information. The stellar atmospheric parameters were estimated using the pipeline designed for the RAVE spectra (Kordopatis et al.,2011,2013) making use of the MATrix Inversion for Spectral SynthEsis algorithm (MATISSE,Recio-Blanco et al. 2006) and the DEcision tree alGorithm for AStrophysics (DEGAS). There have been 5 data releases of RAVE providing the stellar atmospheric parameters, radial velocities and individual abun-dances for more than 400,000 unique stars. I use the DR4 version of the RAVE data in this work.
1.2. Galactic archaeology 15
GES
The Gaia-ESO survey (GES) is a ESO spectroscopic survey aimed at targeting ∼105 stars
covering the major components of the Milky way (Gilmore et al.,2012). The observations are carried out using the Fibre Large Array Multi Element Spectrograph (FLAMES) (Pasquini et al., 2002) on the Very Large Telescope array (VLT) in Cerro Paranal, Chile. This fibre facility has a FoV of 25 arcmin diameter for two different spectrographs, GIRAFFE and UVES.
GES was designed to advance our knowledge of the Galactic and stellar evolution by quantifying the kinematic and multi-element chemical abundance distribution functions of the Milky Way components (bulge, halo, thin and thick discs). Blue F stars in the halo, redder F stars in the thick disc and K giants in the bulge fields as well as outer thin disc, warp, flare etc. have been targeted. The Field survey has been carried out mainly with GIRAFFE for ∼105stars to V<20 mag, making use of its two mid resolution setups, HR10 (Ca II IR triplet)
and HR21 (∼540 nm), that include a number of Fe I and Fe II lines as well as lines of several α-elements such as Ca, Mg etc. UVES, with its red (300-500 nm) and blue (420-1100 nm) high resolution setups, have been used in parallel to observe∼104G-type stars to V<15 mag.
GES also observed a significant sample of open cluster populations of all accessible cluster ages and stellar masses. UVES fibers have been allocated to pre-main sequence or zero age main sequence G and K-type cluster members, while GIRAFFE fibers targeted K and M-type cluster members.
The stellar parameters were derived by different nodes (using MATISSE, SME:Valenti and Piskunov 1996and FERRE:Allende Prieto et al. 2006codes for GIRAFFE spectra, and about a dozen different methods for UVES spectra). The final recommended GES parameters come from a careful homogenization and calibration of the different results for a given star. There have been four public data releases of GES, DR1 to DR4, with data from DR4 used in this thesis.
LAMOST
The Large Sky Area Multi-Object Fiber Spectroscopic Telescope (LAMOST) is another ex-tensive ground-based spectroscopic survey of the Galaxy being carried out with the Guo Shou Jing reflecting Schmidt Telescope. It is equipped with 16 low resolution spectrographs capable of recording the spectra of up to 4000 objects simultaneously in a FOV of 5○,
cover-ing all optical wavelengths with a spectral resolution of∼1800 (Cui et al.,2012;Zhao et al.,
2012). The survey contains the LAMOST ExtraGAlactic Survey (LEGAS) and the
LAM-OST Experiment for Galactic Understanding and Exploration (LEGUE :Deng et al. 2012;
Smith et al. 2012), which itself is composed of three separate surveys with different input catalogues and target selection criteria.
Stars have been targeted using bright, medium and faint plates, with limiting magnitudes set at 14≤ r ≤ 16.3, 16.3≤ r ≤ 17.8 and 17.8≤ r ≤ 18.5. Restricted number of faint plates have been observed constrained by the observing condition at the site. The main survey goals include determining the basic stellar parameters of nearly 7 million stars belonging to
thin, thick discs and halo, map out the star density distribution for Galactic disc and halo in multi dimensional phase space, identify possible phase-space substructures and decipher the contributions of mergers and accretion to the Galactic stellar spheroid, measure the local dark matter density in the solar neighborhood etc. (Liu et al.,2015).
The LAMOST survey has collected more than 5 million low resolution stellar spectra and provides basic parameters, including radial velocity, effective temperature, surface gravity and metallicity determined with the LAMOST Stellar Parameter Pipeline (LASP) (Wu et al.,
2011). There have been three public data releases of LAMOST, and I use the data from the DR2 catalog in this thesis.
GIBS
The GIRAFFE Inner Bulge Survey (GIBS) is carried out using the GIRAFFE spectrograph of the FLAMES instrument at the ESO Very Large Telescope (VLT) targeting red clump stars in the Milky Way Bulge (Zoccali et al.,2014). The survey aims top derive the metallicity and radial velocity of bulge stars located in the in the region of Galactic longitude range∼ -10○to
+10○and latitude range∼ -10○to +5○, same as those mapped by the VVV survey. Hence the
targets of 200–400 stars for the 31 fields are selected from the VVV survey catalog. Majority of fields are located at negative latitudes, with only∼5 fields at b = 4○. The LR8 setup ( R∼
6500, centred on the CaT spectral feature at∼ 8500 Å, S/N per pixel ∼ 50) of the FLAMES GIRAFFE have been used for observing stars in all fields except those at b = -4○. The stars in
this latitude fields have been observed with the HR13 setup (R∼ 22,500, centred at ∼ 6500 Å, S/N per pixel∼ 100) to measure iron and light element abundances. The survey continues to give results that have been used to constrain the chemodynamical properties of the Galactic bulge (Gonzalez et al.,2015b;Zoccali et al.,2017)
GALAH
The Galactic Archaeology with HERMES (GALAH) survey is a large-scale Milky Way stel-lar spectroscopic survey designed with the aim of understanding the Galaxy’s history by means of chemical tagging (De Silva et al.,2015). GALAH makes use of the High Efficiency and Resolution Multi-Element Spectrograph (HERMES) at the 3.9-m Anglo-Australian Tele-scope, which provide multi-object (∼392) high resolution (∼28000) spectra. The survey aims to provide elemental abundances for up to 30 elements in four optical windows. The GALAH targets are chosen within magnitude range of 12<V<14 and Galactic latitude ∣b∣ > 10○, with
roughly two-thirds of the targets being dwarf stars and the rest, red giant branch stars located at kpc-scale distances from the solar neighborhood.
GALAH targets are in the magnitude range wherein the Gaia parallaxes and proper mo-tions are accurate as well as complete. Moreover, GALAH will be highly complementary, in terms of different magnitude ranges and regions of the Galaxy observed, to the existing spectroscopic surveys like APOGEE and GES. The latest data release, DR2, provides stellar atmosphere parameters and element abundances for more than 300,000 stars (Buder et al.,
1.2. Galactic archaeology 17
WEAVE
The WHT Enhanced Area Velocity Explorer (WEAVE) survey is a multi-object survey that makes use of the WEAVE spectrograph which will equip the prime focus of the 4.2-m William Herschel Telescope (WHT) at the Observatorio del Roque de los Muchachos, on La Palma in the Canary Islands. This instrument will enable astronomers to observe and obtain optical spectra of up to∼1000 targets over a two-degree field of view in a single ex-posure (MOS). The same field can be observed using 20 deployable mini integral-field units (mIFUs) of 11" × 12", with 1.3" spaxels. Finally, there is a large fixed integral-field unit (LIFU) with a field of view of 1.3"× 1.5" and 2.6" spaxels to study extended objects. The WEAVE spectrograph has two arms, red and blue, offering spectroscopic resolutions of 5000 and 20000 respectively (Bonifacio et al.,2016). The science goals and targets of WEAVE are broad and diverse, some of which are Galactic archaeology, stellar physics, Galaxy clusters, QSOs etc. WEAVE is expected to start operations in 2019.
MOONS
The Multi-Object Optical and Near-infrared Spectrograph (MOONS;Cirasuolo et al. 2014) on the 8.2 m VLT, with it’s 1000 object multiplex capability and medium to high resolution set ups (9000 in the optical and 20000 in the infrared) covering near-IR wavelength range, has Galactic archaeology in the bulge as one of the main science goals. The observations, to start in 2019, will be able to provide accurate radial velocities, metallicities and chemical abundances for bulge stars in highly extincted regions, thus enabling to shed light on the chemo-dynamical characteristics of the bulge.
4MOST
The 4-metre Multi-Object Spectroscopic Telescope (4MOST) is a fibre-fed spectroscopic survey facility on the VISTA telescope with a hexagonal field-of-view of 4 square degrees and ability to simultaneously observe and obtain spectra for∼2400 objects . The fibers will feed one high-resolution (∼20,000) and two medium resolution (∼5000) spectrographs with fixed 3-channel designs and identical 6k× 6k CCD detectors. The science goals of 4MOST are broad ranging from Galactic Archaeology and stellar physics to high-energy physics, galaxy evolution, and cosmology (de Jong et al., 2016). The survey science operations are expected to start in 2021.
1.2.3 Stellar population synthesis models
The observations carried out using various photometric and spectroscopic surveys have given us a global view of the Milky Way and its various components. The data products from these surveys have enabled us to visualise the Milky Way components not only in terms of their star counts/density distributions but also from chemical, dynamical as well as chronological perspective.
Similarly, there have been a progressive increase in the models of the Milky Way, from simple empirical models fitting star counts along few lines of sights to dynamically self con-sistent population synthesis models. Stellar population synthesis models make use of Galaxy formation and evolution scenarios along with various physical assumptions (star formation histories (SFH), initial mass functions (IMF), age-metallicity relations (AMR) etc.) to gen-erate a picture of the Milky Way in different photometric systems. Their prime objective is to compare as well as interpret different observational data currently available and to test the theories on which the models are based. Besançon (Robin et al.,2003) and TRILEGAL (Girardi et al., 2005) are two of the commonly used stellar population synthesis models, while Galaxia (Sharma et al.,2011) provides a numerical framework to create such models, successfully tested for Besançon. These models make use of suitable stellar isochrones that takes into account our knowledge about the stellar structure evolution and link it with the Galactic component properties like SFH, IMF, density profiles etc.
In the following subsections, I will briefly introduce the two stellar population synthesis models, TRILEGAL and Galaxia/Besançon, that have been used to create mock catalogs for certain spectroscopic surveys as explained in the Chapter2.
1.2.3.1 TRILEGAL
The TRI-dimensional modeL of the GALaxy (TRILEGAL) is essentially a Monte Carlo sim-ulation in which stars across small sky areas towards an element of galactic coordinates (l,b) and solid angle dΩ, in a given bin of apparent magnitude [mλ,mλ + dmλ] are generated for
a specific passband, λ, according to the following fundamental equation of stellar statistics (Bahcall,1986):
N(mλ, l, b) = dmλ∫ ∞ 0
dr r2ρ(r)φ(Mλ, r)dΩ (1.1)
Here, r is the line of sight distance, φ(Mλ, r) is the intrinsic luminosity function of the
stars considered at r, ρ(r) is the stellar density as a function of the position r = (l,b,r). r (pc) is related to the absolute magnitude (Mλ), apparent magnitude (mλ) and interstellar absorption
(Aλ) by the formula :
Mλ= mλ− 5logr − Aλ(r) + 5 (1.2)
One major assumption is that ρ or stellar density can be separated into distinct components like that of thin disc, thick disc, halo and bulge. The number of stars in each distance modulus bin is predicted using Equation1.1, and the age, metallicity and mass for each simulated star is obtained from the SFR, AMR and IMF defined for the corresponding component to which the star belongs. The age, metallicity and mass are then used to derive the corresponding absolute magnitude, Teff, log g etc via interpolation in the isochrone grids.
A user interactive mode is available for TRILEGAL, for which the input model parame-ters like IMF, SFR, local surface density of stars etc can be modified. A default version is also provided that is advocated inGirardi et al.(2005). The default IMF is a log-normal function fromChabrier(2001). The thin disc is not locally isothermal (scale height, hd, a function of
![Figure 1.5: The [ α /Fe] versus [Fe/H] plot showing the usual observed pattern followed by stars be- be-longing to different components.The arrows indicate how the IMF and SFR affect the variation of plateau level of [ α /Fe] and the variation of the locat](https://thumb-eu.123doks.com/thumbv2/123doknet/14659446.739385/38.892.127.766.491.956/figure-observed-followed-different-components-indicate-variation-variation.webp)