HAL Id: halshs-01256781
https://halshs.archives-ouvertes.fr/halshs-01256781
Submitted on 18 Jan 2016
HAL is a multi-disciplinary open access
archive for the deposit and dissemination of
sci-entific research documents, whether they are
pub-lished or not. The documents may come from
L’archive ouverte pluridisciplinaire HAL, est
destinée au dépôt et à la diffusion de documents
scientifiques de niveau recherche, publiés ou non,
émanant des établissements d’enseignement et de
Bank Employee Incentives and Stock Purchase Plans
Participation
Thomas Rapp, Nicolas Aubert
To cite this version:
Thomas Rapp, Nicolas Aubert. Bank Employee Incentives and Stock Purchase Plans Participation.
Journal of Financial Services Research, Springer Verlag, 2011, �10.1007/s10693-011-0104-0�.
�halshs-01256781�
Bank Employee Incentives and Stock Purchase
Plans Participation
November 2010
Abstract
We investigate which factors in‡uence 44,649 employees’ decision to invest in a top retail banking group in France. We have two objectives: (i) to explore factors associated with the amount invested in the plan, and (ii) to explore whether these factors have same associations with the probability of investing more than the incentive pay i.e. being an active investor. Speci…cally, we focus on four parameters that have been shown to a¤ect participation: liquidity constraints, imperfect knowledge of the plan, asset choice, and transaction costs. We con…rm Engelhardt and Madrian (2004) assumptions according to which such factors contribute to explain non-participation. We show that ESPP contributors have very speci…c and unobserved motivations, as shown with the positive correlations between error terms in the two steps of investment decisions. The existence of unobservable investment motives can be explained by a lower risk aversion, a higher time preference, or a strong willingness to participate to corporate governance.
Thomas RAPP* & Nicolas AUBERT**
*Université Paris V Descartes
1
Introduction
Over the last decades, incentive pay arrangements have become a widespread phenomenon. In the United States, it has been estimated that 38.7 million employees are concerned by such schemes, representing approximately 20% of private sector employees (National Center for Employee Ownership, 2010). In France, the number of employee stock owners has increased from 700,000 in 1998 to 2.7 millions in 2007 (French Employee Ownership Association, 2009). This increased success has been driven by a permanent support from companies’ executive managers and governments (Kruse, 2002). For instance, incentive pay schemes that are usually bundled with ESPPs have a major in‡uence on investment decisions. Usually, tax-free accruals of interest and tax-deductions are given for all contributions corresponding to an allocation of incentive pays. Moreover, companies usually provide matching contributions when employees invest in ESPPs, which have been shown to increase employees’ participation (Huberman et al, 2007).
While there has been a large interest in company-based plans savings be-haviors, few research articles were dedicated to the exploration of investment behaviors in ESPPs. Engelhardt and Madrian (2004) explain that in addition to risk aversion, four main factors can in‡uence the decision to participate or not in ESPPs: liquidity constraints, imperfect knowledge of the plan, asset choice, and transaction costs. Non-investors would have a lower income, a lower access to ESPPs-related information, a lower willingness to invest in company stocks, and would face higher behavioral biases such as procrastination and self-defeating behavior. According to Engelhardt and Madrian (2004), these four characteristics distinguish investors from non-investors. However, Engelhardt and Madrian (2004) do not test empirically these assumptions. To our knowl-edge, the in‡uence of these factors on investors’ behaviors in ESPPs has not been studied from an empirical perspective. Moreover, the relationship between incentive pay mechanisms and ESPPs remains unclear. Among investors, two main behaviors can be identi…ed. On the one hand, some employees choose to
invest an amount that is lower or equal to their incentive pay. For these employ-ees, ESPPs investment may represent a way to increase their after tax income through deductions. On the other hand, some employees choose to invest more than their incentive pay, e.g. allocate to company stocks money that does not come from their job compensations. These latter employees make an arbitrage in favor of their company stocks within their overall wealth. Currently, there is no evidence that these factors will have the same associations with the deci-sion to be an "active" investor, e.g. invest more than their incentive pay. For these "active" ESPPs investors, investment motivations may be di¤erent. Their willingness to become an employee owner or to save for the future may be very important in the decision process.
In this paper, we explore the association between ESPPs investment deci-sions and incentive pay mechanisms. Speci…cally, we study whether liquidity constraints, imperfect knowledge of the plan, asset choice, and transaction costs have same associations with the amount invested in ESPPs and the decision to become an "active" investor, conditional on participation. We identify char-acteristics associated with a higher probability of participating in ESPPs, and higher level of investment in ESPPs, conditional on participation. We distin-guish "active" investors (who invest more than their incentive pay and/or up to the threshold) from other investors. We consider that investment decisions results from a two-step decision process : employees simultaneously decide to participate in the o¤er (or not) and how much to participate.
The determinants of ESPPs participation are relatively understudied, due to the lack of availability of appropriate data. Much of the literature has focused on relatively small datasets and/or US data. This paper uses an original a cross-sectional dataset describing investment decisions of 44,649 employees of a large French bank who were eligible to ESPPs investments in 2005.
We …nd that several proxies describing the presence of liquidity constraint, knowledge of the plan, asset choice, and transaction costs are associated with dif-ferences in the probability of investment in ESPPs, and the conditional amounts invested. We also …nd the presence of a signi…cant association between the two
steps of the investment decision process: investment choice (yes vs. no) and how much to invest.
The remainder of the paper is organized as follows. Section 2 reviews the relevant literature on employees’investment behaviors. Section 3 describes the methods used and section 4 reports the results obtained. Section 5 presents a discussion of our empirical results, and section 6 concludes.
2
Literature Review
Our paper aims at investigating the factors associated with ESPPs participa-tion. Speci…cally, we explore the association between the presence of liquidity constraint, imperfect knowledge of the plan, asset choice and transaction costs with the decision to invest and the level of employee’s investment decisions.
2.1
Liquidity constraint
Several factors can be used to control for the presence of liquidity constraints. Degeorge et al (2004) show that labour income and …nancial wealth are major determinants of participation in France Telecom’s ESPPs. Liquidity constraints can be driven by labour income, which depends on human capital. Aubert and Rapp (2008, 2010) show that some human capital proxies such as educa-tion and seniority are associated with investment decisions in company-based savings plans. The current value of human capital is often modeled as a func-tion of the current labor income, its rate of growth, and the temporal horizon during which it will be paid. According to Jappelli (1990), the probability of facing liquidity constraints is a decreasing function of age, wealth and current income. Moreover, Jappelli and Pagano (1998) show that household credit and mortgage can be used as indicators of liquidity constraints. The nature of the job contract (permanent or temporary) may also a¤ect investment in ESPPs since unemployment threats may motivate investment decisions of risk averse employees who wish to cover themselves against future risks. Huberman et al. (2007) show that plan participation increases with compensation, and that
matching contributions have higher impact on poorest employees. This result can be explained by the fact that low-income employees are more likely to face liquidity constraints and are therefore more sensitive to matching contribution mechanisms.
2.2
Imperfect knowledge of the plan
Engelhardt and Madrian (2004) emphasize how ESPPs imperfect knowledge can result in non-participation, because some employees may face troubles to understand the plan’s features and make uninformed decisions on participation. Previous research (Engelhardt and Madrian, 2004; Degeorge et al, 2004) pro-vide epro-vidence that communication dealing with ESPPs within the …rm may be critical and that ESPPs-related information are usually lacking. Engelhardt and Madrian (2004) explain that …nancial seminars are usually given to pro-vide 401(k) plan information, leaving little time to ESPPs-related information. Poterba (2003) suggests that most employers should develop education seminars to improve employees’ education on risks, returns and diversi…cation or hand out informed consent forms for employees whose savings are highly concentrated in company stocks. Finally, …rms can a¤ect employees’investment decisions in their company stocks (see Benartzi et al (2006) for a review). Aubert and Rapp (2010) underline that employees’risk exposure in company-based saving plans may become problematic if employers play an important role in investments process.
2.3
Asset choice
Another reason for non-participation discussed by Engelhardt and Madrian (2004) is the availability of company stocks outside ESPPs. According to Engel-hardt and Madrian, employees may not see ESPPs as an opportunity to increase their gross compensation, but rather as a mean to incorporate company stocks into the overall savings portfolio. To investigate this explanation, they exam-ine the relationship between the receipt of stocks options and participation in ESPPs. But they …nd little support that participation in ESPPs decreases
when company shares are available elsewhere through stocks options. Benartzi and Thaler (2001) explain that investors may distinguish company stocks from other assets, e.g. consider ESPPs as separate investment options. Huberman et al (2007) …nd that 401(k) savings rate increase when company stocks is of-fered as an investment option especially among low-income employees. Poterba (2003) underlines that the potential costs of poor diversi…cation due to massive investments in company stocks is concerning.
2.4
Transaction costs
Engelhardt and Madrian (2004) …nally mention procrastination as a potential cause of non-participation in ESPPs. Procrastination is a particular type of self-control problem investigated by Thaler and Shefrin (1981). In standard time value of money calculation, one dollar saved today would be perceived to be worth exponentially more in decades from now. On the contrary, pro-crastination means that individuals are hyperbolic discounters applying high discount rates to the near term and lower discount rates to the future (Mitchell and Utkus, 2004). In the French context, this e¤ect may be higher since par-ticipants’ contribution to ESPPs must be frozen during a 5-year period. This restriction does not apply to American ESPPs participants who are allowed to sell out the shares the same day they buy them. Other transaction costs may be associated with investing in ESPPs. According to Degeorge et al (2004), search costs deterred employees to invest in ESPPs o¤ered by France Telecom in 1997. This cognitive cost includes the time and e¤ort of analyzing and understand-ing the rules of ESPPs. The transaction costs may also result from switchunderstand-ing money from an existing savings plan provided outside the company to the spon-sor’s plan. Gale and Scholz (1994) explain that this cost is less burdensome for richer employees.
2.5
Motivations for exploring ESPPs investment
behav-iors
The di¢ culty with exploring investment behaviors in ESPPs has been described in previous research (Aubert and Rapp, 2008, 2010). From a theoretical per-spective, the challenge arises from the fact that ESPPs introduce a correlation between the risks associated with working and saving contracts. This corre-lation between human capital and portfolio risks is absent in most theoretical models of expected utility. Such models usually consider that risks associated to human capital and …nancial portfolio are independent. However, this assump-tion cannot be applied in the case of ESPPs investment because employees are supposed to buy their company stocks.
Another explanation of potential divergence between theory and empirical evidence comes from the existence of bias in savers’economic rationality. Stan-dard saving and consumption models describe investment behaviors using two parameters of preferences: risk aversion and time preference. According to the theory, savers prefer ‡exibility, i.e. the possibility to proceed to portfolio adjustments (Kreps, 1979). The reliability of both parameters is debated by the behavioral approach. Investors can hardly follow coherent saving strategies based on their lifecycle because of two main reasons (Benartzi and Thaler 2004; Madrian and Shea 2001). First, some savers are not foresighted, and cannot plan their long term …nancial resources. Second, some households are impatient and cannot respect their own saving rules. These households display strong prefer-ences and need for current income. Since investments in ESPPs are constrained by early withdrawal restrictions, they may be more attractive for foresighted but impatient agents who wish to self-control (Thaler and Shefrin, 1981). However, potential threats involving the correlation between human capital and portfolio risks may discourage risk-averse investors. Instead of trying to reshu- e their assets in order to balance risk and performance, some savers may retain the same investment patterns over time, even if it leads them to face huge portfolio risks. Such rigid saving patterns may result from inertia behaviors (Benartzi
and Thaler 2002).
3
Methods
3.1
Data
Our sample is an original dataset collected in August, 2005 from a French CAC 40 index listed bank. Data were collected after this bank o¤ered to its employee the opportunity to invest in ESPPs in June, 2005. Our data describe employees’ response to that o¤er. Similar o¤ers occurred in this company in 2001 and 2003. The eligibility was extended to all employees that had been hired at least two months before the o¤er occurred, and to retired employees. Eligible employees were able to invest up to 25% of their gross compensation to purchase their company stocks at a price equal to 85% of its fair market value. ESPPs investors become shareholders of the …rm they work for.
Incentive pay and sponsors’ plans contributions were bundled, and framed by four main rules. Employees had to choose between getting the incentive pay in cash and have it included in their taxable income; or having the money put into the plan and excluded from their taxable income. Amounts invested in ESPPs were blocked for a 5-year period until 2010. Early-withdrawals were possible under speci…c conditions such as lay-o¤, divorce or bankruptcy. Com-pany stocks could not be sold until 2010. The maximum amount each employee could contribute to the o¤er was e40,000.
3.2
Sample characteristics
Our sample includes 44,649 employees eligible to ESPPs investments in 2005. Contributors’socio-demographic characteristics include age, tenure, hierarchical rank in the bank, gender, type of contract (permanent or temporary), education, and place of residence. We also have information on the bank’s department each employee works for. Financial information includes incentive pays earned in 2005, annual gross salary, contributions in ESPPs in 2005, and the employees’ ESPPs investments before 2005. We exclude 1,287 employees who have missing
values regarding their hierarchical rank in the bank. Our …nal sample consists of 43,362 employees eligible to the o¤er
3.3
Model speci…cation
Our objectives are to explore whether liquidity constraints, imperfect plan in-formation, asset choice, and transaction costs are associated with (i) amounts invested in ESPPs and (ii) the probability of being an "active" investor, con-ditional on participation. Because of non-randomness of participation choices, our analyses may face the presence of selection bias. As ESPPs investments introduce a correlation between employees’ human and …nancial capital they are more risky than other …nancial investments. It can therefore be assumed that ESPPs contributors have a lower risk aversion than non-investors.
3.3.1 Determinants of amount invested, conditional on participation Since we have data on participants and non-participants, we address potential selection bias problems using the Heckman’s two-steps procedure (Heckman, 1979). The …rst step of the model can be written as:
pi= I(zi + vi> 0) (1) The I(:) function equals 1 if the employee i invests in the o¤er and is zero otherwise. We assume that the error terms in the selection equation, v, has zero-conditional mean and follows a standard normal distribution.
The second step of the model is given by:
log(yi) = xi + ui (2) We observe log(yi) if pi= 1:The equation (2) can be written as:
E[log(yi)jpi= 1; xi] = xi + u (zi^) + ui (3) where u is the standard error of the disturbance u, and (:) is the inverse Mills ratio (IMR). The IMR is estimated as the prediction of the binomial probit (1) in the …rst step and used as an explanatory variable in the second step. The
second step uses an Ordinary Least Square (OLS) linear regression where the dependent variable is the logarithm of invested amounts.
The selection function has a set of explanatory factors zithat are a superset of xi: Indeed, Wooldridge (2009) explains that two-steps regressions need a vari-able that is associated with selection (decision to invest or not) but that is not associated with amounts invested. This exclusion restriction is recommended as the IMR can be highly correlated with the elements of xi. In that case, it would be very di¢ cult to separate sample selection from misspeci…cation. To prevent potential multicollinearity problems between the IMR and other covariates, we control for one more right-hand side variable in the …rst ste than in the second step. This identi…cation variable represents mean ESPPs investments in former o¤ers per department. It is relevant for the choice to invest or not in ESPPs, as it can be assumed that employees working in departments with investments in former ESPPs have a higher probability of participating in new o¤ers (Du‡o and Saez, 2002). This variable is not associated with the level of investment. 3.3.2 Determinants of being an "active" investor, conditional on
par-ticipation
To determine the probability of being an "active" investor, we use a binomial probit model with selection (Van de Ven and Van Pragg, 1981). The formulation is written as: y1 = x1 1+ u1 y2 = x2 2+ u2 (4) u1 u2 N 0 0 ; 1 1
where latent variable y1, which measures whether the employee invests more than his incentive pay, or up to the e40,000 participation limit, depends on factors x, and the binary outcome y1= 1 arises when y1 > 0:
In this model, y1i is observed only when the selection equation has a value of 1, e.g. when the employee participates in ESPPs:
The potential correlation between the error terms of the two equations is measured with the parameter . Rejecting the null hypothesis for indicates the presence of selection, e.g. a dependence across estimated equations. In the …rst step, we control for an identi…cation variable measuring the mean number of investors in the o¤er per department. This variable is associated with the probability of investment in the o¤er but it is not associated with the probability of being an "active" investor. Finally, the signi…cance of interaction terms in Probit models is measured using likelihood ratio (LR) tests.
3.3.3 Variables
Our independent variables of interest are factors describing the presence of liq-uidity constraint, knowledge of the plan, asset choice, and transaction costs. The set of individual characteristics included in our models are therefore related to these four factors. Liquidity constraint is measured by gross income (continu-ous, in logarithm), incentive pay (continu(continu-ous, in logarithm), and the presence of a permanent contract (vs. temporary contract). We create a proxy vari-able to measure whether employees have a position within the human resources department, which is in charge of implementing ESPPs. This proxy captures information dealing with the knowledge of the plan. We also control for a vari-able measuring the number of previous o¤ers to which employees were eligible in the past (two ESPPs occured before 2005). This variable allowed us to capture additional information dealing with ESPPs knowledge, assuming that employ-ees with previous eligibility had better knowledge. To measure the in‡uence of asset choice on the investment decision, we create a continuous variable indicat-ing the proportion of the plans sponsored by the company (includindicat-ing previous ESPPs and the company savings plan) invested in company stocks. Transac-tion costs, e.g. indirect cost of understanding ESPPs rules is measured with a variable describing …nancial expertise. This variable is a proxy that measures whether the employee has a job requesting …nancial knowledge within the bank: investment department, asset management department, insurance department, private equity department, and …nance department.
We also control for additional socioeconomic characteristics that have been shown to be associated with investment behaviors. Most of these variables can be associated with at least one of the four investment factors described above. We create a continuous variable indicating the di¤erence between 2005 and employees’ hiring date (tenure). Potential gender di¤erences are studied using a dichotomous variable whose value was 1 if the employee was a man, and 0 otherwise. The variable education is a dummy variable which value is one if the employee holds a Masters’Degree, and 0 otherwise. A dichotomous variable measured employees’hierarchical rank (> 6; range 0-10) in the company. The Masters’Degree variable measures general skills, when …nancial knowledge, hi-erarchical level, and nature of the job are three variables that capture speci…c skills. We control for a variable describing whether the employee is living in the Paris area (vs. living in other part of France). Indeed, Balligand and Fou-cault (2000) show that employees in the Paris area have a higher probability of holding company stocks.
Finally, we control for three interaction terms: Age Age captures potential non-linearity of investment with age, T enure Age measures the interaction between tenure and age, and M ale P aris captures interactions between residency and gender. Signi…cance of these interaction terms in non-linear regressions are estimated with likelihood ratio tests.
3.4
Sensitivity analyses
Sensitivity analyses explore how endogeneity biases could in‡uence our regres-sion results, and focus on potential multicollinearity issues. Variables such as education, type of contract, salary, and incentive pay are likely to be simulta-neously determined with investment. These variables are determined by unob-servable factors such as ability or risk appetite, which are likely to be correlated with error terms in our regressions, raising problems of omitted variable biases. To deal with such problems, we tried to identify a set of instrumental variables that were associated with endogenous variables but independent from the error term. However, we were not able to …nd satisfactory instruments. We
there-fore decided to present for each model two di¤erent regressions using sets of variables that included: (ii) only the variables that are safely exogenous (age, Paris region, male, and interaction terms), and then (ii) the variables for which endogeneity can be suspected.
Many of the variables that are determined by ability are likely to be collinear. For instance, education, wage, and tenure could introduce multi-collinearity. Potential problems of multicollinearity between independent vari-ables are assessed using the Variance In‡ation Factor (VIF). Test values are high in regressions that controlled for interaction terms. However, our postestima-tion tests provide evidence that all VIF values are lower than 3 when we exclude these terms. According to Craney and Surles (2002), multicollinearity problem arises beyond a VIF value of 10. Consequently, such a problem is only driven by the presence of interacted variables. We ran additional regressions without these terms, which provided similar results for all variables (only the sign of the coe¢ cient associated with age changed), and concluded that multicollinearity issues do not a¤ect our results. To provide an idea of how severe the multi-collinearity issue is, we provide a correlation matrix among all right-hand side variable. In additional sensitivity analyses (not reported in the paper but avail-able upon request), we ran regressions that controlled for these variavail-ables one by one, in order to get additional information of how severe the multicollinearity issue is in our models. Finally, we ran the models without and with the inverse Mills ratio in order to be able to check the direction of the bias when selection is not controlled for, and we ran models where the age and tenure variables were broken into dummies, to further assess potential non-linear e¤ects with these variables (not reported in the paper but available upon request).
4
Results
4.1
Descriptive statistics
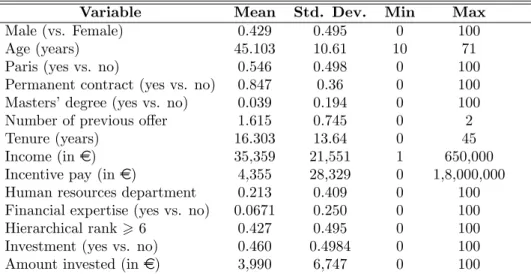
Table 1 provides descriptive statistics of the 43,362 employees of our sample. Among them, 42.93% are men, mean age is 45.10 years (SD: 10.61), 54.62% live
in the Paris region (SD: 8.04), 84.69% have a permanent contract (SD: 36.01), and 3.92% hold a Masters’Degree (SD: 19.41). Mean tenure is 16.30 years (SD: 13.64), the mean number of previous ESPPs o¤ered to these employees is 1.61 (SD: 0.75), and 35.00% (SD: 31.68%) of the company based savings is invested in company stocks. Mean gross income and incentive pay are respectively e35,360 (SD: 21,552) and e4,356 (SD: 28,330). Among the employees of our sample, 21.31% (SD: 40.95) hold a position with privileged access to ESPPs information, 6.71% (SD: 25.02) have better …nancial expertise, and 42.70% are in the upper hierarchical categories. Finally, less than half of the sample invested in ESPPs (46.02%, SD: 49.84), with a mean invested amount of e3,990 (SD: 6.747).
4.2
Bivariate analyses
Table 2 reports results of bivariable analyses comparing characteristics of in-vestors vs. non-inin-vestors, and "active" inin-vestors vs. regular inin-vestors. Inin-vestors (19,957 employees representing 46.02% of total) have di¤erent characteristics than non-investors (53.98% of employees). They are more likely to be male, to be younger, to live in the Paris region, to hold a permanent contract and to hold a Master’s Degree. Investors are also richer than non-investors: they have greater gross income (respectively, e41,838 vs. e29,837) and they receive larger incentive pay (respectively; e7,217 vs. e1,916). Finally, investors are more likely to have invested in previous ESPPs, they have better …nancial ex-pertise, and they are better hierarchically ranked. In Table 2, we also compare "active" investors (40.28% of investors) to employees who invest an amount smaller than their incentive pay (59.72% of investors). "active" investors are more likely to be male, to be younger, to live in the Paris region, to have higher tenure, to hold a Masters’Degree, to have invested in previous ESPPs, and to have greater gross income and incentive pay. "active" investors are also more likely to have invested in former ESPPs, they have a better access to the 2005 ESPPs information, a better …nancial expertise and a higher hierarchical rank in the company.
4.3
Correlation matrix
Table 3 describes the correlation matrix of all independent variables selected in our analyses. Large correlations involve age, tenure, permanent contract, and the number of previous ESPPs employees were eligible to. Income and incentive pay are highly correlated with gender, living in the Paris region, and education. The human resource variable is correlated to age, permanent contract, income, and tenure.
4.4
Factors associated with the conditional amounts
in-vested
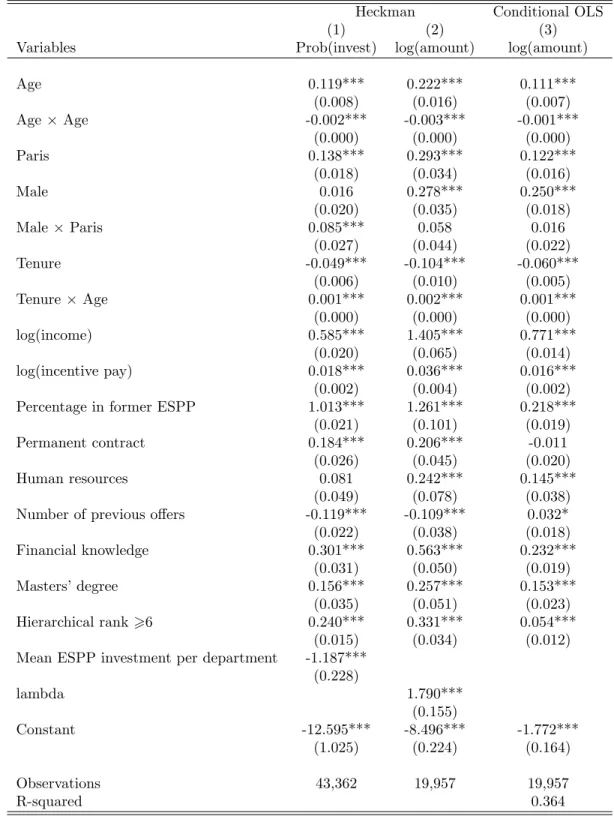
Tables 4 and 5 provide results obtained after Heckman (columns (1) and (2)) and conditional OLS regressions (column (3)). Our variables measuring the presence of liquidity constraint (income, incentive pay, and tenure) have posi-tive and signi…cant associations with the probability of investing in the o¤er, and the conditional amount invested. Knowledge about the o¤er, when mea-sured with human resource department occupation, is not associated with the probability of investing in the o¤er, but it is signi…cantly associated with the conditional amount invested. However, the variable measuring the number of previous o¤ers to which employees were eligible in the past has a negative as-sociation with the probability of investing in ESPPs, and with the conditional amount invested (Heckman). The variable describing asset choices through the percentage invested in previous ESPPs has a positive and signi…cant association with both the probability of investing in the o¤er and the conditional amount invested. The absence of transaction costs, measured with the variable describ-ing the presence of …nancial knowledge, has positive and signi…cant associations with the probability of investing in the o¤er, and the conditional amount in-vested. Other factors signi…cantly associated with the probability of investment and with the conditional amount invested are: tenure (+), male (+), Masters’ Degree (+), and higher hierarchical category (+).
4.5
Factors associated with the conditional probability of
being an "active" investor
Tables 6 and 7 report results from Heckprob regressions (columns (1) and (2)) and the probit regressions (column (3)). Two variables measuring the pres-ence of potential liquidity constraints (income and tenure) have a signi…cant positive association with the conditional probability of being an "active" in-vestor. However, we …nd evidence of a negative association between incentive pay and the conditional probability of being an "active" investor. In the Heck-prob model, privileged knowledge about the o¤er, measured by the variable describing whether the employee works in the human resource department, is not signi…cantly associated with the conditional probability of being an "active" investor. However, this variable is signi…cant at the 10% level in the conditional probit model (-), and eligibility to former o¤ers has a negative association. Employees who invested in former o¤ers (and do not face Access choice limi-tations) have higher probability of being "active" investors. In the conditional probit model, employees with lower transaction costs, e.g. with better …nancial expertise, have a lower probability of being "active" investors. Other factors associated with the conditional probability of being an "active" investor are: age (+), gender (+), tenure (-), Masters’ degree (+), and higher hierarchical category (+). Finally, our interaction terms (T enure Age; M ale P aris) have positive and signi…cant associations with the probability of investing in ESPPs and the conditional probability of being an "active" investor.
5
Discussion
Originally, ESPPs were introduced in France to provide an opportunity to em-ployees to get involved in their …rm’s management. Emem-ployees who participate in these plans are allowed to elect board employee directors. Over the past decades, shareholding has increased a lot in France (+10% between 1997 and 2007) and ESPPs have become very popular. Previous research (Arrondel and Masson, 2007) provided evidence that French shareholders have speci…c
pro-…les: they work in the private sector, have a high-level of quali…cation, and belong to an older part of the population (50-59 years old). Our results must be interpreted regarding to that speci…c context.
5.1
Main …ndings
We …nd a positive association between amounts invested and education level: compared with other employees, employees holding an Masters’ Degree have higher ESPPs investments. It can be argued that our education variable is based upon the degree observed and only captures general human capital information. However, additional variables (hierarchical rank and tenure) that capture spe-ci…c skills also have a positive association with ESPPs investments.
We …nd the presence of a novelty e¤ect: savers invest larger amounts if they have never had an access to ESPPs. However, this e¤ect is tempered by the fact that employees who already invested in previous ESPPs had higher amounts in-vested and higher probability of being "active" investors. Age has an important association with investment decisions. Oldest employees may adopt o¤ensive investment patterns because retirement is an early withdrawal motive. Results for the cross-variable between age and tenure shows that this e¤ect is blurred by age, that is, the e¤ect of time with the company diminishes with age. As em-ployees reach retirement age, they are able to withdraw funds without penalty, even if they have participated in the o¤er soon before they leave. Employees who have been working for a long time in the …rm are aware of tax bene…t resulting from an investment in ESPPs. Their learning-by-doing background leads them to maximize the gain linked to tax bene…t. Moreover, employees who have spent more time in the bank may be more concerned by corporate governance issues.
The positive relationship between permanent contracts and investment be-haviors shows that risk on labor income seems to deter employees to invest in their company stocks. This result di¤ers from previous researches on French data underlining the existence of a positive correlation between job uncertainty and investment in stocks (Arrondel and Masson, 2007). As one of ESPPs goals is
to associate employees with the company’s development, it can be assumed that employees who hold permanent contract are more likely to involve in corporate governance.
The presence of signi…cant correlation between error terms obtained in 2-steps regressions con…rm that unobserved variables have a huge in‡uence on investors’ choices. There are two possible economic interpretations of this re-sult, which come from the in‡uence of two factors that are usually very di¢ cult to observe in empirical studies. The signi…cant Heckman’s lambda can be in-terpreted by the fact that ESPPs investors have a lower risk aversion than non-investors, which in‡uences the amounts of wealth they decide to allocate to these plans. Moreover, …nding signi…cant correlations between both steps may re‡ect di¤erences in time preference between investors and non-investors. Some investors may have lower time preference than non-investors and may therefore be more likely to choose investments that are blocked for a 5-year period.
5.2
What determines non-participation?
Our results con…rm Engelhardt and Madrian (2004) assumptions according to which liquidity constraints, imperfect knowledge of the plan, asset choice, and transaction costs contribute to explain non-participation. Our results also show that ESPPs contributors have very speci…c and unobserved motivations, as shown with the positive correlations between error terms in the two steps of investment decisions. It can be assumed that ESPPs investors di¤er from other investors because they have a strong motivation to buy their own com-pany stocks: the opportunity to participate in the corporate governance. Some employees may choose to invest because they are concerned by the company’s management. In this case, investment would reveal another aspect of people’s aversion. Cohen (2008) suggests that being loyal employees a¤ects employees’ investment decision about their company stocks in 401(k).
5.3
Limitations
Our paper has several limitations. We were not able to measure matching con-tributions and the amount of tax-deductions, which have been shown to have im-portant in‡uence on investment behavior. Gale and Scholz (1994) and Benartzi (2001) provided evidence that matching contribution mechanisms are associated with increased investments in company-based saving plans. We were not able to measure the association between tax incentives that are bundled with incentive pays investment and investment behaviors. It is likely that non-participants have lower interest in tax-incentive associated with ESPPs investments due to the level of their overall taxable income. However, previous research has showed that the relationship between tax incentives and saving behaviors is uncertain (Börsch-Supan, 2004). According to Engen and Gale (1997), tax incentives in ESPPs can sometimes be lower than tax incentives found in other investment plans. Hausman and Poterba (1987) show that tax incentives could actually be associated with a slight decrease in private savings.
This paper uses cross-sectional dataset collected in 2005, after the com-pany’ stocks prize has increased during four consecutive years. This may be a limitation of our …ndings since Benartzi (2001) found that past returns are key determinants of employees’investment in their company stocks. Future re-search may ideally use panel-data controlling for stocks price historical returns or focus on cross-sectional data collected during the context of a bear market. Our data were collected in a …nancial institution. It can be assumed that em-ployees working in a¢ liates such as investment bank, funding bank, and private equity bank have a good …nancial knowledge. This feature may explain why in our sample human capital is positively correlated with investment in ESPPs. Indeed, studying a bank implies that most employees have a good basic knowl-edge of …nance, so the interpretation of some variables is less straightforward. Speci…cally, higher tenure could be associated with better …nancial expertise. Moreover, we …nd that employees with …nancial expertise have a lower prob-ability of being "active" investors. Such employees have doubtlessly access to
information dealing with much more lucrative …nancial products o¤ered by their company such as stocks options. This result can be explained by the assumption of bounded rationality. Employees who have strongest …nancial knowledge may choose not to invest in ESPPs because they can …nd less constraining investment opportunities and a better diversi…cation of risks. Because of the speci…city of our sample, our results may not be generalized to other companies.
6
Conclusion
This paper provides an innovative study of ESPPs contributors’ investment strategies, distinguishing "active" investors from other investors. This approach allows comparing two di¤erent investment behaviors that are associated with the willingness of investing in company stocks. We test Engelhardt and Madrian (2004) assumptions about the determinants of non-participation. Liquidity con-straint is measured by gross income, incentive pay, and tenure. In order to assess the employees’knowledge of the plan, we identify which department of the com-pany each employee belongs to and how many ESPPs they have been eligible to. Concerning the asset choice, we know how much employees contributed to ESPPs investments in the past. Finally, we make the assumption that transac-tion costs are lower for employees holding a job requiring …nancial expertise.
We …nd that the presence of liquidity constraint, imperfect knowledge of the plan, asset choice, and transaction costs are related to the investment deci-sions. Speci…cally, employees facing liquidity constraints are less likely to invest in ESPPs. Knowledge about the plan is positively associated with the will-ingness to invest: employees who work in the company’ department in charge of organizing ESPPs have a greater probability of investing in the o¤er, and a greater probability of becoming an "active" investor. Employee owners have higher probability of being "active" investors, showing that asset choice is asso-ciated with investment decisions. Finally, lower transaction costs are assoasso-ciated with higher investment probabilities, higher conditional amounts invested, and higher conditional probability of being "active" investors.
We …nd the presence of a novelty e¤ect, as the largest amounts invested were by employees who have not already been eligible to previous o¤ers. The existence of unobservable motives of investment can be explained by a lower risk aversion, a higher time preference, or a strong willingness to participate to corporate governance. We underline that some investors may only be motivated by a short-term interest, or the willingness to prepare themselves to future risks such as unemployment.
References
[1] Arrondel L, Masson A (2007), Inégalités Patrimoniales et Choix Individu-els. Economica, Paris.
[2] Arrondel L, Masson A (2005), Préférences face au risque et à l’avenir : types d’épargnants. Revue Economique 56:393-416.
[3] Aubert N, Rapp T (2008), Les salariés actionnaires : pourquoi investissent-ils dans leur entreprise ? Finance, Contrôle, Stratégie 11:87-110.
[4] Aubert N, Rapp T (2010), Employees’ investment behaviors in company based savings plans, Finance 31:1-32.
[5] Balligand J-P, Foucault J-B (2000), L’épargne salariale au coeur du contrat social, La Documentation Française.
[6] Benartzi S, (2001), Excessive extrapolation and the allocation of 401(k) accounts to company stocks, Journal of Finance, 56:1747-1764.
[7] Benartzi S, Thaler R (2001), Naive diversi…cation strategies in de…ned con-tribution saving plans, American Economic Review, 91: 79-98.
[8] Benartzi S, Thaler R (2002), How Much Is Investor Autonomy Worth? Journal of Finance, 57:593-1616.
[9] Benartzi S, Thaler R (2004), Save More Tomorrow: Using Behavioral Eco-nomics to Increase Employee Saving, Journal of Political Economy: S164-S187
[10] Börsch-Supan A (2004), L’e¢ cacité des incitations pour remédier à l’insu¢ sance de l’épargne retraite en Europe, Revue économique de l’OCDE, 39:121-158.
[11] Carroll C, Kimball M (2001), Does Risk Increase Precautionary Saving? National Bureau of Economics Research 8496:1-42.
[12] Cohen L, (2008), Loyalty based portfolio choice, Review of Financial Stud-ies, 22:1213-1245.
[13] Craney T, Surles J (2002), Model-Dependent Variance In‡ation Factor Cut-o¤ Values, Quality Engineering 14:391 - 403
[14] Degeorge F, Jenter D, Moel A, Tufano P (2004), Selling Company Shares to Reluctant Employee: France Telecom’s Experience. Journal of Financial Economics, 71:169-202.
[15] Du‡o E, Saez E (2002), Participation and investment decisions in a re-tirement plan: the in‡uence of colleagues’choices, Journal of Public Eco-nomics, 85:121-148.
[16] Engelhardt G, Madrian B (2004), Employee Stock Purchase Plans, National Tax Journal, 57: 385-406.
[17] Engen E, Gale W (1997), Consumption taxes and saving: The role of uncertainty in tax reform, American Economic Review, 87:114-119. [18] French Employee Ownership Association (2009), Guide de l’Actionnariat
Salarié, de l’Epargne Salariale et de l’Epargne Retraite, Aumage éditions. [19] Gale W, Scholz J (1994), IRAs and Household Saving. The American
Eco-nomic Review, 84:1233-1260.
[20] Gollier C (2001), The Economics of Risk and Time. The MIT Press, Cam-bridge.
[21] Hausman, JA, Poterba JM (1987), Household behavior and the tax reform act of 1986, Journal of Economic Perspectives, 1:101-119.
[22] Heckman J (1979), Sample selection bias as a speci…cation error. Econo-metrica 47:153-161.
[23] Huberman G, S Sheena, S Iyengar, W Jiang (2007), De…ned Contribution Pension Plans: Determinants of Participation and Contributions Rates. Journal of Financial Services Research 31:1-32.
[24] Jappelli T (1990), Who is Credit Constrained in the US Economy, Quar-terly Journal of Economics, 105: 219-234.
[25] Jappelli T, Pagano M (1994), Savings, Growth and Liquidity Constraints, Quarterly Journal of Economics, 109: 83-109.
[26] Kimball M (1990), Precautionary Saving in the Small and in the Large, Econometrica 58:53-73.
[27] Kreps D (1979), A Representation Theorem for Flexibility. Econometrica 147:565-578.
[28] Kruse D, (2002), Research Evidence on the Prevalence and E¤ects of Em-ployee Ownership, Journal of EmEm-ployee Ownership Law and Finance, 14: 65-90.
[29] Madrian B, Shea D (2001), The Power of Suggestion: Inertia in 401(k) Par-ticipation and Saving Behavior. Quarterly Journal of Economics 116:1149-1525.
[30] Mitchell O, Utkus S (2004), Lessons from behavioral …nance for retirement plan design. In Mitchell O, Utkus S(ed) Pension design and structure: New lessons from behavioral …nance, Oxford University Press, pp 3-42.
[31] National Center for Employee Ownership (2010), http://www.nceo.org/library/eo_stat.html accessed 06-30-2010.
[32] Poterba J, (2003), Employer Stock and Retirement Saving Accounts. Amer-ican Economic Review 93: 398-404.
[33] Sunstein C, Thaler R (2003), Libertarian Paternalism Is Not An Oxymoron. University of Chicago Law Review 70:1159-1199.
[34] Thaler R, Shefrin H (1981), An Economic Theory of Self-Control. Journal of Political Economy 89:392-406.
[35] Van de Ven W., Van Pragg B.M.S. (1981),The Demand for Deductibles in Private Health Insurance: A Probit Model with Sample Selection, Journal of Econometrics 17:229-252.
[36] Woolridge J (2009), Introductory Econometrics A Modern Approach. South-Western College Pub; 4th edition 865 pages.
Appendix
Table 1: Summary statistics
Variable Mean Std. Dev. Min Max
Male (vs. Female) 0.429 0.495 0 100
Age (years) 45.103 10.61 10 71
Paris (yes vs. no) 0.546 0.498 0 100
Permanent contract (yes vs. no) 0.847 0.36 0 100 Masters’degree (yes vs. no) 0.039 0.194 0 100 Number of previous o¤er 1.615 0.745 0 2
Tenure (years) 16.303 13.64 0 45
Income (in e) 35,359 21,551 1 650,000
Incentive pay (in e) 4,355 28,329 0 1,8,000,000 Human resources department 0.213 0.409 0 100 Financial expertise (yes vs. no) 0.0671 0.250 0 100 Hierarchical rank> 6 0.427 0.495 0 100 Investment (yes vs. no) 0.460 0.4984 0 100 Amount invested (in e) 3,990 6,747 0 100
Table 2: Mean Characteristics of Non-investors, Investors, and Active Investors Variable Non investor Investor Passive Active
Overall 0.530 0.460*** 0.597 0.402*** Male 36.78 50.14*** 38.97 48.79*** Age 45.62 44.49*** 45.38 44.69*** Paris 0.478 0.625*** 0.505 0.606*** Permanent contract 0.819 0.878*** 0.831 0.870*** Masters’degree 0.022 0.059*** 0.032 0.048*** Number of previous o¤er 1.62 1.61 1.61 1.63**
Tenure 17.24 15.21*** 16.76 15.62***
Income 29,837 41,838*** 32,435 39,696***
Incentive pay 1,916 7,217*** 4,050 4,809**
Human resources department 0.211 0.215 0.210 0.217** Financial expertise 0.035 0.103*** 0.057 0.080*** Hierarchical rank 0.327 0.543*** 0.346 0.0546*** *** p<0.01, ** p<0.05, * p<0.1
T able 3: Cross-correlation table (Legend: 1:Male 2:Age 3:Age Age 4:P aris 5:Male P aris 6:P ermanen t co n tract 7:Masters’ degree 8:Num b er of previous o¤ ers 9:T en ure 10:T en ure Age 11:log(income) 12:log(incen tiv e) 13:P ercen tage in v ested in ES P P 14:Human resource 15:Financial exp ertise 16:Hierarc hical rank > 6) 1 2 3 4 5 6 7 8 9 10 11 12 13 14 1 5 16 1 1.000 2 0.019 1.000 3 0.017 0.994 1.000 4 -0.009 -0.109 -0.124 1.000 5 0.634 -0.070 -0.077 0.501 1.000 6 -0.030 -0.243 -0.282 0.027 -0.013 1.000 7 0.063 -0.038 -0.040 0.075 0.091 0.018 1.000 8 -0.017 0.100 0.072 -0.064 -0.057 0.26 5 0.027 1.000 9 -0.033 0.515 0.488 -0.172 -0.150 0.34 9 -0.065 0.499 1.000 10 -0.022 0.569 0.552 -0.178 -0.143 0.315 -0.066 0.456 0.991 1.000 11 0.297 0.132 0.110 0.286 0.368 -0.005 0.233 -0.062 -0.131 -0.111 1.000 12 0.172 -0.192 -0.208 0.037 0.124 0.324 0.162 0.056 0 .036 0.020 0.259 1.000 13 0.097 0.010 0.005 -0.053 0.037 -0.015 0.025 0.030 -0.010 -0.010 0.111 0.082 1.000 14 -0.031 0.038 0.041 0.085 0.008 -0.041 0.020 -0.050 -0.09 1 -0.082 0.080 -0.095 0.004 1.000 15 0.047 -0.082 -0.090 0.133 0.112 0.015 0.048 -0.121 -0.20 1 -0.191 0.245 0.136 -0.032 -0.036 1.000 16 0.243 0.083 0.069 0.115 0.160 -0.041 0.060 0.108 0.025 0.024 0.426 0.158 0.162 0.021 -0.040 1.000
Table 4: Amounts invested conditional on participation -exogeneous
variables-Heckman Conditional OLS
(1) (2) (3)
Variables Prob(invest) Log(amount) Log(amount)
Age 0.135*** -0.012 0.107*** (0.005) (0.021) (0.006) Age Age -0.002*** 0.000 -0.001*** (0.000) (0.000) (0.000) Paris 0.277*** 0.134*** 0.397*** (0.017) (0.049) (0.018) Male 0.295*** 0.234*** 0.510*** (0.018) (0.052) (0.020) Male Paris 0.106*** 0.025 0.079*** (0.025) (0.034) (0.025) Mean ESPP investment per department -1.668***
(0.197) lambda -1.358*** (0.222) Constant -2.370*** 9.754*** 6.046*** (0.130) (0.627) (0.117) Observations 43,362 19,957 19,957 R-squared 0.163
Table 5: Amounts invested in ESPP, conditional on participation -all
variables-Heckman Conditional OLS
(1) (2) (3)
Variables Prob(invest) log(amount) log(amount)
Age 0.119*** 0.222*** 0.111*** (0.008) (0.016) (0.007) Age Age -0.002*** -0.003*** -0.001*** (0.000) (0.000) (0.000) Paris 0.138*** 0.293*** 0.122*** (0.018) (0.034) (0.016) Male 0.016 0.278*** 0.250*** (0.020) (0.035) (0.018) Male Paris 0.085*** 0.058 0.016 (0.027) (0.044) (0.022) Tenure -0.049*** -0.104*** -0.060*** (0.006) (0.010) (0.005) Tenure Age 0.001*** 0.002*** 0.001*** (0.000) (0.000) (0.000) log(income) 0.585*** 1.405*** 0.771*** (0.020) (0.065) (0.014) log(incentive pay) 0.018*** 0.036*** 0.016*** (0.002) (0.004) (0.002) Percentage in former ESPP 1.013*** 1.261*** 0.218***
(0.021) (0.101) (0.019) Permanent contract 0.184*** 0.206*** -0.011
(0.026) (0.045) (0.020)
Human resources 0.081 0.242*** 0.145***
(0.049) (0.078) (0.038) Number of previous o¤ers -0.119*** -0.109*** 0.032* (0.022) (0.038) (0.018) Financial knowledge 0.301*** 0.563*** 0.232*** (0.031) (0.050) (0.019) Masters’degree 0.156*** 0.257*** 0.153*** (0.035) (0.051) (0.023) Hierarchical rank>6 0.240*** 0.331*** 0.054*** (0.015) (0.034) (0.012) Mean ESPP investment per department -1.187***
(0.228) lambda 1.790*** (0.155) Constant -12.595*** -8.496*** -1.772*** (1.025) (0.224) (0.164) Observations 43,362 19,957 19,957 R-squared 0.364
Table 6: Probability of being an active investor, conditional on participation -exogeneous
variables-Heckprob Conditional Probit
(1) (2) (3)
Variables Prob(invest) Prob(active) Prob(active)
Age 0.118*** 0.067*** -0.015 (0.005) (0.009) (0.011) Age Age -0.001*** -0.001*** 0.000** (0.000) (0.000) (0.000) Paris 0.259*** -0.126*** -0.471*** (0.017) (0.036) (0.040) Male 0.284*** -0.065* -0.382*** (0.019) (0.037) (0.044) Male Paris 0.101*** 0.162*** 0.194*** (0.025) (0.039) (0.052) Mean number of investors per department 0.019***
(0.001) rho 1.104*** (0.073) Constant -3.711*** -1.069*** 1.745*** (0.111) (0.218) (0.225) Observations 43,362 19,957 19,957
Table 7: Probability of being an active investor, conditional on participation -all
variables-Heckprob Conditional Probit
(1) (2) (3)
Variables Prob(invest) Prob(active) Prob(active)
Age 0.107*** 0.115*** 0.079*** (0.016) (0.008) (0.018) Age Age -0.001*** -0.001*** -0.001*** (0.000) (0.000) (0.000) Paris 0.135*** 0.022 -0.090* (0.018) (0.044) (0.050) Male 0.009 0.169*** 0.158*** (0.020) (0.045) (0.054) Male Paris 0.091*** 0.104* 0.132** (0.026) (0.053) (0.063) Tenure -0.038*** -0.025** -0.004 (0.006) (0.011) (0.013) Tenure Age 0.001*** 0.000** 0.000 (0.000) (0.000) (0.000) log(income) 0.566*** 0.841*** 0.699*** (0.020) (0.050) (0.056) log(incentive pay) 0.021*** -0.565*** -0.673*** (0.002) (0.028) (0.020) Percentage in former ESPP 1.014*** 0.824*** 0.481***
(0.021) (0.052) (0.054)
Permanent contract 0.111*** 0.185*** 0.098
(0.026) (0.057) (0.067)
Human resources 0.053 -0.110 -0.209*
(0.049) (0.109) (0.126) Number of previous o¤ers -0.142*** -0.071* -0.005
(0.022) (0.043) (0.049) Financial knowledge 0.164*** 0.053 -0.118*** (0.032) (0.043) (0.044) Masters’degree 0.168*** 0.067 -0.005 (0.035) (0.045) (0.049) Hierachical rank>6 0.242*** 0.117*** -0.028 (0.015) (0.034) (0.034) Mean number of investors per department 0.012***
(0.001) rho 0.883*** (0.110) Constant -9.123*** -6.728*** -2.765*** (0.213) (0.564) (0.542) Observations 43,362 19,957 19,957