HAL Id: tel-01494668
https://tel.archives-ouvertes.fr/tel-01494668
Submitted on 23 Mar 2017
HAL is a multi-disciplinary open access archive for the deposit and dissemination of sci-entific research documents, whether they are pub-lished or not. The documents may come from teaching and research institutions in France or
L’archive ouverte pluridisciplinaire HAL, est destinée au dépôt et à la diffusion de documents scientifiques de niveau recherche, publiés ou non, émanant des établissements d’enseignement et de recherche français ou étrangers, des laboratoires
Contribution to electrical valorization of microbial fuel
cells
Firas Khaled
To cite this version:
Firas Khaled. Contribution to electrical valorization of microbial fuel cells. Micro and nanotechnolo-gies/Microelectronics. Université de Lyon, 2016. English. �NNT : 2016LYSEI003�. �tel-01494668�
N° d’ordre : 2016LYSEI003 Année 2016
T
HÈSE présentée devantL’Institut National des Sciences Appliquées de Lyon pour obtenir le grade de
Docteur dans le cadre de
L’école doctorale Électronique Électrotechnique Automatique par
F
IRASK
HALEDIngénieur
Contribution à la Valorisation Electrique des Piles à Combustible
Microbiennes
(Contribution to Electrical Valorization of Microbial Fuel Cells)
Soutenue devant la commission d’examen le 21 Janvier 2016
Membres du jury :
M. YVESLEMBEYE Professeur G2Elab (Grenoble) Rapporteur
M. CHRISTOPHEINNOCENT Chargé de Recherche IEM (Montpellier) Rapporteur
M. OLIVIERONDEL Maître de Conférences Ampère (Lyon) Encadrant
M. BRUNOALLARD Professeur Ampère (Lyon) Directeur
M. NICOLAS DEGRENNE Docteur MERCE (Rennes) Examinateur
M. VINCENZOFERRARA Professeur DIET (Rome, Italie) Président
Thèse préparée dans les départements bioingénierie et énergie électrique du laboratoire Ampère de Lyon UMR CNRS 5005, 21 avenue Jean capelle – 69621 Villeurbanne cedex , France
Remerciements
La présente étude n’aurait pas été possible sans le bienveillant soutien de certaines personnes. Et je ne suis pas non plus capable de dire dans les mots qui conviennent, le rôle qu’elles ont pu jouer à mes côtés pour en arriver là. Cependant, je voudrais les prier d’accueillir ici tous mes sentiments de gratitude qui viennent du fond de mon coeur, en acceptant mes remerciements.
Mes premiers remerciements vont d’abord à mon directeur de thèse, le professeur Bruno ALLARD, qui m’a accompagné tout au long de ma formation. Sa disponibilité et ses généreux secours au cours de certains de mes moments difficiles ont été d’une très grande qualité, et d’un immense réconfort. Entre autres qualités, peu de personnes ´n racontent ˙z comme lui la science. Je me souviendrai de l’énergie et de la motivation communicative qui se dégage de ce laboratoire. Cette énergie a définitivement marqué ma thèse tout comme le plaisir et l’honneur d’avoir travaillé au sein de laboratoire Ampère. Merci infiniment Monsieur ALLARD, votre rigueur au travail est un exemple pour moi. Je remercie Olivier Ondel qui a codirigé cette thèse en y apportant conseils et soutien. Je lui adresse mes sincères remerciements ainsi que mon plus profond respect. Je remercie aussi tous les membres de mon jury qui m’ont prodigué d’utiles conseils qui m’ont aidé à bien structurer mon étude : il s’agit de : Monsieur Yves Lembeye et Monsieur Christophe Innocent m’ont fait l’honneur d’être rapporteurs de ma thèse, ils ont pris le temps de m’écouter et de discuter avec moi. Leurs remarques m’ont permis d’envisager mon travail sous un autre angle. Pour tout cela je les remercie. Je tiens à remercier Vincenzo Ferrara pour avoir accepté de participer à mon jury de thèse et pour sa participation scientifique ainsi que le temps qu’il a consacré à ma recherche. Je remercie également Nicolas Degrenne pour l’honneur qu’il me fait d’être dans mon jury de thèse. Je sais infiniment gré à monsieur François Buret de s’être rendu disponible pour la pré-soutenance, de m’avoir prodigué maints conseils et d’avoir accepté la fonction de rapporteur.
J’adresse un grand merci à mon père, pour qui entre autres, j’ai spécialement porté cette tenue au-jourd’hui, et à ma mère, pour avoir pu cimenter ma vie dans un douillet cocon familial, fait d’amour, de bravoure et de zèle au travail.
Il y a une personne de très grande importance dans ma vie, qui m’accompagne et qui me soutient tout le temps par la force et l’énergie qui lui sont disponibles. Il s’agit de KHALED Shahama, ma merveilleuse, splendide et vertueuse épouse, dont je ne pourrai mesurer l’apport dans l’accomplissement de cette formation. Dans tout ce que j’ai pu souffrir et obtenir, elle a été l’autre moi. Je te remercie infiniment ma chérie.
ii
De plus, mes remerciements seraient incomplets, si je ne fais pas mention de mon enfant, qui a pu supporter mon éloignement et a pu continuer d’être sages en dépit de mon absence. Je t’adresse mes chaleureux remerciements, Sahar. De même, que tous les membres de la grande famille KHALED et KZO trouvent ici toute ma reconnaissance pour le soutien que chacun d’eux a pu apporter pour faire aboutir ce rêve. Heureusement que mes parents, mes frères et mes amis sont la pour me changer les idées. Ils ont tous cru en moi et ouf ! Maintenant j’y suis ! Alors merci à vous tous,
Mes remerciements vont également à mon pays qui m’a permis de terminer cette formation, en me fournissant les ressources nécessaires disponibles. Que tous ceux qui ont contribué à faciliter cette étude dans ce cadre trouvent ici le témoignage de ma sincère gratitude. Mes remerciements vont aussi à tous mes amis, qu’ils soient en France ou en Syrie, et je sais qu’ils sont nombreux. Vous m’avez tous soutenu par votre encouragement, et vos dons en prière et en nature souvent. Je vous adresse tous mes sentiments de reconnaissance renouvelée.
Abstract
Microbial Fuel Cells (MFCs) are bioreactors that convert chemical energy in organic compounds to electrical energy through the metabolism of microorganisms. Organic matters are widely available in the environment that contains a huge amount of energy. This energy could be harvested, converted, by the technology of MFCs, to be used in certain applications. Energy production of a MFC is limited in low voltage value and low-power values what limits the potential applications. However this energy is still sufficient to supply low-power applications (e.g. wireless sensors) to replace batteries and overcome their (environmental and economic) limitations. An electrical model of MFCs appears useful to better understand their dynamics and to validate the design of electrical circuits before fabrication. That also helps to evaluate the internal losses what may lead to another design of MFCs for better efficiency.
To step-up the voltage of MFCs to be suitable for these applications, an efficient power management unit (PMU) is required with a specific design to deal with their characteristics. A flyback converter under discontinuous conduction mode (DCM) is the most adapted to such low-power source like MFCs, offers a simple implementation, and low losses conversion system. The DCM characteristics of the flyback converter are very attractive for impedance matching that is investigated as a maximum power point tracking algorithm. An integrated, low-voltage, low-consumption charge pump circuit is a good solution to supply start-up and the oscillator at low voltages. The flyback converter has a good efficiency that can reach 75% with one MFC and about 80% when it is supplied by a serial stack of MFCs.
Associations of MFCs are very interesting to increase the output power and expand the domain of application. Parallel association is a method to increase the output current but it imposes limitations in conversion efficiency due to the low output voltage of the stack. Contrarily, the serial association steps-up the voltage what leads to better performance of the converter. However the non-uniformities between cells in a serial stack affect negatively the performance of the stack. Voltage balancing circuits are considered as the solution to compensate this phenomenon. Alternatively connecting the MFCs in series and parallel can achieve the purpose (switched-MFCs) by exploiting the internal capacitor of the MFCs. In the switched-capacitor method, an external capacitor is used to transfer the energy from the strongest MFC(s) to the weakest one(s). The losses in the switched-capacitor circuit are less than the losses of the switched-MFCs. The switched-capacitor offers an efficient, simple, low consumption method to optimize the performance and prevent the voltage reversal of the weak cells. Integration of this circuit can optimize the efficiency.
iv ABSTRACT
Operating MFCs in a batch mode requires a periodic intervention to add organic matter. Continuous operation mode by hydraulically connection between MFCs overcomes this problem and can continu-ously refresh the substrate to give an autonomous energy harvesting system. On the other hand, in some applications, e.g. a wastewater treatment plant, MFCs could not be hydraulically isolated. In this config-uration, a leakage charge between the associated MFCs will decrease the global efficiency. The flow rate has to be controlled to eliminate this problem. A flow from cathodes to anodes causes additional losses due to the oxygen leakage.
A practical investigation of the harvested energy from MFCs may prove the fact that MFCs are good candidates to replace the chemical batteries. A temperature sensor is continuously supplied by alternatively connecting two MFCs. Each MFC supplies the sensor for two days. The flyback converter is able to continuously supply the sensor from the energy harvested from one continuously-fed MFC. This could be a good example, in a wastewater treatment plant (WWTP), to supply the monitoring system or also to supply the low power application of a building from a local WWTP.
Keywords: Microbial fuel cell; energy harvesting; power management; DC/DC converter; voltage balancing; modeling; wastewater treatment plant; hydraulic coupling; low-power applications; sensors; renewable energy.
Contents
Abstract iii
List of Figures x
List of Tables xvi
1 Introduction 1
1.1 Various Energy Harvesting Techniques . . . 2
1.2 Microbial fuel cell as an energy harvester . . . 3
1.3 Conventional fuel cell technology . . . 6
1.4 Biofuel cell technology . . . 6
1.5 Microbial Fuel Cells . . . 8
1.6 Research efforts on MFCs . . . 10
1.7 Microbial fuel cells at Ampere lab . . . 11
1.8 Scope of the thesis and objectives . . . 12
1.8.1 Part 1: Modeling of MFC . . . 13
1.8.2 Part 2: Energy harvesting from one or a stack of MFCs . . . 13
1.8.3 Part 3: Field applications of MFC . . . 13
I Microbial fuel cell as electricity generator 16 2 Literature review 17 2.1 Microbial fuel cell principles . . . 17
2.1.1 The energy metabolism of bacteria . . . 17
2.1.2 Metabolism in MFC . . . 18
2.1.3 Energy mechanisms in a MFC . . . 19
2.2 Output voltage of a MFC . . . 20
2.2.1 Voltage drops . . . 21
vi CONTENTS
2.3 Parameters defining the performance of MFCs . . . 23
2.3.1 Open circuit voltage . . . 24
2.3.2 Internal resistance . . . 24 2.3.3 Effect of temperature . . . 24 2.3.4 Effect of pH . . . 25 2.3.5 Substrates used in MFCs . . . 25 2.3.5.1 Acetate . . . 25 2.3.5.2 Glucose . . . 25 2.3.5.3 Substrate concentration . . . 26
2.3.6 Influence of output load . . . 26
2.4 Materials of construction . . . 26 2.4.1 Anode . . . 26 2.4.2 Cathode . . . 27 2.4.3 Membranes . . . 28 2.5 Electrical characteristics . . . 29 2.5.1 Polarization Curves . . . 29 2.5.2 Power Curves . . . 30
3 Electrical Model of Microbial Fuel Cells 33 3.1 Introduction . . . 33
3.2 Electrical characteristics . . . 34
3.2.1 Construction of MFC . . . 34
3.2.2 Static characteristics and the effect of sample rate . . . 35
3.2.3 Dynamic characteristics . . . 37
3.3 Modeling the MFC . . . 38
3.3.1 Analysis of voltage drops . . . 41
3.4 Validation of the model . . . 44
3.5 Analysis of losses . . . 44
3.6 Substrate concentration . . . 46
3.7 Effect of temperature . . . 47
3.8 Conclusion . . . 49
II Energy harvesting from microbial fuel cells 55 4 Literature review 56 4.1 Start-up techniques . . . 56
CONTENTS vii
4.1.2 Self-starting methods . . . 57
4.2 Maximum Power Point Tracking (MPPT) . . . 59
4.2.1 Indirect control techniques . . . 61
4.2.1.1 Open circuit voltage and short circuit current based MPPT . . . 61
4.2.1.2 Impedance matching . . . 61
4.2.1.3 Look-up table method . . . 62
4.2.1.4 Curve- fitting-based MPPT . . . 62
4.2.2 Direct control techniques . . . 62
4.2.2.1 The perturb and observe method (P&O) . . . 62
4.2.2.2 Incremental conductance (IC) . . . 63
4.3 Maximum power point control for MFC . . . 64
4.4 Conclusion . . . 64 5 DC-DC converters 65 5.1 Converter topologies . . . 65 5.1.1 Boost converter . . . 65 5.1.2 Buck-boost converter . . . 67 5.1.3 Cuk converter . . . 67 5.1.4 Sepic converter . . . 67 5.1.5 Isolated DC-DC converters . . . 68 5.2 Flyback converter . . . 69 5.2.1 Principle of Operation . . . 70 5.3 Conclusion . . . 73
6 Autonomous flyback converter for MFCs 74 6.1 Specifications . . . 74
6.2 Design . . . 75
6.2.1 Start-up circuit . . . 75
6.2.2 Switching circuit and regulation . . . 75
6.2.3 The main circuit . . . 78
6.2.3.1 Selection of main switch . . . 78
6.2.3.2 Design of two coupled inductances . . . 80
6.2.3.3 The diode . . . 82
6.3 Result and discussion . . . 83
6.3.1 Test of the flyback converter with an emulator of the microbial fuel cell . . . 83
6.3.2 Input Impedance . . . 86
6.3.3 Test of the flyback converter with a MFC . . . 87
viii CONTENTS
6.4 Conclusion . . . 90
7 Energy harvesting from a stack of microbial fuel cells 91 7.1 Introduction . . . 91
7.2 Voltage balancing circuit . . . 93
7.2.1 Passive cell balancing . . . 93
7.2.2 Active cell balancing . . . 94
7.2.2.1 Capacitive balancing . . . 94
7.2.2.2 Inductive balancing . . . 96
7.2.2.3 Balancing methods based on DC/DC converters . . . 97
7.3 Voltage balancing circuit for a serial stack of MFCs . . . 98
7.4 Switched-capacitor method . . . 99
7.5 Switched-MFCs . . . 103
7.6 Performance analysis . . . 104
7.6.1 A stack of 2 MFCs without balancing circuit . . . 105
7.6.2 Switched-Capacitor balancing circuit . . . 106
7.6.3 Switched-MFC balancing circuit . . . 108
7.7 Generalization to a n-stage switched-capacitor voltage balancing circuit . . . 110
7.8 Towards an integrated voltage balancing circuit . . . 111
7.9 Configuration of a MFC-powered system . . . 113
7.9.1 A parallel stack of 2 MFCs with the flyback converter . . . 114
7.9.2 Individual MFCs . . . 114
7.9.3 A serial stack with one converter . . . 115
7.9.4 A balanced serial stack with one converter . . . 115
7.10 Conclusion . . . 116
8 Hydraulically connected microbial fuel cells 117 8.1 Introduction . . . 117
8.2 Substrate cross-conduction effect . . . 118
8.3 Performance analysis of hydraulically-connected MFCs . . . 120
8.3.1 Construction of the MFC-Cascade system . . . 120
8.3.2 Operation . . . 122
8.3.2.1 Hydraulically insulated operation . . . 122
8.3.2.2 Hydraulic coupling with a low flow rate . . . 123
8.3.2.3 Hydraulic coupling with a high flow rate . . . 126
8.3.2.4 A hydraulically coupled stack without negative effect . . . 128
CONTENTS ix
III Field applications of microbial fuel cells 132
9 Literature review 133 9.1 Electricity generation . . . 133 9.2 Wastewater treatment . . . 135 9.3 Biohydrogen . . . 135 9.4 Biosensor . . . 137 9.5 Conclusion . . . 137
10 MFC as power supply of a low-power sensor 139 10.1 The sensor . . . 139
10.2 Source . . . 140
10.3 Converter . . . 141
10.4 Proposed solutions for powering the sensor . . . 143
10.4.1 MFCs in battery-mode . . . 143
10.4.2 Continuous mode . . . 145
10.5 Powering the sensor with a Flyback converter . . . 146
10.6 Conclusion . . . 150
11 General conclusions and perspectives 154 11.1 General conclusion . . . 154
11.2 Scientific perspectives . . . 155
List of Figures
1.1 Types of ambient energy sources suitable for energy harvesting . . . 4
1.2 Schematic presentation of conventional PEM fuel cell (a) and enzymatic biofuel cell (b) . 7 1.3 Schematic representation of dual chamber MFC system. . . 9
1.4 Schematic representation of single chamber MFC system. . . 10
1.5 The number of articles on MFCs. The data is based on the number of articles entitled MFC in the database Google scholar in July’ 2015. . . 11
1.6 Research fields related to MFCs . . . 14
1.7 Evolution of the energy consumption with the global removal efficiency of WWTP [Amiel et al., 2011]. . . 15
2.1 Electron transfer in microbial fuel cells . . . 18
2.2 Illustration of the DET via (A) membrane bound cytochromes, (B) electronically con-ducting nanowires, (C) via oxidation of reduced fermentation products [Schröder, 2007]. 18 2.3 Interrelationships between operating conditions and MFC output power generation [Wang et al., 2012] . . . 23
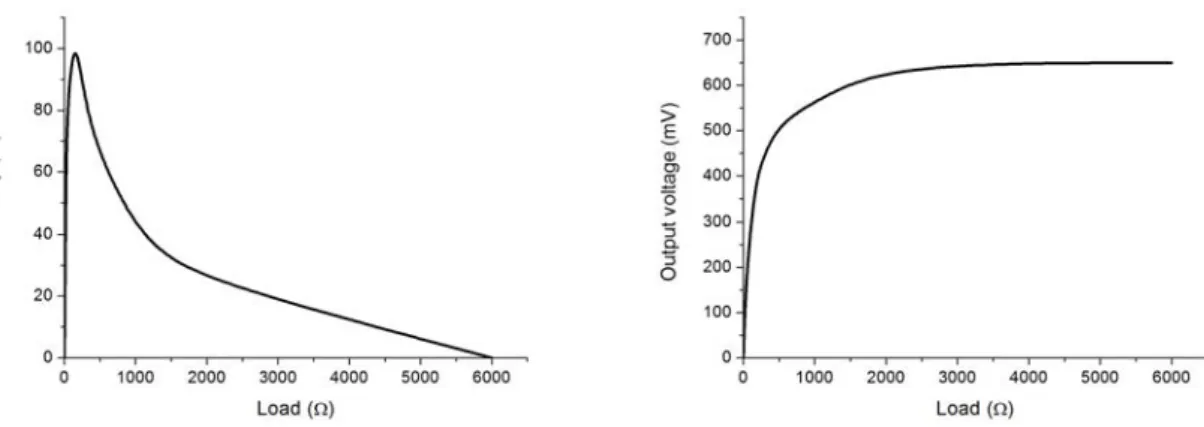
2.4 Typical efficiency and output voltage as a function of the output load . . . 26
2.5 Typical static electrical characteristic of a MFC . . . 32
3.1 Equivalent circuit model of a MFC [Fradler et al., 2014]. . . 34
3.2 Photo of the lab-scale MFC . . . 35
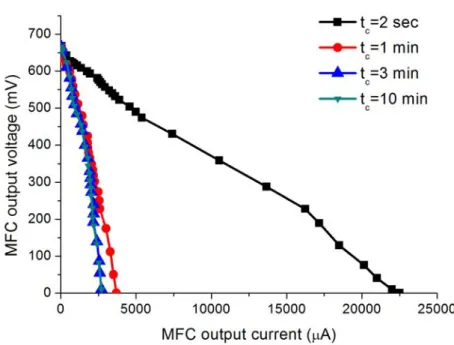
3.3 Polarization curves of the lab-scale MFC reactor for different sampling rates. . . 36
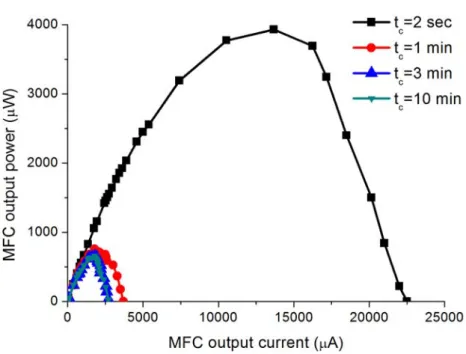
3.4 Power curves of the lab-scale MFC reactor for different sampling rates. . . 37
3.5 Sampling rate schedule during the two experiments . . . 38
3.6 Polarization curve of MFC with 20 sec and 3 min sampling rate . . . 38
3.7 Power curve of MFC with 20 sec and 3 min sampling rate . . . 39
3.8 Evaluation of the voltage and the power of the MFC with 20 sec sampling rate, zoom on a part of the curves in Fig. 3.6 and 3.7. . . 40
3.9 Experimental measurement and evaluation of the analytical model for a lab-scale reactor with 3 min sampling rate . . . 41
LIST OF FIGURES xi
3.10 Electrical equivalent circuits for a MFC . . . 42
3.11 The activation, ohmic and concentration voltage drops from the polarization curve with 3min sampling rate . . . 43
3.12 Evolution of the different impedances of the MFC model from the polarization curve with 3 min sampling rate . . . 44
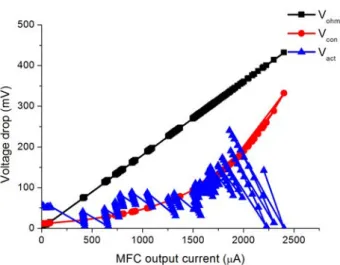
3.13 Activation, ohmic and concentration voltage drops with 20 sec sampling rate . . . 45
3.14 Evolution of the different impedances of the MFC model with 20 sec sampling rate . . . 46
3.15 Evolution of the activation equivalent capacitor . . . 47
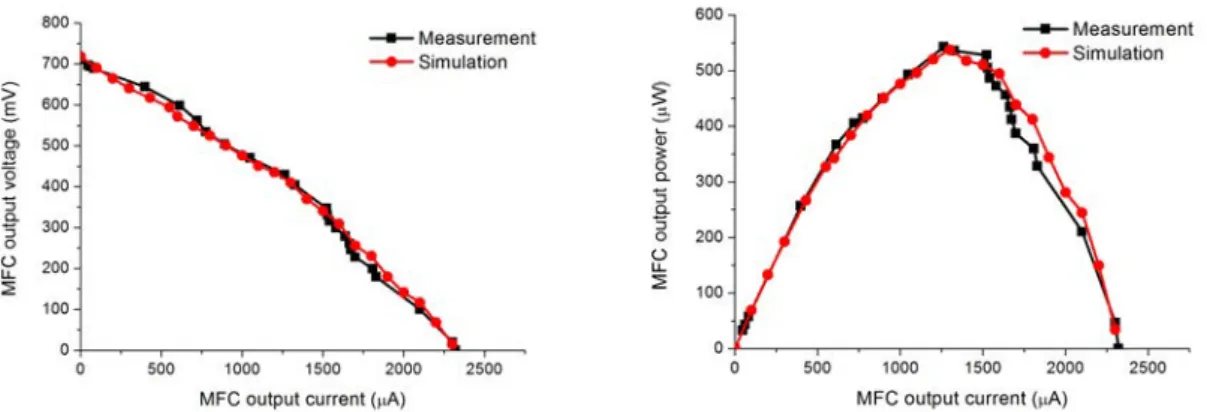
3.16 Comparison between the simulation results and experimental polarization curves with 20 sec sampling rate . . . 48
3.17 Comparison between the simulation results and experimental power curves with 20 sec sampling rate . . . 49
3.18 Breakdown of losses in the MFC with 3 min (left) and 20 sec (right) sampling rate . . . . 50
3.19 Breakdown of all power contribution in a lab-scale reactor with 3 min sampling rate . . . 50
3.20 Internal resistance (Rint), load (Rext) and output power as a function of the current (lab-scale reactor, 3 min sampling rate) . . . 51
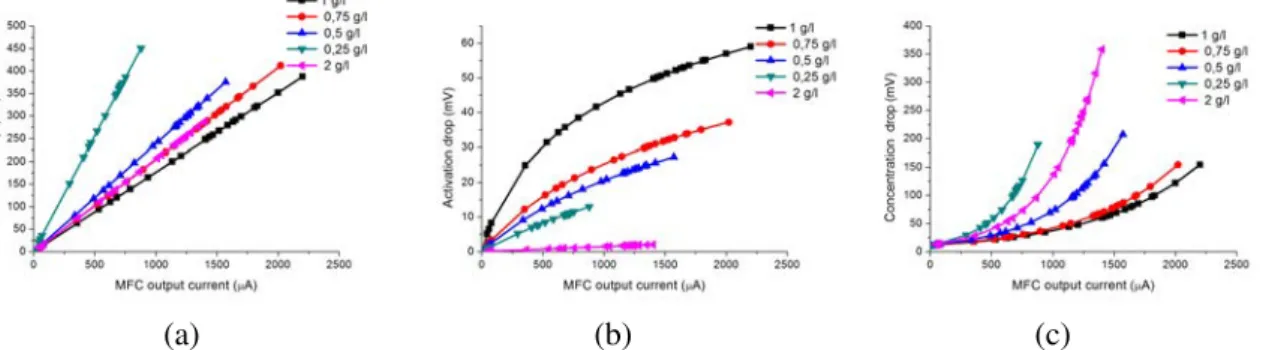
3.21 Experimental polarization and power curves of MFC for different values of concentration of acetate (3 min sampling rate) . . . 51
3.22 Different voltage drops for different values of concentration of acetate in a lab-scale reactor . . . 51
3.23 Evaluated different resistances for different values of concentration of acetate in a lab-scale reactor . . . 52
3.24 Experimental polarization and power curves for different values of ambient temperature (3 min sampling rate) . . . 53
3.25 Different voltage drops for different ambient temperature . . . 53
3.26 Evaluated resistances for different values of ambient temperature . . . 54
4.1 Start-up circuit with a micro-battery (V0) [T. Paing and Popovic, 2008] . . . 57
4.2 Transformer-based start-up circuit with two windings transformer (left) and with three windings transformer (right) [Adami et al., 2011] . . . 58
4.3 Circuit diagram of the low input voltage converter for thermoelectric generator proposed in [Damaschke, 1997]. . . 58
4.4 Schematic of the boost converter with a start-up sub-circuit [Degrenne et al., 2012a, Degrenne, 2012] . . . 59
4.5 LTC3108 converter . . . 60
4.6 Block diagram of MPPT controller for energy harvesting systems . . . 60
4.7 Principle of impedance matching MPPT method . . . 62
xii LIST OF FIGURES
5.1 Boost converter circuit . . . 66
5.2 Typical switching operation of a boost converter. (a) Shows the circuit during the first phase, (b) shows the circuit during the second phase and (C) shows the voltage across the inductor. . . 66
5.3 Buck-boost converter circuit . . . 67
5.4 Cuk converter circuit . . . 67
5.5 Sepic converter circuit . . . 68
5.6 Standard isolated configurations . . . 68
5.7 Derivation of the flyback converter: (a) buck-boost converter, (b) inductor L is divided into two parallel inductors, (c) inductors are isolated, leading to the flyback converter with a 1:1 turns ratio and negative output voltage, (d) with a 1:n turns ratio and positive output voltage [Taylor, 2004]. . . 69
5.8 Flyback converter (a), equivalent circuit in phase 1 (b), equivalent circuit in phase 2 (c), equivalent circuit in phase 3 (d) . . . 71
5.9 Flyback circuit waveforms under continuous conduction mode (a) and discontinuous conduction mode (b), (1) shows the control voltage of MOSFET switch, (2) shows the primary current, (3) shows the secondary current, (4) shows the inductor voltage on the primary side of the transformer and (5) shows the converter output voltage. . . 72
6.1 Diagram of the main sub-circuits in the flyback converter. . . 75
6.2 Operation diagram of the charge pump S-882Z . . . 76
6.3 Supply current of controller TS3001 vs the period (left) and vs the load capacitor (right) (data from datasheet [Silicon.labs, 2014]) . . . 77
6.4 Circuit of TS3001 oscillator (left) and characteristic of output frequency (right) (data from datasheet [Silicon.labs, 2014]) . . . 77
6.5 Schematic of the flyback converter. . . 78
6.6 Primary inductor of the flyback transformer vs the frequency . . . 79
6.7 Simulated efficiency of the converter as a function of the switching frequency . . . 80
6.8 Characteristics of selected core . . . 82
6.9 Control frequency (CH1), output voltage (CH2), voltage of Cc capacitor (CH3) and volt-age of Cp capacitor (CH4) in open circuit . . . 84
6.10 Control frequency (CH1), output voltage (CH2), voltage of Cc capacitor (CH3) and volt-age of Cp capacitor (CH4) for a load of 50 k� . . . 84
6.11 Measured efficiency of the flyback converter as a function of the load . . . 85
6.12 Measured output voltage as a function of the input voltage for two loads 1 M� and 10 k� 85 6.13 Input impedance of converter vs the switching frequency with and without the start-up circuit . . . 86
LIST OF FIGURES xiii
6.15 Measured characteristics static of the MFC . . . 87
6.16 Experimental output voltage and output power of the flyback converter powered by the MFC . . . 88
6.17 Distribution of losses in the flyback converter . . . 89
7.1 Serial stack with passive balancing circuit (shunting) [Asumadu et al., 2005] . . . 94
7.2 Serial stack with passive balancing circuit (complete disconnection) [Shibata et al., 2001] 94 7.3 Switched-capacitor cell balancing topology. . . 95
7.4 Single switched-capacitor balancing topology . . . 95
7.5 Switched-capacitor balancing topology . . . 96
7.6 Multi-inductor balancing topology [Moo et al., 2003] . . . 97
7.7 Balancing with one DC/DC converter for every two adjacent cells (left) and with one switched DC/DC converter for the whole stack (right) [Shin et al., 2010, Bonfiglio and Roessler, 2009]. . . 98
7.8 Switched-capacitor balancing circuit for MFCs . . . 100
7.9 Equivalent circuit for the balancing scheme in Fig. 7.8 . . . 102
7.10 Switched-MFC balancing topology . . . 104
7.11 Modified switched-MFC balancing topology . . . 104
7.12 Experimental polarization and power curves for lab-scale reactors MFC1 and MFC2 (3 min sampling rate) . . . 105
7.13 Experimental polarization and power curves for the stack of MFCs (3 min sampling rate) 106 7.14 Simulated ratio of maximum achieved power of the stack vs the switching frequency for different values of balancing capacitor Cb . . . 107
7.15 Experimental polarization and power curves with the SC balancing circuit (10 kHz, 500 �F, 3 min sampling rate) . . . 108
7.16 Simulated ratio of maximum achieved power vs the switching frequency with the switched-MFC balancing circuit . . . 109
7.17 Experimental polarization and power curves with the Switched-MFC balancing circuit (10 kHz, 3 min sampling rate) . . . 109
7.18 Schematic of the integrated SC voltage balancing circuit . . . 112
7.19 Test board of the integrated circuit . . . 112
7.20 Parallel association of non-identical MFCs with one flyback converter (a), MFC individ-ually connected to a flyback converter and the converter outputs connected in parallel (b), MFCs connected in series with the flyback converter (c) and MFCs serially connected with the flyback converter and switched-capacitor voltage balancing circuit (d) . . . 113
7.21 Experimental input voltage (Vin), output voltage (Vout) of the converter and the percent of maximum power achieved in the case of a parallel stack with the flyback converter . . 114
xiv LIST OF FIGURES
7.22 Experimental input and output voltage of the converter and the ratio of maximum achieved power in the case of a natural serial stack with one flyback converter . . . 115 7.23 Experimental input and output voltage of the converter and the ratio of maximum achieved
power in the case of balanced serial stack with one flyback converter . . . 116 8.1 Schematic of a Benthic Microbial Fuel Cell [Lovley, 2006] . . . 118 8.2 Illustration of substrate cross-conduction effect between serially connected MFCs [Zhuang
and Zhou, 2009] . . . 119 8.3 Stacked MFCs, Schematic diagram of the stack assembly (a) and picture of the test set-up
(b). . . 121 8.4 Polarization (a) and power (b) curves of 4 MFCs in the stack under the conditions of
hydraulic and electric isolation . . . 122 8.5 Experimental polarization (a) and power (b) curves for the stack of 4 MFCs connected
in series and parallel without hydraulic couplings . . . 123 8.6 Experimental polarization (a) and power (b) curves of the 4 MFCs under hydraulic
con-nection with a flow rate of 10 L/h . . . 124 8.7 Experimental polarization (a) and power (b) curves of 4 MFCs in the serial stack under
hydraulic connection with a flow rate of 10 L/h . . . 125 8.8 Experimental polarization (a) and power curves (b) for the stack of 4 MFCs connected
in series and parallel under a hydraulic coupling (10 L/h) . . . 125 8.9 Illustration of substrate cross-conduction effect between the parallel-connected MFCs . . 126 8.10 Experimental polarization (a) and (b) power curves for the 4 MFCs electrically isolated
under a hydraulic coupling (45 L/h) . . . 127 8.11 Experimental polarization (a) and (b) power curves for the 4 MFCs serially connected
under a hydraulic coupling (45 L/h) . . . 128 8.12 Experimental polarization (a) and (b) power curves for the stack of 4 MFCs connected
in series and parallel under a hydraulic coupling (45 L/h) . . . 128 8.13 Experimental polarization and power curves for the stack of 4 MFCs connected in series
under hydraulic coupling (1 L/h) . . . 129 8.14 Experimental polarization and power curves for the stack of 4 MFCs connected in series
with the application of SC voltage balancing circuit under hydraulic couplings (1 L/h) (a), the voltage of the 4 MFCs in the stack (b) . . . 129 8.15 Schematic of the SC circuit and the converter applied to the stack of 4 serially-connected
MFCs (hydraulic connections are not presented) . . . 130 8.16 Experimental polarization and power curves for the stack of 4 MFCs connected in series
under a hydraulic coupling (1 L/h) with the application of SC voltage balancing circuit and the flyback converter . . . 130
LIST OF FIGURES xv
9.1 Process flow of a hypothetical MFC-centered hybrid process for wastewater [Li et al.,
2014]. . . 136
9.2 Current density generation in the MFC-based BOD biosensor as a function of initial BOD concentration [Peixoto et al., 2011] . . . 138
10.1 Polarization and power curves for MFC1and MFC2 . . . 141
10.2 Schematic of the converter bq25504 . . . 142
10.3 Characteristics of the source with bq25504 associated to an ideal MFC . . . 143
10.4 Schematic of a simple power management system with one MFC . . . 143
10.5 Voltage of output capacitor C2 . . . 144
10.6 Voltages waveforms during data recording for 2 days (discharging) and relaxing time (recharging) when the sensor is powering by MFC1(a) and by MFC2(b) . . . 145
10.7 Schematic of power management system with 2 MFCs . . . 146
10.8 Voltages waveforms during data recording by switching MFC1and MFC2 . . . 147
10.9 Picture for the complete system (left) and the recorded temperature by the sensor during the experiment period (right) . . . 147
10.10Schematic set-up for fluidic and electrical configurations of 2 MFCs for continuous op-eration . . . 148
10.11Voltages waveforms during data recording by switching MFC1and MFC2in continuous operation mode . . . 149
10.12Output voltage of MFC2 when it is connected and disconnected to a load of 140 � (a) and during MPPT operation (b) . . . 151
10.13Schematic of the set-up for fluidic and electrical configurations of one MFC to power the sensor through a flyback converter . . . 152
10.14Voltages waveforms during data recording when the sensor is powered by MFC1through the flyback converter . . . 152
10.15MFCs-powered monitoring system- topology 1 . . . 153
10.16MFCs-powered monitoring system- topology 2 . . . 153
11.1 Schematic 1 of a large-scale MFC association . . . 157
List of Tables
1.1 Power density comparison of various energy harvesting sources . . . 5
2.1 Electrode materials, configuration and power generation performance . . . 28
4.1 Summary of P&O algorithm . . . 63
6.1 Specifications of MOSFET FDV301N . . . 79
6.2 Parameters of eq. 6.3 . . . 81
6.3 Specifications of designed transformer . . . 82
6.4 Specifications of BAT54 and HSMS-282 diodes . . . 83
6.5 Components of Flyback converter . . . 83
6.6 Losses in the Flyback converter . . . 89
7.1 Comparison of Different Cell Balancing Topologies . . . 99
7.2 Table of results for the series-associated MFCs with or without balancing circuits . . . . 110
7.3 Efficiency of balancing for different level of dispersion in MFCs (1: MFC with MPPT at 200�W, 2: MFC with MPPT at 500�W, 3: MFC with MPPT at 1000�W) . . . 110
7.4 Configuration of the logic input to control the number of MFCs in the stack . . . 111
8.1 Open circuit voltage before and after the serial association of MFCs with a 10 L/h flow rate124 10.1 Monitoring system . . . 150
Chapter 1
Introduction
Contents
1.1 Various Energy Harvesting Techniques . . . 2
1.2 Microbial fuel cell as an energy harvester . . . 3
1.3 Conventional fuel cell technology . . . 6
1.4 Biofuel cell technology . . . 6
1.5 Microbial Fuel Cells . . . 8
1.6 Research efforts on MFCs . . . 10
1.7 Microbial fuel cells at Ampere lab . . . 11
1.8 Scope of the thesis and objectives . . . 12
Fossil fuels have been the mainstay in providing energy during the industrial revolution. Considering that fossil fuel reserves are finite, one of the greatest challenges in this century is to manage the global energy demands necessary to support the economic growth and the population. Burning fossil fuel, such as coal, oil and natural gas, for energy production and industrial processes releases a huge amount of carbon dioxide and other greenhouse gases as CO, SO2, NOx and CH4, into the atmosphere what creates impacts dangerous to human health and environment [Mukhopadhyay and Forssell, 2005,Mohan et al., 2008]. Energy related emissions account for almost 80% of the total greenhouse gas emissions [COMMISSION, 2010]. The limitations of these sources call for more sustainable solutions. By using more renewables to meet energy needs, the word would lower its dependence on fossil fuels and makes its energy production more sustainable. No official definition has been published to the term ‘’renewable energy’’. One definition accepted by the International Energy Agency is that “Renewable energy is the one which can be obtained from natural resources that can be constantly replenished”. Green energy or renewable energy can be produced from a wide variety of natural sources including wind, solar, hydro, tidal, geothermal and various forms of biomass.
Solar energy refers to the energy produced directly from the natural light or the heat that sunlight generates [Bradford, 2006]. Solar energy is a free, inexhaustible resource. Two components are required
2 CHAPTER 1. INTRODUCTION
to have a functional solar energy generator , namely a collector and a storage unit. [Kalogirou, 2004]. The ability to use solar power for heating was the first discovery. Although producing electricity from solar energy was discovered in 1839 by Edmund Becquerel [Williams, 1960], it was not until 1954 that the first commercially viable application of the technology was demonstrated by Bell Laboratories [Chapin et al., 1954]. Even though solar energy generation represents only a small fraction of total energy production (4000 GWh generated by photovoltaic in France in 2013), markets for solar technologies are growing rapidly.
Wind power has been used for hundreds of years for pumping water and milling grains. Wind energy is then converted into electrical energy by wind turbines. This energy is growingly used in many countries like Germany, Denmark, Spain or USA.
Hydropower plants convert the kinetic energy of the natural falling or flowing water, such as a wa-terfall, or from a dam built across a river into electrical energy. Hydroelectric power plant is one of the most efficient, economical and environmentally friendly means of producing electric energy on a large scale.
Biomass is considered as a renewable energy resource. It refers to a product of organic matter that has stored energy and naturally regenerates at a rapid cycle. Biomass can be combusted directly as a solid fuel by thermal process to produce heat and electricity by driving a turbine. Biomass can be also converted to biogas, rich in methane, via a biological process through bacteria in the absence of oxy-gen under a controlled environment [Jacques K, 1999]. Natural but longer process of the solid waste is possible in landfill; a landfill gas (methane-rich-gas) will be produced and can be used as fuel for power generation [Rasi et al., 2007]. These biofuels can be converted either into mechanical energy in a com-bustion engine or into electrical energy in a fuel cell. In this case, gas obtained from biological materials and/or biological processes are known as bioalcohols (e.g. bioethanol). Biofuels can be candidates to replace petroleum fuel. One direct limitation is the use of land to grow resource not dedicated to feet the planet!. Production of biofuel from biomass is a good solution to reduce both consumption of oil and environmental pollution. These gases could be produced also from food [Kim et al., 2008]. For example, bioethanol could be produced through the fermentation of corn, potato, beet and wheat [Smith, 2008].
1.1 Various Energy Harvesting Techniques
In the past years, research and development works have been oriented to harnessing large-scale energy from various renewable energy sources (wind, solar, water, etc.). Small-scales energy harvesting from ambient energy (such as vibrational, thermal, wastewater, RF, etc.) are receiving more and more atten-tion. The developments in low power design and CMOS technologies have been led to produce micro-power electronic applications. Energy harvesting presents thus an important role for the alternative low power technology as it can reduce the dependency on batteries which have a number of limitations [Jiang et al., 2005]:
1.2. MICROBIAL FUEL CELL AS AN ENERGY HARVESTER 3
• The possibility of complete discharge brings negative consequences of forgetting to change the battery in safety-critical systems.
• The limited lifetime: this means that battery replacement will be required what leads to service disruptions during battery replacement and maintenance cost, especially when the system contains a large number of electronic devices or in inaccessible zone.
• Batteries contain chemicals materials which are hazardous both to the environment and to health if not carefully handled.
• The battery size often exceeds that of the system components in the electronic device. • Batteries are non-operational in exceptional environmental conditions.
• High cost of a rechargeable battery.
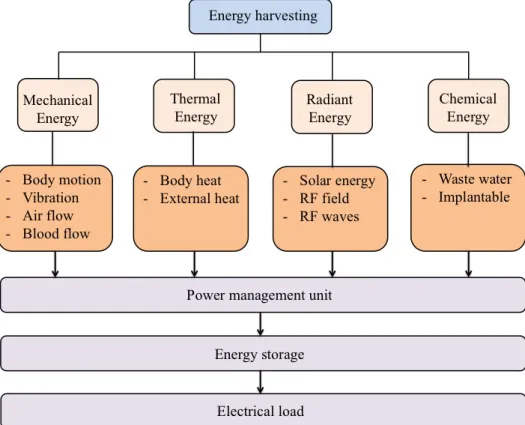
Available ambient energy could be harvested, converted into usable electrical energy, stored and used for small electronics and low-power applications such as wireless and mobile electronics instead of batteries. Four energy types at least considered: thermal energy, radiant energy, mechanical and chemical energy as presented in Fig. 1.1. The sources of mechanical energy can be a moving object, a vibrating structure and vibration induced by flowing water or air [Roundy et al., 2003, Beeby et al., 2006]. Mechanical energy conversion can be achieved through three schemes, namely electromagnetic, electrostatic, and piezo- electric transductions [Arnold, 2007, Mitcheson et al., 2004, Jeon et al., 2005]. Thermoelectric conversion exploits the thermal energy carried by charges (electron and holes) near a heat source and convert temperature differences into electrical energy [Minnich et al., 2009, Böttner, 2002]. The concept of radiant energy harvesting is based on receiving RF signals (radio frequency) with frequency range from 300 GHz to as low as 3 kHz by an efficient antenna with a circuit capable of converting them into DC voltage [Visser and Vullers, 2013, Xie et al., 2013]. Microbial fuel cell is a technology to convert electrochemically the energy of organic matters (renewable biodegradable materials) into electricity, using either enzymes or microorganisms [Logan et al., 2006, Lovley, 2006].
Table 1.1 compares some features of low-power energy harvester, where it appears that the MFC, topic of this manuscript, is in the lower range of power density. To some extent, a MFC can be used as a sensor (almost autonomous in energy as will be demonstrated later). So MFC remains essentially a mean to transform organic wastes into valuable electricity. It is pertinent in the context of wastewater treatment plant WWTP but also the sensor node story and implantable medical devices. There is thus a real interest into managing the electricity generated from MFCs.
1.2 Microbial fuel cell as an energy harvester
Huge volume of wastewater from industrial and agriculture operations are produced annually. Treat-ment of this wastewater requires large amounts of energy. That is known in literature as “Water Energy
4 CHAPTER 1. INTRODUCTION
Figure 1.1: Types of ambient energy sources suitable for energy harvesting
Nexus” [Stillwell et al., 2010]. In wastewater treatment, a so-called activated sludge process is widely used. However during the degradation of organic pollutants, it produces huge amount of waste-activated sludge (WAS). Currently USA generates about 8.2 million tons of dry WAS per year and EU annually produces over 10 million tons. In China the total amount of sludge is about 4.4 million tons in 2010 and can increase to about 6 million tons in 2016 [Paul and Liu, 2012]. As the treatment and disposal of WAS accounts for 25–65% of the total plant operation cost [Zhao and Kugel, 1996], it has become a severe problem for many wastewater treatment plants (WWTPs) [Rai et al., 2004, Xiao et al., 2011]. From another perspective, the sludge contains high concentrations of organic matters that can be regarded as an available resource. A number of methods have been successfully used to recover resource/energy from WAS, e.g., anaerobic digestion for methane production [Appels et al., 2008], anaerobic fermen-tation for hydrogen generation [Guo, 2010], sludge composting for fertilizer utilization [Ndegwa and Thompson, 2001,U. Song, 2010], etc. Organic material in wastewater contains a huge amount of energy. Two technologies to harvest this energy are, namely, “Anaerobic hydrogen production” and “Microbial fuel cells (MFC)” [Sharma and Li, 2010, Appels et al., 2008, Li et al., 2009, U. Song, 2010]. It has been known for several years that bacteria found in wastewater could biologically convert the organic material into electricity [Allen and Bennetto, 1993]. The production of energy from wastewater provides
1.2. MICROBIAL FUEL CELL AS AN ENERGY HARVESTER 5
Table 1.1: Power density comparison of various energy harvesting sources Energy Source Performance(Power
Density) Notes References
Solar (direct
sunlight) 100 mW/cm3 [Randall,2003]
Thermoelectric 60 �W/cm3 From 5 °C [Stevens,
1999]
Blood Pressure 3�J/cm3/cycle [Deterre et al.,
2014] Ambient
airflow
harvester 2.3 �W/cm
3 At 20 m/s [S P Matovaand van
Schaijk, 2011]
Vibration 200 �W/cm3 [Roundy et al.,2003, Roundy
et al., 2004] Implanted microbial fuel cell 72.3mW/m 2 [Patil, 2013] Microbial fuel cell 1010 �W/cm3 Continuous-flow mode wastewater [Fan et al., 2007]
economic and environmental benefits. Besides capturing energy in the form of electricity, electricity can be used to power the wastewater treatment plant (WWTP) along cleaning the water. The aim of using this technology is to reduce the energy and cost of cleaning wastewater by using the microorgan-isms found in the wastewater to produce green electrical energy to operate the plant [Inc., 1999, Liu and Ramnarayanan, 2004]. This can be done by using MFCs to harvest that energy. Microbial fuel cell is a bio-electrochemical device suitable for producing electricity from wastewater. Capturing energy as a molecular biohydrogen by the fermentation of organic matter in wastewater treatment process could also be investigated to improve energy recovery in WWTP [Chong et al., 2009, Khanna and Das, 2013]. Integrating the two biotechnologies, anaerobic hydrogen production and microbial fuel cell, could op-timize the energy harvesting from wastewater treatment. In this context, wastewater treatment plants could be self-sufficient and may even contribute energy to the grid. It was reported that a potential en-ergy of 330 kWh could be produced from a WWTP that produces 7500 kg/day of waste organics [Logan, 2004b, Logan et al., 2006].
At this point, it is quite clear that MFCs in WWTP will not be considered with green energy genera-tors from sun, wind or hydraulic storage, in terms of power density and peak power. MFCs must be seen as a mean to add value to the energy spoil in WWTP. What is true for the sludge in WWTP is also true
6 CHAPTER 1. INTRODUCTION
for a large number of organic waste matters in agriculture [Shannon et al., 2008, Samuel Raj. B, 2013]. On a small scale, a MFC should be considered as energy harvester for sensor nodes.
1.3 Conventional fuel cell technology
Fuel cells offer an exciting technology to harvest electrical energy from biomass by bridging biological components together with electrochemical devices. A fuel cell is a system that converts the chemical energy of the fuel into electrical energy [Minh and Takahashi, 1995]. Fuel cells have been developed for use with a variety of different fuels, the most common being hydrogen. Fuel cells have become a widely studied energy conversion technology due to their high efficiency: simplicity in terms of moving parts; and wide-range of configurations, fuels, and applications. A fuel cell is like a battery that converts chemical energy into electrical energy. However a battery holds a closed amount of energy and once it is depleted, the battery must be recharged. While a fuel cell uses an external source of chemical energy and can operate as long as it is supplied with a source of oxygen and a source of hydrogen. In a hydrogen fuel cell, electricity is generated efficiently from the oxidation of hydrogen, coupled to the reduction of oxygen, with water as presented in Fig. 1.2-a. Hydrogen is supplied to the anode and split into an electron and a proton via electrochemical reactions. Electrons are released in the process and flow from the anode to the cathode through an external circuit as an electric current [Edwards et al., 2008]. The most commonly used electrocatalyst in fuel cells is platinum. Platinum is very efficient in oxidizing hydrogen and enabling high currents to be produced. The major disadvantage is that platinum is expensive and its availability limited, resulting in an expensive method of energy production [Sealy, 2008]. At the cathode, oxygen reacts with electron and proton that have travelled through the electrolyte to form the water.
1.4 Biofuel cell technology
A biological fuel cell (biofuel cell) is the offspring of two technologies: biotechnology and fuel cells. Like conventional fuel cells, a biofuel cells are composed of two electrodes (anode and cathode) sepa-rated by a membrane that is selective for the passage protons. Microbial biofuel cells (abbreviated as microbial fuel cell or MFCs) employ living cells (microorganisms) to catalyze the oxidation of the fuel, whereas enzymatic biofuel cells (EFCs) use enzymes for this purpose [Minteer et al., 2007]. MFCs or EFCs transform chemical energy into electrical energy via electrochemical reactions involving microor-ganisms or enzymes. Enzymatic fuel cells employ enzymes as biocatalysts instead of conventional noble metal catalysts [Ivanov et al., 2010]. The operation of these cells is the same as in conventional fuel cells; fuel is oxidized at the anode side. The anode extracts electrons and hydrogen ions from the sugar (glucose) through enzymatic oxidation as follows:
1.4. BIOFUEL CELL TECHNOLOGY 7
The electrons that are released are driven through an external electrical circuit to the cathode, where they combine with the final electron acceptor (typically oxygen) and protons to form water:
1/2O2+2H++2e−→ H2O
The principle of operation of the conventional polymer electrolyte membrane (PEM) fuel cell and an enzymatic fuel cell (EFC) are presented in Fig. 1.2. Even though the BFCs have been known for almost a century since the first microbial BFC was demonstrated in 1911 [Potter, 1911], the first enzyme-based biofuel cell was reported only in 1964 using glucose as a biofuel [Yahiro et al., 1964]. Enzyme-based biofuel cells remain limited by short active lifetimes, low power densities and efficiency.
(a) (b)
Figure 1.2: Schematic presentation of conventional PEM fuel cell (a) and enzymatic biofuel cell (b) Microbial fuel cells (MFCs) are special types of biofuel cells, producing electric power by utilizing microorganisms, instead of isolated enzymes, to assist redox reactions. MFCs have longer lifetimes (up to several years) than EFCs. In both microbial and enzymatic fuel cells, mediators are required to transfer electrons from the oxidized fuel to the electrode surface. The drawback of utilizing a mediator is toxicity and sustainability of the system. Most mediators are not easily re-oxidized in the anodic chamber. Therefore continuous replacement of mediators is required [Logan et al., 2006]. It was found that some microorganisms have the ability to produce their own mediators to promote extracellular electron transfer (endogenous mediators). The electrons transferred to extracellular space can be utilized to generate anodic current [Schröder, 2007, Minteer et al., 2007].
8 CHAPTER 1. INTRODUCTION
1.5 Microbial Fuel Cells
Luigi Galvani observed the bioelectric phenomenon first in 1790 [Luigi, 1791] but microbial fuel cells (MFCs) were not discovered until the beginning of the 20th century. Microbial fuel cells (MFCs) have been demonstrated to generate electricity from a variety of carbon sources used as electron donors. In 1911, M.C. Potter was the first to observe and describe how microbial conversions could create power and electrical current [Potter, 1911]. He monitored the electrical effects associated with fermentation in a galvanic cell based on platinum wires and a pure culture of yeast and discovered the first bio-based battery. The concept was presented again in the literature in 1931 by Cohen by connected many cells to generate 35 volts with a low current (2mA) [Cohen, 1931]. From 1911-1960, there was very little interest or advances in this field. MFCs became popular in the 1960s, when the “NASA” in USA proposed the idea to use MFCs to supply their applications in space missions from human waste [Canfield JH, 1963]. It was discovered that current and power output could be enhanced by using electron mediators to improve the electron transfer rate from microorganisms to the anode [Allen and Bennetto, 1993, Thurston C. F. and L., 1985].
The truly research and application of MFCs were not advanced until the 1990’s. Although the addi-tion of chemical mediators as methylene blue in these first MFCs, output currents and power densities were still low. In 1999, first report was published that species Shewanella could transfer electrons di-rectly in mediator-less microbial fuel cells [Kim et al., 1999]. That leaded to eliminate the mediator in MFCs. Such improvements were attributed to the minimized distance that the mediator had to travel between the electrode and bacteria and consequently minimizing the distance between electrodes of the MFC. This design exhibits a higher output current and power density resulting from using direct electron transfer bacteria. In that period, MFC’s field publication released research fundamentals, methods, and only few designs [Biffinger and Ringeisen, 2008]. Contributions from material science, environmental engineering, electrical engineering, biology, microbial physiology and electrochemistry have made re-cently the study of MFCs a truly interdisciplinary endeavor [Lovley, 2006, Logan et al., 2006, He et al., 2006, Bullen et al., 2006].
The basic concept of a MFC incorporates anodes and cathodes connected by an electrical load, sep-arated by a membrane (Fig.1.3). In the anode chamber, the fuel such as acetate or lactate is oxidized by a monoculture biofilms or bacterial microorganisms, releasing electrons and protons. In the anode chamber, it is essential that oxygen would not be present near the anode surface, as the electrode will function as the terminal electron acceptor for organisms associated with MFCs. The anode compartment is therefore an anaerobic region (i.e. no oxygen) where the anaerobic bacteria are located while the cath-ode compartment is an aerobic region (i.e. oxygen is present). An electrochemical reaction of reduction of oxygen and/or other molecules associated with wastewater, such as nitrates, occurs at the cathode of MFC [Rosenbaum et al., 2011]. The electrons produced through the oxidation of organic matter are transferred to the anode electrode, in the anode compartment, and travel through a wire and the electrical load to the cathode electrode. Protons are diffused through the membrane from the anode compartment
1.5. MICROBIAL FUEL CELLS 9
to the cathode to combine with the electrons and oxygen to form water. A catalyst at the cathode or a catholyte solution must be used to facilitate this reaction. The by-products of this reaction in MFCs are small amounts of carbon dioxide, from the decomposition of the organic matter and small amounts of water at the cathode.
The reactor is often divided by a proton exchange membrane into the anodic and cathodic compart-ments to form a two-chambered MFC. The proton exchange membrane allows the transport of positively charged ions (protons) from the anode to the cathode, thereby maintaining pH and electro-neutrality. The main drawback of using these separators is that they affect the fuel cell performance due to high Ohmic resistance contribution [Min et al., 2005]. The basic MFC which is used in MFCs research, such as exam-ining the performance of new electrode materials, is a conventional MFC ‘H’ type design, dual chamber, containing two bottles separated by a tube containing the proton exchange membrane like Nafion [Logan et al., 2005, Oh et al., 2009]. This two-chamber design would be difficult to apply to larger systems for continuous wastewater treatment.
Figure 1.3: Schematic representation of dual chamber MFC system.
A simpler design where the proton exchange membrane could be eliminated will offer more perspec-tive for energy harvesting. In a single chamber MFC design, the proton exchange membrane is either removed or pressed against the anode or cathode to form Membrane Electrode Assemblies (MEAs) as shown in Fig. 1.4. One is developed by Liu et al. [Liu and Ramnarayanan, 2004], which consisted of an anode placed at the bottom and a floating cathode placed at the top in a glass cylindrical chamber.
The basic advantage of exposing the cathode directly to air is to eliminate any limitation in oxygen supply to the electrode due to mass transport issues. These modifications minimize the internal resistance and increase the power generation [Logan et al., 2006]. Moreover this design is more suitable for large geometry scale and thus wastewater treatment [Liu and Ramnarayanan, 2004]. This design is therefore chosen in this study.
10 CHAPTER 1. INTRODUCTION
Figure 1.4: Schematic representation of single chamber MFC system.
1.6 Research efforts on MFCs
MFC technology is very attractive since it can potentially address two sustainability problems: energy production and wastewater management. It has been already proved that MFCs allow energy production from “poor” waste (e.g. sludge or wastewater) while providing inexpensive waste treatment.
In the past ten years, MFCs as a new source of bio-energy have been extensively reviewed [Pant et al., 2010] : various terminology and measurements [Logan et al., 2006], state of the art information on MFCs and recent improvements in MFC technologies [Du et al., 2007], electrodes performance and limitations in MFCs [Rismani-Yazdi et al., 2008, Pham et al., 2009] and practical implementation of BioElectrochemical Systems BESs [Rozendal et al., 2008]. The ability of the MFC to degrade a wide range of organic matters to provide efficiently the electrical energy has lead to a dramatic raise in the number of publications (see Fig. 1.5). Researches on MFCs are oriented towards four axes capabilities (Fig. 1.6):
• Configuration, design and materials • Operating conditions
• Microorganisms and the microbial activities • Power management unit and applications
MFCs are being fabricated using a wide variety of materials and diversity of configurations. Either single-or double-chamber MFC reactsingle-ors can be constructed fsingle-or electricity generation. Many materials have been studied and tested to achieve a best performance of the anode, the cathode and the membrane [Watanabe,
1.7. MICROBIAL FUEL CELLS AT AMPERE LAB 11
2008]. A more complex, stacked MFC is studied for the investigation of performances of several MFCs connected in series and in parallel [Aelterman et al., 2006a]. These systems are tested under a range of conditions including differences in temperature, pH, electron acceptor, reactor size, electrode surface areas and operation time [Hong Liu and Logan, 2005,Singh et al., 2010]. Energy harvesting from MFCs requires a specific design of power management system to deal with their characteristics (low power, low voltage). In literature, few papers are reported on electrical management of MFCs [Yang et al., 2012, Degrenne et al., 2012a]. Electrical conditioning of MFC(s) is still one critical part in the system.
Figure 1.5: The number of articles on MFCs. The data is based on the number of articles entitled MFC in the database Google scholar in July’ 2015.
1.7 Microbial fuel cells at Ampere lab
Electrical conversion related to MFCs started in 2009 with a first PhD. In this dissertation, N. Degrenne has studied the principle operation of MFCs [Degrenne, 2012]. A simple electrical model has been proposed and validated. A maximum power point tracking (MPPT) algorithm was adapted and tested with MFCs. The design of a Power Management Unit (PMU) for energy harvesting from MFCs was also studied. Another application of interest concerned the case where energy is harvested from several MFCs. It was found that the non-uniformities between the associated MFCs limit the efficiency of the stack. Many voltage balancing circuits can solve the former issue. Three of these circuits were analyzed
12 CHAPTER 1. INTRODUCTION
and evaluated by simulation. No experimental results related to voltage balancing circuit were presented in that work. The present work is a continuation of the former thesis delivered in 2012.
1.8 Scope of the thesis and objectives
Energy harvesting or energy scavenging is the conversion of ambient energy present in the environment into electrical energy. This relates to the conversion of small amounts of ambient energy for use in powering small, low-power, electronic devices. Low power applications are typically battery-powered. Wireless Sensor Network (WSN) is used in various application areas such as industrial, building, utilities, home, marine, habitat, traffic, animal, etc. With decrease in the size and cost of these systems, the use of wireless sensor nodes becomes widespread in process monitoring, natural environmental monitoring, security and surveillance [Gilbert and Balouchi, 2008, Stojmenovic, 2005]. WSNs provide important impact on many parts of human life, such as good understanding of human and animal behavior, natural and engineering systems [Raty, 2010,Kausar et al., 2014]. Energy harvesting has attracted much interest in the research community because of its potential use as a power supply in WSN to replace and overcome the limitations of batteries. There are several reasons why energy harvesting can be considered as an alternative to a battery.
• To harvest and use wasted energy.
• To remove the maintenance costs and time necessary for battery replacement.
• To overcome the problems related to the life-span of some device which is limited by the life-span of battery.
• To reduce the overall size of some electronic devices. • Reduce environmental impact.
• Enable a sensor to grab its own power by harvesting energy from the ambiance.
In a WWTP, huge amount of energy in organic matters are available. This energy could be harvested by MFC’s technology. Energy requirement for water treatment is usually given as a function of the global removal efficiency (Fig. 1.7). The global removal efficiency for WWTP is an indicator of the performance of the wastewater treatment plant. From the other hand, it was found that the power density of MFCs is about 1 kW/m3 [Fan et al., 2007]. In this context, WWTP could be self-powered by the
energy harvested from a large-scale MFCs. A stack of some MFCs is also able to supply a WSN. The thesis focuses on management of the energy produced by a MFC or by a stack of MFCs, hy-draulically coupled or isolated, for supplying autonomous sensors. It is divided in three parts.
1.8. SCOPE OF THE THESIS AND OBJECTIVES 13
1.8.1 Part 1: Modeling of MFC
Literature review in this part describes the operation of MFCs and links their electrical performances to bacterial mechanisms and the internal electrochemical reactions. The parameters which affect the performances of MFCs have been identified. The first step is to develop an analytical electrical model of MFCs based on the internal mechanisms. It presents the combination of static and dynamic mech-anisms of MFC for different operating conditions. The results of modeling may lead to new design or configurations to improve energy production.
1.8.2 Part 2: Energy harvesting from one or a stack of MFCs
Powering an autonomous sensor from the energy harvested from MFC(s) required a power management unit (PMU) between the MFC(s) and the load. This PMU is normally composed around DC/DC con-verters. The low-voltage and low power of MFCs make the power management unit (front-end PMU) the most crucial part in the system. The section starts with a brief literature review on the low-voltage self-starting DC/DC converters and MPPT methods what leads to the design of a self-starting flyback converter, operating in a Discontinuous Conduction Mode (DCM). A MPPT algorithm is implanted in the converter, based on the impedance matching method. Different configurations (e.g. serial associa-tion, parallel association... ) of MFC-powered systems are tested and compared. According to literature review, two voltage balancing circuits are also studied. These methods were applied and optimized for the first time on a serial stack of MFCs. An integrated voltage balancing circuit is designed, fabricated and tested with MFCs. The issue of the hydraulic coupling MFCs and its effect on the performance are analyzed for different operating conditions. This part introduces the concept of MFC-grid for powering off-the-grid applications.
1.8.3 Part 3: Field applications of MFC
One of the first applications could be the development of pilot-scale reactors at industrial locations where a high quality and reliable effluent is available. MFCs could be used for energy production and hydrogen production. In the section, MFCs are proved to be an alternative source of energy to batteries. Other applications are discussed in this part. The concept of an off-grid WSN powered by the energy harvested from MFCs is also presented.
14 CHAPTER 1. INTRODUCTION
1.8. SCOPE OF THE THESIS AND OBJECTIVES 15
Figure 1.7: Evolution of the energy consumption with the global removal efficiency of WWTP [Amiel et al., 2011].
Part I
Chapter 2
Literature review
Contents
2.1 Microbial fuel cell principles . . . 17 2.2 Output voltage of a MFC . . . 20 2.3 Parameters defining the performance of MFCs . . . 23 2.4 Materials of construction . . . 26 2.5 Electrical characteristics . . . 29
Microbial fuel cells (MFCs) have been used to produce electricity from different compounds, including acetate, lactate, and glucose. In this section, we will explain the principle of MFCs.
2.1 Microbial fuel cell principles
2.1.1 The energy metabolism of bacteria
All living organisms need energy and there are two main sources, chemical and light. Organisms can be classified regarding the kind of energy as either chemotrophs or phototrophs. Phototrophs are organisms that use photosynthesis to acquire energy. They use the energy from sunlight to convert carbon dioxide and water into organic materials to be utilized in cellular functions such as biosynthesis and respiration. The chemotrophs can be further divided into organochemotrophs which oxidize organic compounds and chemolithotrophs which oxidize inorganic compounds.
Electrons produced by the bacteria from the oxidation of substrates are transferred to the anode and flow to the cathode through the load. Electrons can be transferred to the anode by two main types of electron transfer. They are direct electron transfer (DET) and mediated electron transfer (MET) [Schröder, 2007]. In DET, the electrons are directly transferred from the microbial cell to the elec-trode via membrane-bound proteins, such as multiheme cytochromes, and/or via nanowires [Gorby and Fredrickson, 2006, Reguera et al., 2005]. In MET, electrons are transferred via an electrochemically
18 CHAPTER 2. LITERATURE REVIEW
active compound, which could be a metabolite produced by microorganisms or an endogenous redox mediator [Hernandez and Newman, 2001]. If no exogenous mediators are added to the system, the MFC is classified as a “mediator less”. These types of electron transfer can be represented in Fig. 2.1 and 2.2. The fundamental task of the microbial cell is to electrochemically convert the contained chemical energy in a substrate (fuel) into a form that is accessible for electrochemical oxidation and thus for conversion into electric energy [Schröder, 2007].
Figure 2.1: Electron transfer in microbial fuel cells
Figure 2.2: Illustration of the DET via (A) membrane bound cytochromes, (B) electronically conducting nanowires, (C) via oxidation of reduced fermentation products [Schröder, 2007].
2.1.2 Metabolism in MFC
Metabolisms of bacteria are discussed in [Aelterman et al., 2006a]. Chemotrophs bacteria are the most interesting. With their respiratory organisms, they oxidize chemical substances. In the presence of elec-tron acceptor such as oxygen, this reaction releases energy. When the oxidation and reduction reactions in the respiratory mechanisms can be separated, we can harvest a part of the energy available from these reactions. MFC generally consists of an anode, a cathode and an electrolyte (which can be in a membrane
2.1. MICROBIAL FUEL CELL PRINCIPLES 19
form in a double-chamber MFC). The anode and the cathode are electrically connected via an external circuit. In this design, the electrons generated in the oxidation reaction of the organic material near the anode are transferred by mechanisms of electron transfer to the anode. These electrons are then trans-ferred through the external circuit to the cathode for corresponding reduction and the protons migrate to the cathode and combine with the electrons and the catholyte, such as oxygen, which is reduced at the cathode surface. Oxygen is mostly used as the terminal electron acceptor for the cathode reaction in MFCs, because of its high redox potential and abundance and sustainability in the air.
2.1.3 Energy mechanisms in a MFC
If the reaction is thermodynamically favorable in an MFC, electricity could be generated [Logan et al., 2006]. The reaction can be evaluated in terms of Gibbs free energy (Gtot) which is a measure of the
maximal work that can be derived from the overall reaction [Bard et al., 1985]. Depending on the presence or absence of terminal electron acceptors, two major metabolic pathways can be distinguished: respiration in the presence of oxygen and fermentation in the absence of oxygen and exogenous oxidants. Aerobic respiration will occur with the highest energy gain when oxygen is available [Reimers CE, 2001, Tender, 2002]. Bacteria use inorganic and/ or organic compounds as terminal acceptors by an anaerobic respiration. The energy gain for the organisms in this case is limited by the low positive redox potentials of these oxidants and usually considerably lower compared to aerobic respiration. In fermentation, parts of the substrate serve as electron acceptor and become reduced, whilst other parts serve as electron donors and are oxidized. The energy gain by fermentation (2.1) will not exceed 7-8% of the energy gain by oxidation (2.2) [Thauer and Jungermann, 1977].
Fermentation of acetate:
CH3COO−+H++2H2O → 2CO2+4H2 (∆G0=−61kJ/mol) (2.1)
Oxidation of acetate:
CH3COO−+H++2O2→ 2CO2+2H2O (∆G0=−854kJ/mol) (2.2)
The theoretical energy available for the bacteria corresponds to the difference between the energy content of the reactants and the products as given in (2.3).
20 CHAPTER 2. LITERATURE REVIEW
Where n is the number of electrons involved in the reaction (mol), F is the constant of Faraday (9.65*104C/mol), and E
REDand EOX are the reduction and oxidation potentials respectively. A part of
this energy,∆Gbiois dissipated in the MFC due to the electrochemical and biological process. Therefore
the total available energy of an electrochemical system significantly decreases and the available electrical energy could be given by 2.4.
∆Gelec=∆Gtot− ∆Gbio (2.4)
If the biological energy (∆Gbio) becomes too large, the output electric energy will decrease. In a
MFC, bacteria transfer electrons from the substrate at a low potential to the anode. Thus the energy gain for the bacteria is determined by the anode potential. To obtain a higher metabolic energy gain for the bacteria, a higher difference between the redox potential of the substrate and the anode potential is required. In (2.3), the variable n denotes the number of electrons transferred via electron transfer mechanisms. For acetate, the maximum number of electrons transferable is 8. In a microbial metabolism, only a limited number of electrons are transferable to the anode via a certain mechanism [Schröder, 2007, Logan et al., 2006].
2.2 Output voltage of a MFC
The oxidation of organic matter at the anode is coupled to a reduction reaction at the cathode. In MFC, a carbon source is oxidized under anaerobic conditions, using the anode as final electron acceptor. Elec-trons flow along the electrical circuit from the anode to the cathode. Produced protons are consumed by the reduction reaction at the cathode. In the case of the oxygen is used as electron acceptor at the cathode and acetate as the electron donor, the half reactions at the anode and cathode can be written as [Logan et al., 2006]:
Anode:
CH3COO−+4H2O → 2HCO−3 +9H++8e− (2.5)
Cathode:
O2+4H++4e−→ 2H2O (2.6)
The maximum potential is the difference between the half reactions of the electron donor and accep-tor under ideal conditions as expressed in (2.7).

![Figure 4.2: Transformer-based start-up circuit with two windings transformer (left) and with three wind- wind-ings transformer (right) [Adami et al., 2011]](https://thumb-eu.123doks.com/thumbv2/123doknet/14693984.745853/77.892.131.727.177.359/figure-transformer-based-circuit-windings-transformer-transformer-adami.webp)
![Figure 4.4: Schematic of the boost converter with a start-up sub-circuit [Degrenne et al., 2012a,Degrenne, 2012]](https://thumb-eu.123doks.com/thumbv2/123doknet/14693984.745853/78.892.206.737.173.564/figure-schematic-boost-converter-start-circuit-degrenne-degrenne.webp)
