HAL Id: hal-02400601
https://hal.archives-ouvertes.fr/hal-02400601
Submitted on 17 Dec 2020HAL is a multi-disciplinary open access
archive for the deposit and dissemination of sci-entific research documents, whether they are pub-lished or not. The documents may come from teaching and research institutions in France or abroad, or from public or private research centers.
L’archive ouverte pluridisciplinaire HAL, est destinée au dépôt et à la diffusion de documents scientifiques de niveau recherche, publiés ou non, émanant des établissements d’enseignement et de recherche français ou étrangers, des laboratoires publics ou privés.
A tunable filter for high molecular weight DNA
selection and linked-read sequencing
Nicolas Milon, Juan-Luis Fuentes Rojas, Adrien Castinel, Laurent Bigot,
Géraud Bouwmans, Karen Baudelle, Audrey Boutonnet, Audrey Gibert,
Olivier Bouchez, Cécile Donnadieu, et al.
To cite this version:
Nicolas Milon, Juan-Luis Fuentes Rojas, Adrien Castinel, Laurent Bigot, Géraud Bouwmans, et al.. A tunable filter for high molecular weight DNA selection and linked-read sequencing. Lab on a Chip, Royal Society of Chemistry, 2020, 20 (1), pp.175-184. �10.1039/C9LC00965E�. �hal-02400601�
TUNABLE FILTER FOR HIGH MOLECULAR WEIGHT DNA SELECTION
AND LINKED-READ SEQUENCING
Nicolas MILON1, 2, Juan-Luis Fuentes Rojas1, Adrien Castinel4, Laurent Bigot3, Géraud Bouwmans3, Karen Baudelle3, Audrey Boutonnet2, Audrey Gibert4, Olivier Bouchez4, Cécile Donnadieu4, Frédéric Ginot2, Aurélien
Bancaud1,*
1
CNRS, LAAS, 7 avenue du colonel Roche, F-31400, Toulouse, France. 2
Adelis Technologies, 478 Rue de la Découverte, 31670 Labège, France 3
Univ. Lille, CNRS, UMR 8523 - PhLAM - , F-59000 Lille, France 4
INRA, US 1426 GeT-PlaGe, INRA Auzeville, F-31326, Castanet-Tolosan Cedex, France
Abstract (148 words)
In third generation sequencing, the production of quality data requires the selection of molecules longer than ~20 kbp, but the size selection threshold of most purification technologies is smaller than this target. Here, we describe a technology operated in a capillary with an accordable selection threshold in the range of 3 to 40 kbp controlled by an electric field. We demonstrate that the selection cut-off is sharp, the purification yield is high, an analytical model predicts the actuation settings of the filter, and the purification throughput is scalable. The selection of high molecular weight genomic DNA from the Melon Cucumis melo L., a diploid organism of ~0.45 Gbp, is then reported. Linked-read sequencing data show that the N50 phase block size, which scores the correct representation of the two chromosomes, is enhanced by a factor of 2 after size selection, establishing the relevance and versatility of our technology.
Introduction
DNA sequencing technologies have been maturing rapidly to enhance the sequencing speed, throughput and associated cost. The list of annotated genomes has been growing in consequence together with the resolution of complex genomic structures 1,2. Although essential results for research and diagnostics are collected with second generation sequencing technologies (SGS), short-read sequencing holds some intrinsic limitation for the unbiased assembly of genomes 3,4. The long read capability of third generation sequencing technologies (TGS) 5,6 overcomes some of these limitations, yet the full potential of TGS relies on quality library preparation with high molecular weight (MW) DNA molecules in the range of 20 to 200 kbp 7.
The process flow for DNA sequencing starts with a purification step (Fig. 1A), which is most commonly operated by controlling the binding of genomic DNA on a matrix and subsequently releasing it to an appropriate buffer 8, or by DNA precipitation. Matrix binding and precipitation protocols have performed equally well for the production of quality sequencing data with SGS 9. However, molecules of more than ~20 kbp tend to be degraded during these purification protocols 10, and a size selection step is usually carried out to remove the low MW residues before library preparation in TGS. If the MW of these by-products is very low, typically a few nucleotides, they can readily eliminated by solid-phase reversible immobilization 11,12. The selection of higher MW residues is however more laborious, because it is often performed by pulsed-field gel electrophoresis for separation followed by band excision and electroelution 13–15. Furthermore, the yield of this size selection process is lower than 50% for molecules of 20 to 50 kbp, imposing the purification of large initial amounts of genomic material, which are not always accessible for e.g. single cell sequencing studies 16. The development of fast and high-yield size selection technologies is therefore direly needed to enhance and speed up the extraction of quality data in TGS.
Microfluidic technologies offer unique solutions for the manipulation and purification of high MW DNA. For instance, DNA electrophoresis in artificial separation matrices made out of periodic arrays of obstacles etched in glass or silicon demonstrated their relevance for the sorting of ~100 kbp in 15 s 17. Because DNA molecules are not entrapped in the separation matrix, they can subsequently be sorted and purified by size, as recently reported with a selection cut-off of ~2 kbp 18. Alternatively, we recently developed the “µ-Laboratory for DNA Analysis and Separation” (µLAS) technology for DNA analysis in the size range 0.1 to 200 kbp 19,20. This technology is operated in a capillary electrophoresis system by controlling the fluid flow and
concentrated before its analysis with a limit of detection of 10 fg/µL 19,20,22. Because the technology is operated without separation matrices, it can be used for DNA size selection 20. Here, we set out the development of a tunable size selection filter to rapidly produce 10 to 20 ng of DNA for TGS. The first section of this report describes the operating principle of this filter, which is subsequently operated in a monocapillary system. The selection cut-off can be tuned with excellent precision in the size range 3 to 40 kbp by monitoring the electric field in the range of 3 to 7 kV/m. We then prove that the throughput of the filter is scalable by parallelizing the technology in a multicapillary system of 61 channels. These settings allow us to produce 17 ng of high MW genomic DNA in two hours. The resulting sample is analyzed by linked-read sequencing, which consists in partitioning long DNA molecules into one million droplets each containing a specific barcode and the material for library preparation, before standard short-read sequencing 23. Sequencing data are significantly improved with the purification than without it for haplotype resolution. We finally discuss the different applications for which µLAS size selection technology may offer advantages to obtain quality sequence data.
Principle of the DNA filter controlled by an electric field
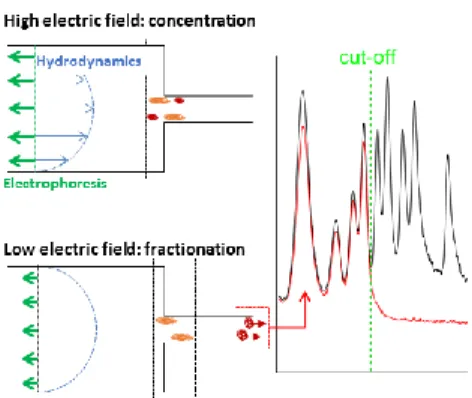
In the conventional operation of µLAS 19,21, DNA manipulation is performed in a fluidic system formed by the assembly of two capillaries of different inner diameters of 330 and 50 µm (Fig. 1B). The sample is conveyed in the large capillary using a constant pressure source and a counter electrophoretic force (blue and red arrows in Fig. 1B, respectively). In a viscoelastic solution, the shearing of the fluid around DNA molecules is associated to a build-up in normal stress, which leads to migration in the direction transverse to that of the flow. Transverse viscoelastic forces drag and trap DNA molecules at the vicinity of the walls 24,25 where
the flow velocity is low. Because transverse viscoelastic forces are low in the large capillary, hydrodynamic transport is prevalent upstream of the constriction. Conversely, the fast flow velocity in the narrow capillary triggers high transverse viscoelastic forces associated to a mode of transport dominated by electrophoresis, and defining a region of accumulation at the constriction (green rectangle in Fig. 1B). As soon as the electric field decreases, transverse viscoelastic forces decrease and DNA molecules progressively escape from the accumulation region by migrating in the small capillary. The DNA filter exploits the size dependence of viscoelastic transverse forces and consists in setting the electric field to a threshold value that enables the passage of molecules up to a threshold size while retaining the high MW fraction (middle panel in Fig. 1B).
The purified genomic material is finally collected by turning off the electric field and collecting the molecules in a fresh vial (lower panel in Fig. 1B).
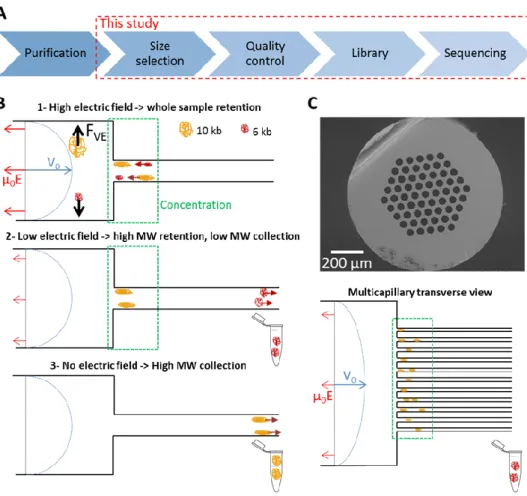
Figure 1 : Principle of the DNA size selection filter for TGS. (A) The panel shows the main steps of the process flow for
TGS. Our study is focused on the size selection of genomic DNA and the analysis of the resulting material by linked-read sequencing (see Methods in Supplementary Material). (B) The sketch represents the response of DNA in a capillary
system. Transport is controlled by a Poiseuille flow opposed to an electrophoretic force (blue and red arrows, respectively). The balance between hydrodynamic and electrophoretic forces is favorable to hydrodynamic upstream of the
constriction and to electrophoresis downstream, defining a region of DNA accumulation represented in green. By tuning the electric field (middle panel), we allow the leak of low MW DNA molecules whereas longer ones remain trapped in the
concentrator. The high MW fraction is collected by switching off the electric field (bottom panel). (C) The electron micrograph shows a multicapillary system with 61 channels of 46 µm, and the sketch presents the processing of DNA in
this system. Photographs of the devices shown in panel (B) and (C) are shown in Supplementary Fig. SXX.
More quantitatively, we showed that the transverse viscoelastic force increased linearly with the
fluid maximum velocity and the electrophoretic velocity with the mobility 24,25, following a scaling in the form:
(1)
with the size of the chain, the radius of the capillary, and the distance from the walls. The linear dependence of the transverse force with DNA size comes from the fact that the molecule can partitioned into a series of “Kuhn” segments, each undergoing a “monomeric” transverse force and each contributing additively to the total transverse force acting on the molecule. We note that transverse migration also occurs in Newtonian fluids 26,27, and the transverse force is expected to scale linearly in and but not in DNA size.
The force in Eq. (1) is equivalent to an elastic spring that keeps the molecule near the wall, allowing us to deduce the average position of DNA from the wall based on Boltzmann statistics 24,25:
(2)
The threshold size corresponds to the situation of null velocity with balanced hydrodynamic and electrophoretic velocities at the constriction:
(3)
Plugging Eq. (2) into Eq. (3), we deduce that:
(4)
Because the electric field can be tuned with excellent precision, the size selection threshold appears
to be highly accordable. The cubic dependence in electric field also suggests that can be adjusted over a broad range with small variations of the electric field.
The prediction of the size selection threshold (Eq. (4)) is expected to be relevant for a multicapillary system, which consists of parallel channels of equal diameter (Fig. 1C, see Methods in Supplementary Material for details on the fabrication protocol). Indeed, the flow velocity and electric field are the same in each narrow channel, and they can be set to the same regime of concentration as in the monocapillary system (green rectangle in Fig. 1C). Notably, because the total flow rate is the sum of that flowing in each channel, we expect the multicapillary system to be a scalable technology for processing larger volumes and larger DNA quantities.
Experimental
Reagents
Molecular biology grades chemicals were purchased from Sigma-Aldrich (St. Louis, MO). The Quick-Load ® 1 kb Extend DNA Ladder (# N3239S), containing 13 bands from 0.5 to 50 kbp, was purchased from New England Biolabs (Ipswich, MA). Running buffers was composed of 1X Tris-Borate-EDTA (TBE, 89 mM Tris, 89 mM boric acid, 2 mM EDTA) supplemented with 3% 43 kDa PVP 19,28. The intercalating dye (Picometrics Technologies, France, # 16-BB-DNA1K/01) was used at a 2X final concentration in the buffer solution. All buffer solutions were filtered at 0.22 µm before use.
Mono and multicapillary systems fabrication
Fused silica monocapillaries were purchased from Polymicro Technologies (Phoenix, US). The monocapillary device contained three pieces of capillary, (i) 5 cm in length and 50 µm in inner diameter (ID), (ii) 4 cm in length and 330 µm in ID used as an injection chamber of 3.4 µL, and (iii) 19 cm in length and 50 µm in ID. Monocapillary devices were assembled manually at Picometrics using a UV-curable acrylate-based glue, as previously described in 19.
The multi-capillary system is based on the technology developed to manufacture photonic crystal optical fibers by the stack-and-draw method 29. More precisely, a meter-long silica tube of 25 mm outer diameter (OD) and 15 mm ID was elongated into several tens of millimeter-sized capillaries. This operation was performed on a drawing tower, a vertical equipment consisting in a feeding preform unit, a high temperature furnace, and a tractor unit. The resulting monocapillaries were then assembled manually to form a hexagonal stack inserted into a tube of 25 mm OD and 19 mm ID. This stack was eventually drawn into a multi-capillary cane using the same drawing tower. A fiber of ~900 µm in OD and constituted of 61 capillaries of 45.8 µm in diameter (standard deviation 0.6 µm) was obtained. In order to fabricate the multicapillary system, we fitted a 2 cm long section of multicapillary fiber into a glass vial insert of 300 µL (# 4025 GF-625, J.G. Finneran Associates, Vineland, NJ) and assembled it with the acrylate UV-curable glue.
Instrumentation of capillary systems
Monocapillary experiments were carried out with an Agilent 1600CE system equipped with a Zetalif LED 480 nm detector (Picometrics Technologies, France) and modified to install the capillary device and place the optical head of the detector 7 cm downstream of the concentration junction. Prior to use, every capillary device was rinsed with 1 M NaOH, then with 0.1 M HCl, and finally flushed with de-ionized water. Prior to each experiment, the devices were conditioned with 0.1 M HCl, 1% poly-vinylalcool (PVA), and flushed with running buffer. We used the constriction facing the short capillary of 5 cm or the long one of 19 cm for purification or size characterization operations, respectively. This choice was motivated by the need to speed up the flushing of low MW residues during purification operations.
The multicapillary device was operated on a custom prototype with two electrodes connected to the insert and collection vial. Liquid flows characterized by a mean flow velocity of 1.0 mm/s were controlled by gravity (See supplementary for hydrodynamic modelling). The samples were manually loaded at the entrance of the fiber and a carousel with several tubes was placed at the outlet for sample fractionation.
After size selection operations with the mono- or multicapillary systems, the different sample fractions were characterized with the µLAS separation and titration protocol described in 28. Sizing and quantification errors are 3% and 10%, respectively.
Sequencing library construction using the GemCode platform
A Chromium Controller Instrument (10× Genomics) was used for sample preparation at the GeT-PlaGe core facility (Toulouse, France). Sample indexing and partition barcoded libraries were prepared using the Chromium Genome Sequencing Solution (10× Genomics, Pleasanton, CA). GEM reactions were performed on 5 ng of genomic DNA, with or without µLAS size selection, and DNA molecules were partitioned and amplified into droplets to introduce a 16-bp partition barcodes. GEM reactions were thermally cycled (30°C for 3h and 65°C for 10 min; held at 4°C) and after amplification the droplets were fractured. P5 and P7 primers, Read 2, and Sample Index were added during library construction according to 10x Genomics protocol. Libraries were amplified using 10 cycles of PCR and the DNA was subsequently size selected to 450 bp by performing a double purification on AMPure Xp beads. Library quality was
assessed using a Fragment Analyzer and quantified by qPCR using the Kapa Library Quantification Kit. Sequencing was conducted with an Illumina Hiseq3000 with 2×151 paired-end reads based on the manufacturer’s protocols. The depth of sequencing was 65X.
Alignment, barcode assignment and calculation of sequencing metrics
The LongRanger analysis software (10x Genomics, v2.2.2) was used to convert sequences to fastQ files and to remove sequences that do not have the exact index sequence given by Chromium. The fastQ files in output were then used to produce a graph-based assembly by Supernova (10x Genomics, v2.2.2). The Fasta file of genome assembly was created with pseudohap formatting option. Finally, statistics were computed by Quast software (quast-5.0). Analysis was performed thanks to the Genotoul bioinformatics platform in Toulouse, Midi-Pyrenees (Bioinfo Genotoul), which provided computing and storage resources.
Results
DNA size selection in a monocapillary system
We first characterized the size selection filter with a high MW DNA ladder containing 13 bands between 0.5 to 50 kbp and using a commercial capillary electrophoresis system (see Methods). Our experiments consisted in loading 0.1 ng of DNA ladder in 1 µL, i.e. at a concentration of 100 pg/µL, in the monocapillary system (upper panel of Fig. 1B). During a first phase of 60 minutes, we eliminated the low MW fraction of the sample with a flow of buffer at a velocity of ~1 mm/s and different settings for the electric field spanning 3 to 7 kV/m (middle panel in Fig. 1B). The length of the small capillary was 5 cm, so the convection time of the buffer was one minute, i.e. much less than the process time of 60 minutes. In fact, the duration of this step was adjusted to ensure the elimination of low MW molecules, which migrate at a slow velocity compared to the buffer due to transverse forces. For instance, the typical migration speed of a 20 kbp fragment was ~0.13 cm/min (data not shown), so that ~40 min were necessary for their escape from the 5 cm-long capillary. The
volume of fluid collected at the outlet during these 60 minutes was ~10 µL, and since it was collected in a fresh vial initially filled with 20 µL of buffer, the dilution of the low MW “leak” fraction was 30-fold.
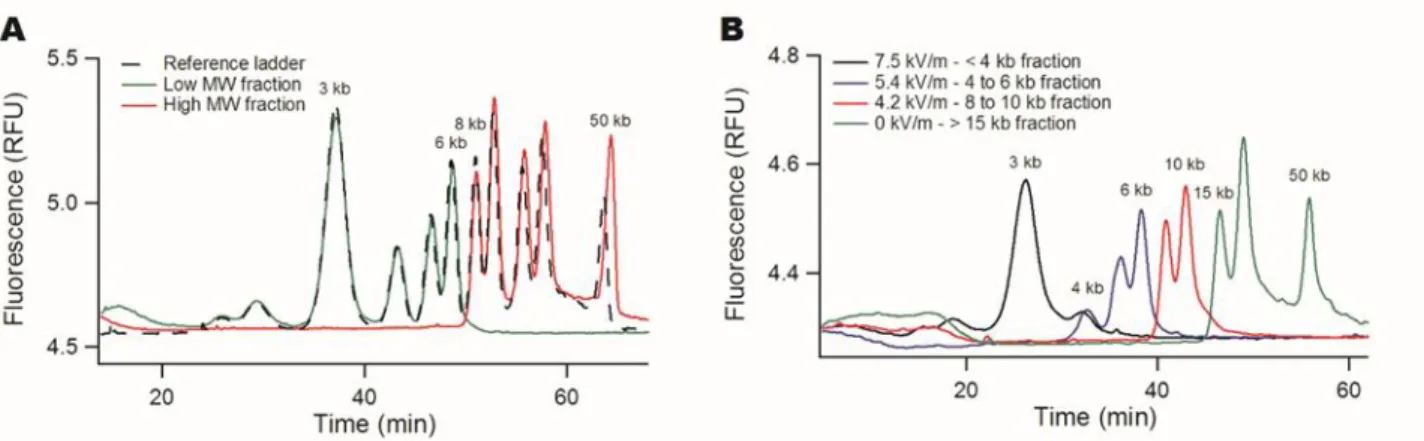
Figure 2: Tunable DNA size filtration in a monocapillary. (A) The chromatograms show the separation of the DNA
ladder with the µLAS technology using the separation settings reported in ref. 28. The dashed black curve corresponds to the reference ladder with a few annotated bands, and the leak and retained fractions are plotted in green and red, respectively. The electric field was set to 5.4 kV/m during the selection phase, corresponding to a cut-off size of ~7 kb. The red and green curves have been multiplied by the dilution factors of 11.5 and 30, respectively. (B) The same ladder shown in (A) is fractionated into four fractions using three consecutive settings for the electric field of 7.5, 5.4, 4.2 kV/m, and a
final collection step without any electric field (as indicated in the legend).
During the second step, we collected the retained high MW fraction by hydrodynamics only during ten minutes in a fresh vial containing 10 µL of buffer. The final volume of the collected sample was 11.5 µL. The leak and retained fractions were subsequently analyzed using the µLAS high MW separation method developed in ref. 28 in order to determine their molecular composition and concentration. In Fig. 2A, we report the reference ladder together with the leak and retained fractions (black, green, and red curves, respectively), as obtained with a selection filter actuated with an electric field of 5.4 kV/m. The size of the cut-off appeared to be ~7 kbp with a sharp separation between the bands of 6 and 8 kbp. The superposition of the different curves testified that the yield of this purification process was higher than ~80% for all the bands in the sample.
We then modulated the electric field in order to fractionate the same ladder sample into four fractions. Using three threshold voltages of 7.5, 5.4, and 4.2 kV/m, we performed three consecutive purification phases of one hour each, and finally collected the remaining fraction during 10 minutes. The resulting four fractions were analyzed to evaluate the three size selection cut-offs of 4, 7 and 12 kbp (Fig. 2B). The final retained fraction plotted in green contained the peaks of 15, 20, and 50 kbp, suggesting that our technology was adequate for high MW DNA purification in the context of TGS technologies. Furthermore, the size selection threshold could
be adjusted to ~40 kbp, i.e. with the purification of the 50 kbp band from the rest of the ladder (Supplementary Fig. S2), by setting the electric field to 3 kV/m.
We then checked the validity of our model to predict the size selection cut-off (Eq. (4)). We performed a series of 13 experiments using different settings for the flow velocity and the electric field in the range 0.3 to 1.5 mm/s and 3 to 7 kV/m, respectively. We estimated the cut-off size with a precision determined by the size difference between the last peak in the leak fraction and first peak in the retained fraction. We plotted as
a function of the electric field (Fig. 3A), showing a non-linear decrease as the electric field increased. We also noted that increased with the flow velocity at constant electric field, in agreement with the prediction of our
model in Eq. (4). This relevance of our model was strongly confirmed by plotting the size cut-off as a function of (Fig. 3B), because a linear trend associated to a Pearson coefficient R2 of 0.94 was detected (dashed
line in Fig. 3B). Altogether, we demonstrate the principle of a versatile and predictable DNA selection filter with a tunable cut-off size in the range of 3 to 40 kbp controlled by an electric field delivered by a commercial capillary electrophoresis system.
Figure 3: Control of the size selection threshold by the electric field. (A) The graph presents the size selection cut-off as a
function of the electric field for various flow velocities, as indicated by the colorbar. Note that five experiments were carried out with a constant electric field of 3.8 kV/m and different flow velocities. (B) The same dataset can be cast on a
master curve (dashed line) using the normalization suggested by our model (Eq. (4)).
DNA saturation in the monocapillary device
The production of 10 to 20 ng of DNA is required for the standard work flow of linked-read sequencing. We thus aimed to evaluate the maximal amount of DNA that could be processed in the monocapillary device.
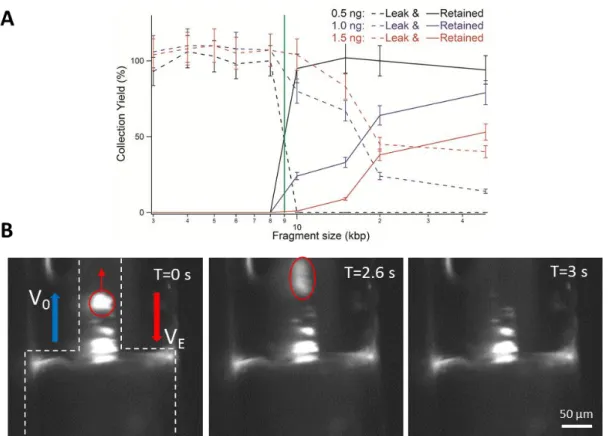
We performed a series of experiments that consisted in injecting the DNA ladder in gradual increments starting from 0.5 ng (i.e. five times more than in Fig. 2A) using a size selection cut-off at 9 kbp. Good size selection performances were obtained for an injection of 0.5 ng, as shown by the sharp separation between the curves representing the low MW leak and high MW retained fractions (dashed and solid lines in Fig. 4A, respectively). Note that the collection yield is higher than 90% for the bands of 10, 15, 20 and 50 kbp (black solid line). As we doubled the amount of DNA, we noticed that the performances of the size selection filter were reduced because the bands of more than 10 kbp were present in the leak fraction (dashed blue dataset in Fig. 4A). We concomitantly noticed that the collection yield decreased to ~50%. These trends were further enhanced using 1.5 ng of DNA (red dataset in Fig. 4A). Because the bands of 10 to 50 kbp corresponded to 34% of the whole ladder mass according to the supplier, we concluded that the monocapillary device was an efficient size selection filter for up to ~0.2 ng of DNA.
In order to investigate the saturation of the size selection filter, we performed live fluorescence microscopy analysis of the dynamics of DNA concentration at the constriction. We injected 8 ng of 50 kbp DNA, i.e. forty times more than the saturation threshold, and set the cut-off to 10 kb with an electric field and hydrodynamic flow velocity of 5.4 kV/m and 1.5 mm/s, respectively. We detected the accumulation of DNA molecules in the narrow capillary, and the formation of bright clusters of heterogeneous sizes (Fig. 4B). These clusters could not be stably retained, as shown by one escape event associated to hydrodynamic-dominated transport of a bright mass of DNA along the narrow channel (Fig. 4B). By approximating the region where DNA accumulates by a cylinder of 50 µm in diameter and 200 µm in height, we evaluated its volume to ~0.4 nL. Taking the saturation threshold to be 0.2 ng, we then deduced that the size selection filter saturated for a DNA concentration of ~0.5 mg/mL. Note that this estimate is likely under evaluated because DNA accumulates close to the walls and not evenly across the capillary section. DNA concentration at saturation then appears to be lower than the solubility limit of this biomolecule in the range 10-100 mg/mL 30, but larger than the threshold of DNA aggregation driven by AC electric fields of 0.05 mg/mL 31. Consequently, irrespective to the mechanism of clustering, the saturation of the size selection filter appears to arise from the confinement of the retained fraction in a narrow volume and the ensuing molecular aggregation.
Figure 4: Saturation of the DNA filter. (A) The graph shows the yield of the leak and retained fractions (represented as
dashed and solid lines, respectively) as a function of DNA size in logarithmic scale. We use the same ladder as in Fig. 2 and set the cut-off to 9 kbp (green line). The concentration is determined with an error of 10%, as shown in ref. 28. (B) The
fluorescence micrographs present a time-lapse recording of the response of high MW DNA during the size selection process. Molecules are concentrated at the entry of the narrow capillary (shown with dashed white contour lines). The
bright cluster marked in red is not retained and leaks away from the constriction.
Scale up of the technology with multicapillary systems
In order to increase the throughput of the size selection filter, we opted for the parallelization of technology and fabricated a multicapillary system containing 61 channels of 46 µm in diameter (Fig. 1C). We indeed expected the saturation threshold to be multiplied by a factor of 60, allowing ~ ng of DNA to be processed in one operation. Because the multicapillary system could not be integrated in commercial Capillary Electrophoresis instruments, we designed a prototype for sample fractionation (Supplementary Fig. S3). The gravitational flow was sufficient to induce a fluid velocity of 1.0 mm/s in the channels (see Supplementary Material), thereby setting accurate actuation conditions for size filtration. Note
that the size selection process was accelerated to 30 minutes because the length of the multicapillary was halved in comparison to the monocapillary.
We first checked that the size selection threshold was similar by performing sample fractionation with an electric field set to 4 kV/m during the retention phase. We expected a size cut-off of 12 kb, and measured it at 9 kbp (Supplementary Fig. S4A), confirming that the operating principle of the technology remained nearly the same in the mono- and multi-capillary systems. The quality of the selection filter’s cut-off was slightly decreased, as we detected residual amounts of the 8 and 6 kbp bands in the retained fraction of 7 and 3%, respectively. In order to select high MW DNA for sequencing applications, we then established the size selection cut-off to ~40 kbp by adjusting the electric field to 2.9 kV/m (Fig. 5). For this experiment, we spiked the DNA ladder with an additional DNA fragment of 100 kbp, which was collected in the retained fraction together with the 50 kbp band (red curve in Fig. 5). Because the threshold was close to 50 kbp, we also detected a small proportion of 50 kbp DNA in the leak fraction (blue curve in Fig. 5). These experiments hence showed that the selection technology could be operated with a multicapillary system with the same electro-hydrodynamic actuation parameters as in the monocapillary.
Figure 5: High MW size selection in the multicapillary system. The plot presents chromatograms with the reference
ladder with bands of 3 to 50 kbp (dashed black curve), and the leak and retained fractions in blue and red, respectively. The electric field was set to 2.9 kV/m during the selection phase. The red and blue curves have been multiplied by the
We then evaluated the saturation threshold of the multicapillary device by injecting gradual amounts of the kb extend DNA ladder from 5 to 50 ng, i.e. 1.5 ng to 15 ng retained at the constriction, with the same actuation parameters as in Supplementary Fig. S4A. The collection yield appeared to be lower in the multicapillary vs. monocapillary system. We indeed measured collection yields of 75% and 55% for the leak and retained fractions, respectively (Supplementary Fig. S4B). This apparent loss of DNA remains unclear, but we suspect that some molecules remain trapped on the outer glass shell of the multicapillary of 250 µm (Fig. 1C) where the flow velocity and electric fields are nearly null. The selection cut-off appeared to be sharp for 1.5 and 4.5 ng of high MW DNA at the constriction, but the size selection cut-off broadened for 15 ng of DNA. The presence of the 10 to 50 kbp fragments in the leak fraction indicated the saturation of the multicapillary system, likely associated to the formation of aggregates during the size selection process. Consequently, the scale up of our technology to 61 capillaries allowed us to increase the saturation threshold by a factor of 20, meeting the objectives of increasing the throughput without changing the actuation settings.
High MW DNA selection for long read sequencing
We finally proceeded to the selection of high MW genomic DNA from the melon Cucumis melo L., an important horticultural crop worldwide with a diploid genome of ~450 Mbp 32. The Melon genomic DNA was purified in liquid phase, resulting in a broad size distribution from 2 to more than 50 kbp (black curve in Fig. 6A), as confirmed by FEMTO Pulse analysis (Supplementary Fig. S5). The presence of low MW residues justified the process of size selection for TGS. Our experiments hence consisted in assessing the quality of sequencing data obtained with or without size selection. They were carried out by the construction of a DNA library with the gel bead partitioning system, called the Chromium technology, followed by sequencing on an Illumina SGS platform (See Methods).
We first processed a low quantity of 2.5 ng of the Melon DNA sample using the same voltage threshold of 2.9 kV/m as for the DNA ladder. As expected, the retained fraction was larger than ~40 kbp (red curve in Fig. 6A) and the leak fraction was centered at ~25 kbp (blue curve in Fig. 6A). Next, we aimed to increase the collection to reach the ~15 ng required for sequencing operations. Because the proportion of molecules of more than 40 kbp represented ~20% of the sample and the collection yield was ~50%, we performed the operation with an initial input of 100 ng. In addition, we repeated the size selection operation 4 times consecutively so as
to retain ng at the constriction each time and avoid saturation. At the end of this selection process, which took
place in 2 hour, we collected 25 µL of material at a concentration of 0.7 ng/µL. Hence, we obtained ~17 ng of genomic DNA, in good agreement with our initial specifications. The size distribution of the purified sample was not as sharp as in the calibration experiment, as shown by the presence of molecules of 15 kb (red curve in Fig. 6B), but the removal of DNA fragments lower than ~10 kbp was clearly achieved. Because the selection threshold was lower than expected, we note that the recovery yield was lower than initially expected. This degradation of size selection performances may be due to the rapid saturation of the filter due to the presence of very high MW molecules (see more below). We indeed noticed that saturation was decreasing with DNA MW, as for instance exemplified by the saturation at 5 ng with a fragment of 0.2 kbp (data not shown).
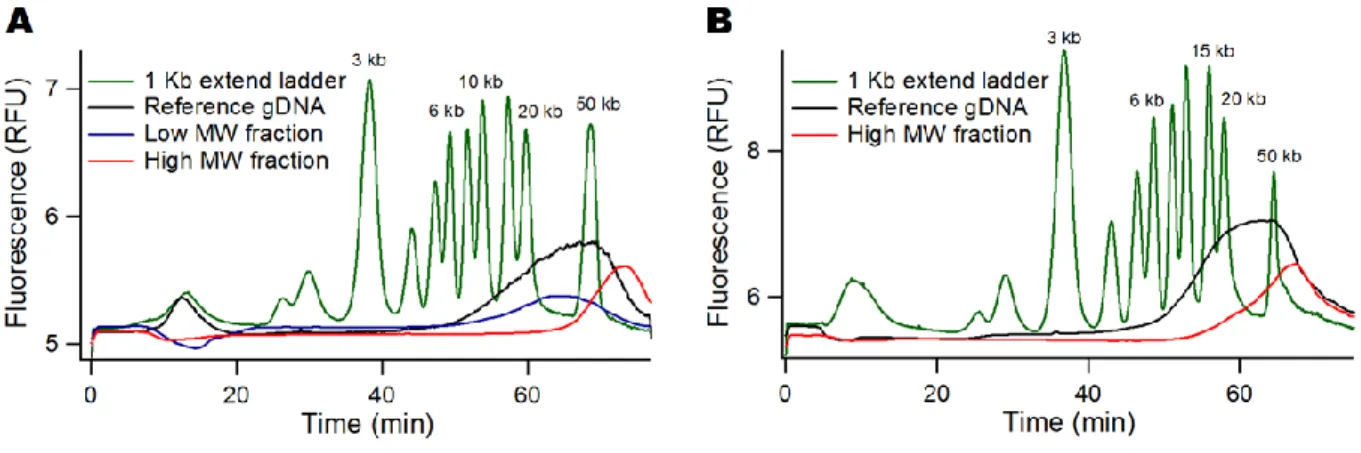
Figure 6: High MW size selection of genomic DNA. (A) The graph shows the DNA ladder in green, the unpurified melon genomic DNA sample in black, and the outputs of the size selection process on the multicapillary system in blue
and red. The threshold electric field is set to 2.9 kV/m for a threshold size of ~40 kbp. This calibration experiment is carried out with 2.5 ng of genomic DNA. (B) The chromatogram shows the same size selection process carried out four
times with 100 ng of DNA input in order to collect 15 ng of high MW DNA.
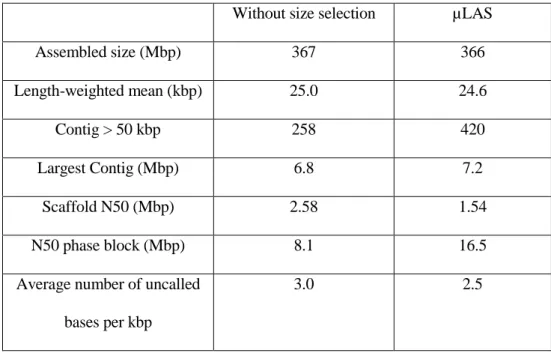
We sequenced processed vs. unprocessed genomic DNA samples, and obtained the same assembly size of ~366 Mbp, representing ~81% of the genome (Table 1). This size range was comparable to that obtained by pyrosequencing of 375 Mbp 32. The average length of the sequenced DNA fragments was also comparable in both samples (second line in Table 1), in apparent contradiction with the size selection process. Conversely, the number of contigs longer than 50 kbp was 63% greater after size selection by µLAS. These results can be explained if some high MW molecules are eliminated during the selection process, probably because they form
coverage of the genome, explaining that the scaffold N50 size was 68% longer without purification. Nevertheless, the narrowing of the size distribution after size selection (red curve in Fig. 6B) allows us to obtain a higher number of contigs of more than 50 kbp. Interestingly, during library preparation, the partitioning of the unprocessed sample with its broad size distribution creates discrepancies in the depth of coverage 33, likely resulting in low quality sequencing data for long molecules. Contrariwise, the narrow size distribution of DNA fragments obtained with µLAS insures homogeneous depth of sequencing and quality data for the identification of single nucleotide polymorphisms. This proposition explains the doubling of the N50 phase block size, which scores the accurate representation of the two chromosomes from sequencing data, after size selection as well as the better performances in terms of average number of uncalled bases (lower line in Table 2). Altogether, because the resolution of haplotypes is a key asset of Chromium technology, we conclude that the size selection of genomic DNA with µLAS is not indispensable for sequencing but enables us to obtain quality sequencing data.
Without size selection µLAS
Assembled size (Mbp) 367 366 Length-weighted mean (kbp) 25.0 24.6 Contig > 50 kbp 258 420 Largest Contig (Mbp) 6.8 7.2 Scaffold N50 (Mbp) 2.58 1.54 N50 phase block (Mbp) 8.1 16.5
Average number of uncalled bases per kbp
3.0 2.5
Table 1: Metrics of the sequencing data obtained by the Chromium technology.
Discussion
We describe a size-accordable filter for high MW DNA selection. On a monocapillary system, the sharp size selection threshold can be adjusted in the range of 3 to 40 kbp to perform sample fractionation with collection yields higher than 90%. We show that the filter saturates if more than ~0.2 ng of DNA is processed,
and demonstrate that saturation is associated to an aggregation mechanism. In order to produce genomic material for linked-read sequencing, we scale up the technology with a multicapillary system, and report the collection of high MW DNA from a Melon genomic DNA sample using a process of two hour. The resulting material is sequenced, and sequencing data appear to be improved for diploid genome resolution with size selection vs. without it.
Future lines of development concern the better processing of DNA molecules of more than ~100 kbp. Our data indeed indicate that these molecules tend to be eliminated during size selection. Consistently, this limitation has not been detected during the calibration steps, which have been performed with a DNA ladder with a larger band of 100 kbp. Hence, specific improvements should be performed to define operating conditions in the range of 50 to 300 kbp with a dedicated ladder. While we recently showed that DNA separation could be performed for fragments of up to 200 kbp 28, the saturation of our technology remains to be evaluated in this size range. In the low MW size limit, size selection would also be valuable for other applications, including enhanced analysis of circulating cell-free DNA in blood plasma 34. The adequate formulation of the viscoelastic buffer has already been reported for separation and concentration for low MW DNA 19, and promising results of purification have been obtained with a favorable saturation threshold of 5 ng in a monocapillary system (data not shown).
Regarding future applications, the potential of µLAS for purification of minute amounts of genomic material and its sensitivity of 10 fg/µL 28 may be particularly useful for single cell sequencing studies 16. In this context, the number of molecules is minimal and the collection yield critical. Because one human cell contains a few pg of DNA, saturation is not expected to be an issue. Hence, purification operations may be performed in the monocapillary system, which shows best performances. The preservation of long chromosome fragment integrity throughout the size selection process should carefully be evaluated, requiring the development of specific solutions for quality control of minute samples of very high MW. The resulting technologies for quality control and size selection may contribute to the better analysis of genomic heterogeneities and the interplay between allele variation and gene expression.
Acknowledgements.
We are thankful to Xavier Dollat for the manufacturing of the multicapillary system. This project was partly supported by the project “Gene Extractor” from Région Midi-Pyrénées and by the ANR µLAS (ANR-16-CE18-0028-01) and ANR BioPulse (ANR-16-ASTR-0020).References
1 M. J. Chaisson, J. Huddleston, M. Y. Dennis, P. H. Sudmant, M. Malig, F. Hormozdiari, F. Antonacci, U. Surti, R. Sandstrom and M. Boitano, Nature, 2015, 517, 608.
2 J. Huddleston, S. Ranade, M. Malig, F. Antonacci, M. Chaisson, L. Hon, P. H. Sudmant, T. A. Graves, C. Alkan and M. Y. Dennis, Genome research, 2014, 24, 688–696.
3 L. Gong, C.-H. Wong, W.-C. Cheng, H. Tjong, F. Menghi, C. Y. Ngan, E. T. Liu and C.-L. Wei, Nat
Methods, 2018, 15, 455–460.
4 M. C. Stancu, M. J. Van Roosmalen, I. Renkens, M. M. Nieboer, S. Middelkamp, J. De Ligt, G. Pregno, D. Giachino, G. Mandrile and J. E. Valle-Inclan, Nature communications, 2017, 8, 1326.
5 A. L. Norris, R. E. Workman, Y. Fan, J. R. Eshleman and W. Timp, Cancer biology & therapy, 2016, 17, 246–253.
6 E. L. van Dijk, Y. Jaszczyszyn, D. Naquin and C. Thermes, Trends in Genetics, 2018, 34, 666–681.
7 J. M. Feehan, K. E. Scheibel, S. Bourras, W. Underwood, B. Keller and S. C. Somerville, JoVE (Journal of
Visualized Experiments), 2017, e55463.
8 R. Boom, C. J. Sol, M. M. Salimans, C. L. Jansen, P. M. Wertheim-van Dillen and J. van der Noordaa, J.
Clin. Microbiol., 1990, 28, 495–503.
9 L. Becker, M. Steglich, S. Fuchs, G. Werner and U. Nübel, Scientific reports, 2016, 6, 28063.
10 B. Mayjonade, J. Gouzy, C. Donnadieu, N. Pouilly, W. Marande, C. Callot, N. Langlade and S. Muños,
BioTechniques, 2016, 61, 203–205.
11 M. A. Quail, Y. Gu, H. Swerdlow and M. Mayho, Electrophoresis, 2012, 33, 3521–3528. 12 E. L. Van Dijk, Y. Jaszczyszyn and C. Thermes, Experimental cell research, 2014, 322, 12–20.
13 A.-C. Portmann, C. Fournier, J. Gimonet, C. Ngom-Bru, C. Barretto and L. Baert, Frontiers in
microbiology, 2018, 9, 446.
14 J. Stadler, R. Lemmens and T. Nyhammar, J Gene Med, 2004, 6 Suppl 1, S54-66.
15 M. H. Tan, C. M. Austin, M. P. Hammer, Y. P. Lee, L. J. Croft and H. M. Gan, GigaScience, 2018, 7, gix137.
16 E. Shapiro, T. Biezuner and S. Linnarsson, Nature Reviews Genetics, 2013, 14, 618.
17 L. R. Huang, J. O. Tegenfeldt, J. J. Kraeft, J. C. Sturm, R. H. Austin and E. C. Cox, Nat Biotech, 2002, 20, 1048–1051.
18 B. H. Wunsch, S.-C. Kim, S. M. Gifford, Y. Astier, C. Wang, R. L. Bruce, J. V. Patel, E. A. Duch, S. Dawes and G. Stolovitzky, Lab on a Chip, 2019, 19, 1567–1578.
19 C.-L. Andriamanampisoa, A. Bancaud, A. Boutonnet-Rodat, A. Didelot, J. Fabre, F. Fina, F. Garlan, S. Garrigou, C. Gaudy and F. Ginot, Analytical chemistry, 2018, 90, 3766–3774.
20 N. Milon, C. Chantry-Darmon, C. Satge, M.-A. Fustier, S. Cauet, S. Moreau, C. Callot, A. Bellec, T. Gabrieli and L. Saïas, Nucleic acids research, 2019, 47, 8050–8060.
21 H. Ranchon, R. Malbec, V. Picot, A. Boutonnet, P. Terrapanich, P. Joseph, T. Leïchlé and A. Bancaud, Lab
Chip, 2016, 16, 1243–1253.
22 R. Malbec, B. Chami, L. Aeschbach, G. A. R. Buendía, M. Socol, P. Joseph, T. Leïchlé, E. Trofimenko, A. Bancaud and V. Dion, Scientific reports, 2019, 9, 23.
23 P. Marks, S. Garcia, A. M. Barrio, K. Belhocine, J. Bernate, R. Bharadwaj, K. Bjornson, C. Catalanotti, J. Delaney and A. Fehr, Genome research, 2019, 29, 635–645.
24 B. Chami, M. Socol, M. Manghi and A. Bancaud, Soft matter, 2018, 14, 5069–5079.
25 M. Socol, H. Ranchon, B. Chami, A. Lesage, J.-M. Victor, M. Manghi and A. Bancaud, Macromolecules, 2019, 52, 1843–1852.
26 M. Arca, A. J. Ladd and J. E. Butler, Soft matter, 2016, 12, 6975–6984.
28 N. Milon, C. Chantry-Darmon, C. Satge, M. A. Fustier, S. Cauet, S. Moreau, C. Callot, A. Bellec, T. Gabrieli, L. Saias, A. Boutonnet, F. Ginot, H. Bergès and A. Bancaud, Nucl Acids Res.
29 P. Russell, science, 2003, 299, 358–362.
30 J. E. Cleaver and H. W. Boyer, Biochimica et Biophysica Acta (BBA)-Nucleic Acids and Protein Synthesis, 1972, 262, 116–124.
31 L. Mitnik, C. Heller, J. Prost and J. L. Viovy, Science, 1995, 267, 219–222.
32 J. Garcia-Mas, A. Benjak, W. Sanseverino, M. Bourgeois, G. Mir, V. M. González, E. Hénaff, F. Câmara, L. Cozzuto and E. Lowy, Proceedings of the National Academy of Sciences, 2012, 109, 11872–11877.
33 N. I. Weisenfeld, V. Kumar, P. Shah, D. M. Church and D. B. Jaffe, Genome Res, 2017, 757–767.
34 F. Mouliere, D. Chandrananda, A. M. Piskorz, E. K. Moore, J. Morris, L. B. Ahlborn, R. Mair, T. Goranova, F. Marass and K. Heider, Science translational medicine, 2018, 10, eaat4921.