arXiv:1502.01518v2 [hep-ex] 15 Sep 2015
CERN-PH-EP-2014-299
Submitted to: Eur. Phys. J. C
Search for new phenomena in final states with an energetic
jet and large missing transverse momentum in
pp
collisions at
√
s
= 8
TeV with the ATLAS detector
The ATLAS Collaboration
Abstract
Results of a search for new phenomena in final states with an energetic jet and large missing
transverse momentum are reported. The search uses 20.3 fb
−1of
√
s = 8
TeV data collected in
2012 with the ATLAS detector at the LHC. Events are required to have at least one jet with
p
T>
120
GeV and no leptons. Nine signal regions are considered with increasing missing transverse
momentum requirements between
E
missT> 150
GeV and
E
miss
T
> 700
GeV. Good agreement
is observed between the number of events in data and Standard Model expectations. The
results are translated into exclusion limits on models with large extra spatial dimensions, pair
production of weakly interacting dark matter candidates, and production of very light gravitinos
in a gauge-mediated supersymmetric model. In addition, limits on the production of an invisibly
decaying Higgs-like boson leading to similar topologies in the final state are presented.
c
2015 CERN for the benefit of the ATLAS Collaboration.
Search for new phenomena in final states with an energetic jet and large
missing transverse momentum in pp collisions at
√
s
= 8 TeV with the
ATLAS detector
ATLAS Collaboration
1CERN, 1211 Geneva 23, Switzerland
E-mail: atlas.publications@cern.ch
Received: / Accepted:
Abstract Results of a search for new phenomena in final states with an energetic jet and large missing
transverse momentum are reported. The search uses 20.3 fb−1of √s= 8 TeV data collected in 2012 with the ATLAS detector at the LHC. Events are required to have at least one jet with pT > 120 GeV and no leptons. Nine signal regions are considered with increasing missing transverse momentum requirements between EmissT > 150 GeV and ETmiss > 700 GeV. Good agreement is observed between the number of events in data and Standard Model expectations. The results are translated into exclusion limits on models with either large extra spatial dimensions, pair production of weakly interacting dark matter candidates, or production of very light gravitinos in a gauge-mediated supersymmetric model. In addition, limits on the production of an invisibly decaying Higgs-like boson leading to similar topologies in the final state are presented.
1 Introduction
Events with an energetic jet and large missing transverse momentum in the final state constitute a clean and distinctive signature in searches for new physics beyond the Standard Model (SM) at colliders. Such signatures are referred to as monojet-like in this paper. In particular, monojet-like (as well as monophoton and mono-W/Z) final states have been studied [1–20] in the context of searches for supersymmetry (SUSY), large extra spatial dimensions (LED), and the search for weakly interacting massive particles (WIMPs) as candidates for dark matter (DM).
The Arkani-Hamed, Dimopoulos, and Dvali (ADD) model for LED [21] explains the large difference between the electroweak unification scale at O(102) GeV and the Planck scale M
Pl ∼ O(1019) GeV by postulating the presence ofnextra spatial dimensions of sizeR, and defining a fundamental Planck scale in 4 +ndimensions,MD, given byMPl2∼ MD2+nRn. An appropriate choice ofRfor a givennyields a value ofMDat the electroweak scale. The extra spatial dimensions are compactified, resulting in a Kaluza–Klein tower of massive graviton modes. If produced in high-energy collisions in association with an energetic jet, these graviton modes escape detection leading to a monojet-like signature in the final state.
A non-baryonic DM component in the universe is commonly used to explain a range of astrophysical measurements (see, for example, Ref. [22] for a review). Since none of the known SM particles are adequate DM candidates, the existence of a new particle is often hypothesized. Weakly interacting massive particles are one such class of particle candidates that can be searched for at the LHC [23]. They are expected to couple to SM particles through a generic weak interaction, which could be the weak interaction of the SM or a new type of interaction. Such a new particle would result in the correct relic density values for non-relativistic matter in the early universe [24], as measured by the PLANCK [25] and WMAP [26] satellites, if its mass is between a few GeV and a TeV and if it has electroweak-scale interaction cross sections. Many new particle physics models such as SUSY [27–35] also predict WIMPs.
Because WIMPs interact so weakly that they do not deposit energy in the calorimeter, their production leads to signatures with missing transverse momentum (pTmiss), the magnitude of which is called ETmiss. Here, WIMPs are assumed to be produced in pairs, and the events are identified via the presence of an energetic jet from initial-state radiation (ISR) [36–39] yielding largeEmissT .
The interaction of WIMPs with SM particles is described as a contact interaction using an effective field theory (EFT) approach, mediated by a single new heavy particle or particles with mass too large to
q
¯
q
χ
¯
χ
g
(a)q
¯
q
χ
¯
χ
g
Z
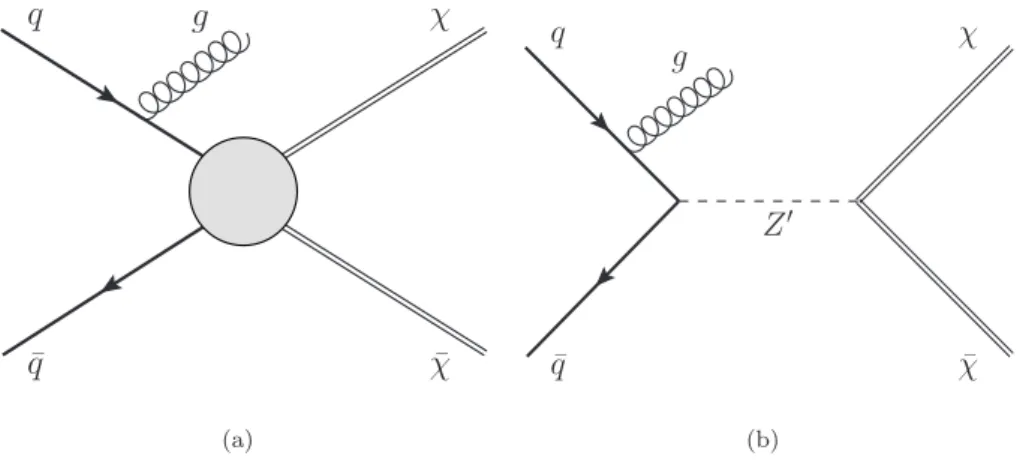
′ (b)Fig. 1 Feynman diagrams for the production of weakly interacting massive particle pairs χ ¯χ associated with a jet from initial-state radiation of a gluon, g. (a) A contact interaction described with effective operators. (b) A simplified model with a Z′ boson.
be produced directly at the LHC (see Fig. 1(a)). It is assumed here that the DM particle is either a Dirac
Table 1 Effective interactions coupling WIMPs to Standard Model quarks or gluons, following the formalism in Ref. [40], where M⋆is the suppression scale of the interaction. Operators starting with a D describe Dirac fermion WIMPs, the ones
starting with a C are for scalar WIMPs and Ga
µν is the colour field-strength tensor.
Name Initial state Type Operator
C1 qq scalar mq M2 ⋆ χ†χ¯qq C5 gg scalar 4M12 ⋆ χ†χαs(Ga µν)2 D1 qq scalar mq M3 ⋆ ¯ χχ¯qq D5 qq vector 1 M2 ⋆ ¯ χγµχ¯qγ µq D8 qq axial-vector 1 M2 ⋆ ¯ χγµγ5χ¯qγ µγ5q D9 qq tensor M12 ⋆ ¯ χσµνχ¯qσ µνq D11 gg scalar 4M13 ⋆ ¯ χχαs(Gaµν)2
fermion or a scalarχ; the only difference for Majorana fermions is that certain interactions are not allowed and that the cross sections for the allowed interactions are larger by a factor of four. Seven interactions are considered (see Table1), namely those described by the operators C1, C5, D1, D5, D8, D9, D11, following the naming scheme in Ref. [40]. These operators describe different bilinear quark couplings to WIMPs,
qq → χ¯ χ¯, except for C5 and D11, which describe the coupling to gluons, gg → χχ¯. The operators for
Dirac fermions and scalars in Ref. [40] fall into six categories with characteristicEmissT spectral shapes. The representative set of operators for these six categories are C1, C5, D1, D5, D9, and D11, while D8 falls into the same category as D5 but is listed explicitly in Table 1 because it is often used to convert LHC results into limits on DM pair production. In the operator definitions in Table1,M∗is the suppression scale of the interaction, after integrating out the heavy mediator particles. The use of a contact interaction to produce WIMP pairs via heavy mediators is considered conservative because it rarely overestimates cross sections when applied to a specific scenario for physics beyond the SM. Cases where this approach is indeed optimistic are studied in Refs. [39,41–45]. Despite the caveats related to the validity of the EFT approach (see Appendix A), this formalism is used here, as it provides a framework for comparing LHC results to existing direct or indirect DM searches. Within this framework, interactions of SM and DM particles are
described by only two parameters, the suppression scaleM⋆and the DM particle massmχ. Besides the EFT operators, the pair production of WIMPs is also investigated within a so-called simplified model, where a pair of WIMPs couples to a pair of quarks explicitly via a new mediator particle, a new vector boson Z′ (see Fig.1(b)).
In gauge-mediated SUSY-breaking (GMSB) scenarios [46–51], the gravitino ˜G (spin-3/2 superpartner of the graviton) is often the lightest supersymmetric particle and a potential candidate for DM. Its mass is related to the SUSY-breaking scale√F andMPlvia mG˜ ∝ F/MPl[52]. At hadron colliders, in low-scale SUSY-breaking scenarios with very light gravitinos, the cross section for associated production of gravitino– squark (pp → G˜q˜+X) and gravitino–gluino (pp → G˜˜g+X) processes are relatively large [53], since the cross section depends onmG˜ asσ ∼1/m2G˜. The decay of the gluino or squark into a gravitino and a gluon (˜g →Gg˜ ) or a gravitino and a quark (˜q →Gq˜ ), respectively, dominates [53]. The final state is characterized by the presence of a pair of gravitinos that escape detection and an energetic jet, leading to a monojet-like topology. Previous studies at colliders [15,54] considered the production of gravitinos in association with a photon or a jet and assumed extremely heavy squarks and gluinos. Within this approximation, a lower limit for the gravitino mass of mG˜>1.37×10
−5 eV was established.
The study of the properties of the Higgs boson discovered by the ATLAS and CMS experiments [55,56] does not exclude a sizeable branching ratio for its decay to invisible particles. It also opens up the question of whether a Higgs-like scalar field plays an important role in describing the interaction between dark and ordinary matter in the universe. In particular, a sizeable branching ratio to invisible particles could be interpreted in terms of the production of DM. Results from LEP [57] excluded an invisibly decaying Higgs boson, produced in association with a Z boson, for a boson mass (mH) below 114.4 GeV. The strongest direct bounds from the LHC experiments on the branching ratio for the Higgs invisible decay mode [58,59] set upper limits of 58%–65% at 95% confidence level (CL), based on the final state in which the Higgs boson is produced either in association with aZboson or via vector-boson fusion processes. In this analysis, the monojet-like final state is used to search for the production of an invisibly decaying boson with SM Higgs-like properties and a mass in the range between 115 GeV and 300 GeV.
The paper is organized as follows. The ATLAS detector is described in the next section. Section3provides details of the simulations used in the analysis for background and signal processes. Section4discusses the reconstruction of jets, leptons and EmissT , while Sect. 5 describes the event selection. The estimation of background contributions and the study of systematic uncertainties are discussed in Sects. 6 and7. The results are presented in Sect. 8, and are interpreted in terms of the search for ADD LED, WIMP pair production, the production of very light gravitinos in GMSB scenarios, and the production of an invisibly decaying Higgs-like boson. Finally, Sect.9is devoted to the conclusions.
2 Experimental setup
The ATLAS detector [60] covers almost the whole solid angle1 around the collision point with layers of tracking detectors, calorimeters and muon chambers. The ATLAS inner detector (ID) has full coverage in
φ and covers the pseudorapidity range|η| <2.5. It consists of a silicon pixel detector, a silicon microstrip detector, and a straw tube tracker which also measures transition radiation for particle identification, all immersed in a 2 T axial magnetic field produced by a solenoid.
High-granularity liquid-argon (LAr) electromagnetic sampling calorimeters, with excellent energy and position resolution, cover the pseudorapidity range|η| <3.2. The hadronic calorimetry in the range|η| <1.7 is provided by a scintillator-tile calorimeter, consisting of a large barrel and two smaller extended barrel cylinders, one on either side of the central barrel. In the endcaps (|η| > 1.5), LAr hadronic calorimeters match the outer|η|limits of the endcap electromagnetic calorimeters. The LAr forward calorimeters provide both the electromagnetic and hadronic energy measurements, and extend the coverage to|η| <4.9.
The muon spectrometer measures the deflection of muons in the magnetic field provided by large su-perconducting air-core toroid magnets in the pseudorapidity range |η| < 2.7, instrumented with separate trigger and high-precision tracking chambers. Over most of theη range, a measurement of the track coor-dinates in the principal bending direction of the magnetic field is provided by monitored drift tubes. At 1ATLAS uses a right-handed coordinate system with its origin at the nominal interaction point (IP) in the centre of the
detector and the z-axis along the beam pipe. The x-axis points from the IP to the centre of the LHC ring, and the y-axis points upward. The azimuthal angle φ is measured around the beam axis, and the polar angle θ is measured with respect to the z-axis. We define transverse energy as ET= E sinθ, transverse momentum as pT= p sinθ, and pseudorapidity as
large pseudorapidities, cathode strip chambers with higher granularity are used in the innermost plane over
2.0< |η| <2.7. The muon trigger system covers the pseudorapidity range|η| <2.4.
The data are collected using an online three-level trigger system [61] that selects events of interest and reduces the event rate from several MHz to about 400 Hz for recording and offline processing.
3 Monte Carlo simulation
Monte Carlo (MC) simulated event samples are used to compute detector acceptance and reconstruction efficiencies, determine signal and background contributions, and estimate systematic uncertainties on the final results.
3.1 Background simulation
The expected background to the monojet-like signature is dominated byZ(→ νν¯)+jets andW+jets produc-tion (withW(→ τ ν)+jets being the dominant among theW+jets backgrounds), and includes small contri-butions from Z/γ∗
(→ ℓ+ℓ−
)+jets (ℓ=e, µ, τ), multijet,t¯t, single-top, and diboson (W W, W Z, ZZ,W γ,Zγ) processes.
Samples of simulatedW+jets and Z+jets production events are generated using SHERPA-1.4.1 [62], including leading-order (LO) matrix elements for up to five partons in the final state and assuming mas-siveb/c-quarks, with CT10 [63] parton distribution functions (PDF) of the proton. The MC expectations are initially normalized to next-to-next-to-leading-order (NNLO) perturbative QCD (pQCD) predictions according to DYNNLO [64,65] using MSTW2008 90% CL NNLO PDF sets [66]. The production of top-quark pairs (t¯t) is simulated using the MC@NLO-4.06 [67,68] MC generator with parton showers and underlying-event modelling as implemented in HERWIG-6.5.20 [69,70] plus JIMMY [71]. Single-top pro-duction samples are generated with MC@NLO [72] for thes- andW t-channel [73], while AcerMC-v3.8 [74] is used for single-top production in the t-channel. A top-quark mass of 172.5 GeV is used consistently. The AUET2C and AUET2B [75] set of optimised parameters for the underlying event description are used for t¯t and single-top processes, which use CT10 and CTEQ6L1 [76] PDF, respectively. Approximate NNLO+NNLL (next-to-next-to-leading-logarithm) pQCD cross sections, as determined in TOP++2.0 [77], are used in the normalization of thet¯t [78] andW t[79] samples. Multijet andγ+jet samples are generated using the PYTHIA-8.165 program [80] with CT10 PDF. Finally, diboson samples (W W, W Z, ZZ, W γ
and Zγ production) are generated using SHERPA with CT10 PDF and are normalized to NLO pQCD predictions [81].
3.2 Signal simulation
Simulated samples for the ADD LED model with different number of extra dimensions in the rangen=2– 6 and MD in the range 2–5 TeV are generated using PYTHIA-8.165 with CT10 PDF. Renormalization and factorization scales are set to q1/2× m2
G+p2T, wheremG is the graviton mass and pT denotes the transverse momentum of the recoiling parton.
The effective field theory of WIMP pair production is implemented in MADGRAPH5-v1.5.2 [82], taken from Ref. [40]. The WIMP pair production plus one or two additional partons from ISR is simulated in two ways. For all operators, samples are generated requiring at least one parton with a minimum pT of 80 GeV. Studies simulating up to three additional partons along with the WIMP pair showed no difference in kinematic distributions when compared to the samples with up to two additional partons.
Only initial states of gluons and the four lightest quarks are considered, assuming equal coupling strengths for all quark flavours to the WIMPs. The mass of the charm quark is most relevant for the cross sections of the operator D1 (see Table1) and it is set to 1.42 GeV. The generated events are interfaced to PYTHIA-6.426 [83] for parton showering and hadronization. The MLM prescription [84] is used for matching the matrix-element calculations of MADGRAPH5 to the parton shower evolution of PYTHIA-6. The samples are subsequently reweighted to the MSTW2008LO [66] PDF set using LHAPDF [85]. The MADGRAPH5 default choice for the renormalization and factorization scales is used. The scales are set to the geometric average of m2+p2T for the two WIMPs, where mis the mass of the particles. Events with WIMP masses between 10 GeV and 1300 GeV are simulated for six different effective operators (C1, C5,
D1, D5, D9, D11). The WIMPs are taken to be either Dirac fermions (Doperators) or scalars (C operators), and the pair-production cross section is calculated at LO. To study the transition between the effective field theory and a physical renormalizable model for Dirac fermion WIMPs coupling to Standard Model particles via a new mediator particle Z′
, a simplified model is generated in MADGRAPH5. For each WIMP mass point, mediator particle masses Mmed between 50 GeV and 30 TeV are considered, each for two values of the mediator particle width (Γ =Mmed/3 andMmed/8π).
Simulated samples for gravitino production in association with a gluino or a squark in the final state,
pp →G˜g˜+X andpp →G˜q˜+X, are generated using LO matrix elements in MADGRAPH4.4 [86] interfaced with PYTHIA-6.426 and using CTEQ6L1 PDF. The narrow-width approximation for the gluino and squark decays ˜g → gG˜ and ˜q → qG˜ is assumed. The renormalization and factorization scales are set to the average of the mass of the final-state particles involved in the hard interaction (mG˜+mq/˜˜g)/2≃ mq/˜˜g/2. Values for
mG˜ in the range between 10−3 eV and 10−5eV are considered for squark and gluino masses in the range 50 GeV to 2.6 TeV.
Finally, MC simulated samples for the production of a Higgs boson are generated including thegg → H,
V V → H (V =W, Z), andV H production channels. Masses for the boson in the range between 115 GeV
and 300 GeV are considered. This Higgs boson is assumed to be produced as predicted in the Standard Model but unlike the SM Higgs it may decay into invisible particles at a significant rate. The signal is modelled using POWHEG-r2262 [87–89], which calculates separately thegg → H andV V → H production mechanisms with NLO pQCD matrix elements. The description of the Higgs boson pT spectrum in the
gg → H process follows the calculation in Ref. [90], which includes NLO + NNLL corrections. The effects
of finite quark masses are also taken into account [91]. For gg → H andV V → H processes, POWHEG is interfaced to PYTHIA-8.165 for showering and hadronization. For ZH and W H processes, POWHEG interfaced to HERWIG++ [92] is used and the Z/W bosons are forced to decay to a pair of quarks. The invisible decay of the Higgs-like boson is simulated by forcing the boson to decay to twoZ bosons, which are then forced to decay to neutrinos. Signal samples are generated with renormalization and factorization scales set to q(mH)2+ (pHT)2. The Higgs boson production cross sections, as well as their uncertainties, are taken from Refs. [93,94]. For thegg → H process, cross-section calculations at NNLO+NNLL accuracy [95–98] in pQCD are used and NLO electroweak corrections [99,100] are included. The cross sections for
V V → H processes are calculated with full NLO pQCD and electroweak corrections [101–103]. The cross
sections for the associated production (W HandZH) are calculated at NNLO [104] in pQCD, and include NLO electroweak corrections [105].
Differing pileup (multiple proton–proton interactions in the same or neighbouring bunch-crossings) conditions as a function of the instantaneous luminosity are taken into account by overlaying simulated minimum-bias events generated with PYTHIA-8 onto the hard-scattering process. The MC-generated sam-ples are processed either with a full ATLAS detector simulation [106] based on the GEANT4 program [107] or a fast simulation of the response of the electromagnetic and hadronic calorimeters [108] and of the trigger system. The results based on fast simulation are validated against fully simulated samples and the difference is found to be negligible. The simulated events are reconstructed and analysed with the same analysis chain as for the data, using the same trigger and event selection criteria.
4 Reconstruction of physics objects
Jets are defined using the anti-ktjet algorithm [109] with the radius parameterR= 0.4. Energy depositions reconstructed as clusters in the calorimeter are the inputs to the jet algorithm. The measured jet pT is corrected for detector effects, including the non-compensating character of the calorimeter, by weighting energy deposits arising from electromagnetic and hadronic showers differently. In addition, jets are corrected for contributions from pileup, as described in Ref. [110]. Jets with correctedpT > 30 GeV and|η| < 4.5 are considered in the analysis. Jets with|η| <2.5 containing ab-hadron are identified using a neural-net-based algorithm [111] with an efficiency of 80% and a rejection factor of 30 (3) against jets originating from fragmentation of light quarks or gluons (jets containing ac-hadron), as determined usingt¯tsimulated events.
The presence of leptons (muons or electrons) in the final state is used in the analysis to define control samples and to reject background contributions in the signal regions (see Sects.5and6). Muon candidates are formed by combining information from the muon spectrometer and inner tracking detectors as described in Ref. [112] and are required to have pT >7 GeV and |η| < 2.5. In addition, muons are required to be isolated: the sum of the transverse momenta of the tracks not associated with the muon in a cone of size
∆R =p
(∆η)2+ (∆φ)2 = 0.2 around the muon direction is required to be less than 1.8 GeV. The muon
pT requirement is increased topT>20 GeV to define theW(→ µν)+jets andZ/γ∗(→ µ+µ−)+jets control regions.
Electron candidates are initially required to havepT>7 GeV and |η| <2.47, and to pass the medium electron shower shape and track selection criteria described in Ref. [113], which are reoptimized for 2012 data. Overlaps between identified electrons and jets in the final state are resolved. Jets are discarded if their separation∆R from an identified electron is less than 0.2. The electronpT requirement is increased to pT > 20 GeV and the transition region between calorimeter sections 1.37 < |η| <1.52 is excluded to reconstruct Z and W boson candidates in the Z/γ∗
(→ e+e−
)+jets and W(→ eν)+jets control regions, respectively. The electron requirements are further tightened for the W(→ eν)+jets control sample to constrain the irreducible Z(→ ν¯ν)+jets background contribution (see below). In this case, electrons are selected to pass tight [113] electron shower shape and track selection criteria, theirpT threshold is raised to 25 GeV, and they are required to be isolated: the sum of the transverse momenta of the tracks not associated with the electron in a cone of radius ∆R= 0.3 around the electron direction is required to be less than 5% of the electron pT. An identical isolation criterion, based on the calorimeter energy deposits not associated with the electron, is also applied.
TheEmiss
T is reconstructed using all energy deposits in the calorimeter up to pseudorapidity |η|= 4.9. Clusters associated with either electrons or photons withpT>10 GeV and those associated with jets with
pT > 20 GeV make use of the corresponding calibrations for these objects. Softer jets and clusters not associated with these objects are calibrated using both calorimeter and tracking information [114].
5 Event selection
The data sample considered in this paper corresponds to a total integrated luminosity of 20.3 fb−1. The uncertainty on the integrated luminosity is 2.8%, as estimated following the same methodology as detailed in Ref. [115]. The data were selected online using a trigger logic that selects events withETmissabove 80 GeV, as computed at the final stage of the three-level trigger system [61]. With respect to the final analysis requirements, the trigger selection is fully efficient forETmiss>150 GeV, as determined using a data sample with muons in the final state. Table2summarizes the different event selection criteria applied in the signal regions. The following preselection criteria are applied.
– Events are required to have a reconstructed primary vertex for the interaction consistent with the beamspot envelope and to have at least two associated tracks withpT>0.4 GeV; when more than one such vertex is found, the vertex with the largest summedp2Tof the associated tracks is chosen.
– Events are required to haveEmissT >150 GeV and at least one jet withpT>30 GeV and|η| <4.5 in the final state.
– The analysis selects events with a leading jet withpT>120 GeV and|η| <2.0. Monojet-like topologies in the final state are selected by requiring the leading-jetpT and theEmissT to satisfypT/ETmiss>0.5. An additional requirement on the azimuthal separation∆φ(jet, pTmiss)> 1.0 between the direction of the missing transverse momentum and that of each of the selected jets is imposed. This requirement reduces the multijet background contribution where the largeETmiss originates mainly from jet energy mismeasurement.
– Events are rejected if they contain any jet with pT> 20 GeV and|η| < 4.5 that presents an electro-magnetic fraction in the calorimeter, calorimeter sampling fraction, or charged fraction2 (for jets with
|η| <2.5) inconsistent with the requirement that they originate from a proton–proton collision [116]. In
the case of the leading (highestpT) jet in the event, the requirements are tightened to reject remaining contributions from beam-related backgrounds and cosmic rays. Events are also rejected if any of the jets is reconstructed close to known partially instrumented regions of the calorimeter. Additional require-ments based on the timing and the pulse shape of the cells in the calorimeter are applied to suppress coherent noise and electronic noise bursts in the calorimeter producing anomalous energy deposits [117]; these requirements have a negligible effect on the signal efficiency.
– Events with muons or electrons withpT >7 GeV are vetoed. In addition, events with isolated tracks withpT>10 GeV and |η| <2.5 are vetoed to reduce background from non-identified leptons (e, µ or 2The charged fraction is defined as f
ch=P ptrack,jetT /p jet
T, whereP p track,jet
T is the scalar sum of the transverse momenta
of tracks associated with the primary vertex within a cone of radius R = 0.4 around the jet axis, and pjetT is the transverse momentum as determined from calorimetric measurements.
τ) in the final state. The track isolation is defined such that there must be no additional track with
pT>3 GeV within a cone of radius 0.4 around it.
Different signal regions (SR1–SR9) are considered with increasing EmissT thresholds from 150 GeV to 700 GeV.
Table 2 Event selection criteria applied for the selection of monojet-like signal regions, SR1–SR9. Selection criteria
Preselection Primary vertex
Emiss
T > 150 GeV
Jet quality requirements
At least one jet with pT> 30 GeV and |η| < 4.5
Lepton and isolated track vetoes
Monojet-like selection The leading jet with pT> 120 GeV and |η| < 2.0
Leading jet pT/EmissT > 0.5
∆φ(jet, pmiss T ) > 1.0 Signal region SR1 SR2 SR3 SR4 SR5 SR6 SR7 SR8 SR9 Minimum Emiss T [GeV] 150 200 250 300 350 400 500 600 700 6 Background estimation
TheW+jets andZ(→ ν¯ν)+jets backgrounds are estimated using MC event samples normalized using data in selected control regions. In particular, the dominantZ(→ νν¯)+jets background contribution is constrained using a combination of estimates fromW+jets andZ+jets control regions. The remaining SM backgrounds fromZ/γ∗
(→ ℓ+ℓ−
)+jets,t¯t, single top, and dibosons are determined using MC simulated samples, while the multijet background contribution is extracted from data. In the case of the t¯t background process, which contributes to both the signal andW+jets control regions, dedicated control samples are defined to validate the MC normalization and to estimate systematic uncertainties. Finally, the potential contributions from beam-related background and cosmic rays are estimated in data using jet timing information. The methodology and the samples used for estimating the background are summarised in Table3. The details are given in the following sections.
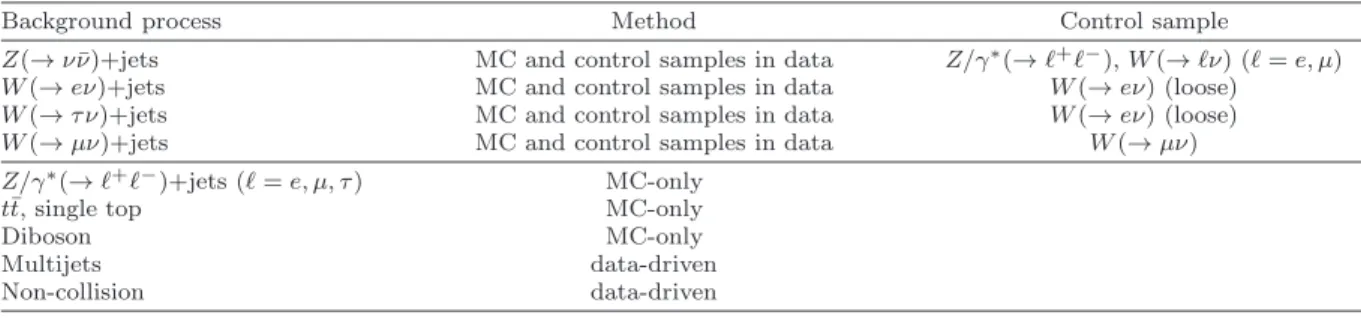
Table 3 Summary of the methods and control samples used to constrain the different background contributions in the signal regions.
Background process Method Control sample
Z(→ ν ¯ν)+jets MC and control samples in data Z/γ∗(→ ℓ+ℓ−), W (→ ℓν) (ℓ = e, µ)
W (→ eν)+jets MC and control samples in data W (→ eν) (loose) W (→ τ ν)+jets MC and control samples in data W (→ eν) (loose) W (→ µν)+jets MC and control samples in data W (→ µν) Z/γ∗(→ ℓ+ℓ−)+jets (ℓ = e, µ, τ ) MC-only
t¯t, single top MC-only
Diboson MC-only
Multijets data-driven
6.1W/Z+jets background
In the analysis, control samples in data, with identified electrons or muons in the final state and with identical requirements on the jet pT and ETmiss, are used to determine the W(→ ℓν)+jets (ℓ = e, µ, τ) and Z(→ νν¯)+jets electroweak background contributions. This reduces significantly the relatively large theoretical and experimental systematic uncertainties, of the order of 20%–40%, associated with purely MC-based expectations. TheETmiss-based online trigger used in the analysis does not include muon information in the EmissT calculation. This allows the collection of W(→ µν)+jets and Z/γ∗
(→ µ+µ−
)+jets control samples with the same trigger as for the signal regions. This is not the case for the W(→ eν)+jets and
Z/γ∗
(→ e+e−
)+jets control samples used to constrain theZ(→ ν¯ν)+jets background (see below).
AW(→ µν)+jets control sample is defined using events with a muon withpT>20 GeV andWtransverse mass in the range 40 GeV < mT <100 GeV. The transverse mass mT is defined by the lepton (ℓ) and neutrino (ν) pT and direction as mT =
q
2pℓTpνT(1−cos(φℓ− φν)), where the (x, y) components of the neutrino momentum are taken to be the same as the correspondingpTmisscomponents. Similarly, aZ/γ∗
(→
µ+µ−
)+jets control sample is selected, requiring the presence of two muons withpT>20 GeV and invariant mass in the range 66 GeV < mµµ < 116 GeV. In the W(→ µν)+jets and Z/γ∗(→ µ+µ−)+jets control regions, the ETmiss is not corrected for the presence of the muons in the final state, which are considered invisible, motivated by the fact that these control regions are used to estimate the irreducibleZ(→ ν¯ν)+jets background in the signal regions.
TheW(→ eν)+jets andZ/γ∗
(→ e+e−
)+jets control samples used to constrain theZ(→ ν¯ν)+jets back-ground in the signal regions are collected using online triggers that select events with an electron in the final state. The ETmiss is corrected by removing the contributions from the electron energy clusters in the calorimeters. In theZ/γ∗
(→ e+e−
)+jets control sample, events are selected with exactly two electrons with
pT>20 GeV and dilepton invariant mass in the range 66 GeV< mee<116 GeV. In theW(→ eν)+jets con-trol sample a tight selection is applied: events are selected to have only a single electron withpT>25 GeV, transverse mass in the range 40 GeV < mT < 100 GeV, and uncorrected ETmiss > 25 GeV. The latter requirements suppress background contamination from multijet processes where jets are misidentified as electrons.
A separateW(→ eν)+jets control sample, collected with theETmiss-based trigger and looser requirements that increase the number of events, is defined to constrain theW(→ eν)+jets andW(→ τ ν)+jets background contributions. In this case, the electronpT requirement is reduced topT>20 GeV and no further cuts on electron isolation andmTare applied. In addition, theETmisscalculation in this case is not corrected for the presence of the electron or τ leptons in the final state, as they contribute to the calorimeter-basedETmiss
calculation in the signal regions.
Figures2–5show, for the SR1 monojet-like kinematic selection, some distributions in data in the different
W+jets andZ+jets control regions compared to MC expectations. In this case, the MC expectations are globally normalized to the data in the control regions, using normalization factors as explained below, so that a comparison of the shape of the different distributions in data and MC simulation can be made. The MC expectations provide a fair description of the shapes in data but present harderEmissT and leading-jetpT spectra. This is mainly attributed to an inadequate modelling of the bosonpTdistribution in theW/Z+jets MC samples.
The data in the control regions and MC–based correction factors, determined from the SHERPA simu-lation, are used for each of the signal selections (SR1–SR9) to estimate the electroweak background contri-butions from W+jets andZ(→ ν¯ν)+jets processes. As an example, the W(→ µν)+jets andZ(→ ν¯ν)+jets background contributions to a given signal region, NW(→µν)
signal andN
Z(→νν)¯
signal , respectively, are determined using theW(→ µν)+jets control sample in data according to
NW(→µν) signal = (NW(data→µν),control− N non−W/Z W(→µν),control) NMC W(→µν),control × NMC(W(→µν)) signal × ξℓ× ξtrg× ξvetoℓ (1) and NsignalZ(→ν¯ν)= (N data W(→µν),control− Nnon −W/Z W(→µν),control) NMC W(→µν),control × NsignalMC(Z(→ν¯ν))× ξℓ× ξtrg, (2) where NsignalMC(W(→µν)) andNsignalMC(Z(→ν¯ν)) denote, respectively, the W(→ µν)+jets andZ(→ ν¯ν)+jets back-ground predicted by the MC simulation in the signal region, and NWdata(→µν),control, NWMC(→µν),control, and
Events / GeV -3 10 -2 10 -1 10 1 10 2 10 3 10 4 10 Data 2012 SM uncertainty )+jets ν l → W( + single top t t Di-boson ll)+jets → Z( ATLAS -1 =8 TeV, 20.3 fb s >150 GeV miss T ) CR, E ν µ → W(
) transverse mass [GeV]
ν , µ ( 0 100 200 300 400 500 600 700 800 900 1000 Data/SM 0.5 1 1.5 (a) Events / GeV -3 10 -2 10 -1 10 1 10 2 10 3 10 4 10 Data 2012 SM uncertainty )+jets ν l → W( + single top t t Di-boson ll)+jets → Z( ATLAS -1 =8 TeV, 20.3 fb s >150 GeV miss T ) CR, E ν µ → W( [GeV] miss T E 200 400 600 800 1000 1200 Data/SM 0.5 1 1.5 (b) Events / GeV -3 10 -2 10 -1 10 1 10 2 10 3 10 Data 2012 SM uncertainty )+jets ν l → W( + single top t t Di-boson ll)+jets → Z( ATLAS -1 =8 TeV, 20.3 fb s >150 GeV miss T ) CR, E ν µ → W( [GeV] T Leading jet p 200 400 600 800 1000 1200 Data/SM 0.5 1 1.5 (c) Events -1 10 1 10 2 10 3 10 4 10 5 10 6 10 Data 2012 SM uncertainty )+jets ν l → W( + single top t t Di-boson ll)+jets → Z( ATLAS -1 =8 TeV, 20.3 fb s >150 GeV miss T ) CR, E ν µ → W( Jet multiplicity 1 2 3 4 5 6 7 8 9 10 11 Data/SM 0.5 1 1.5 (d)
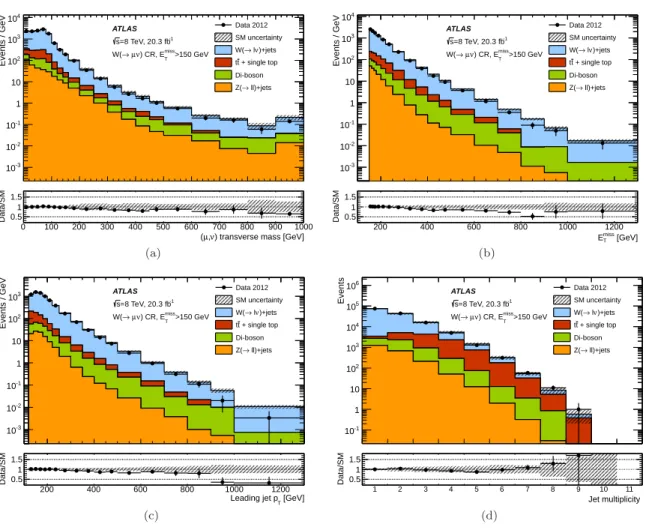
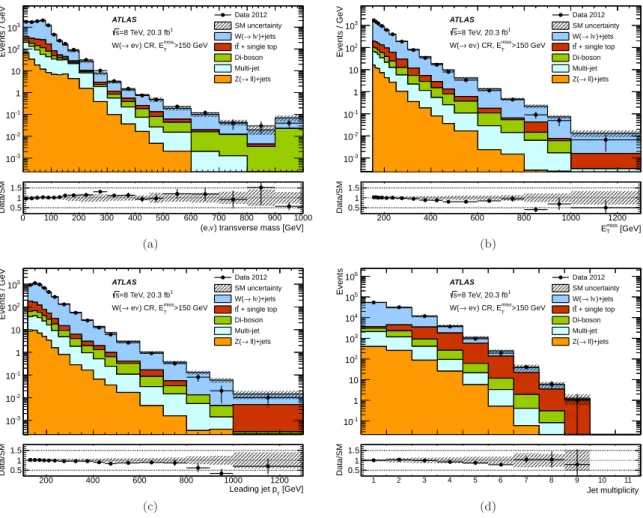
Fig. 2 Distributions of the measured (a) transverse mass of the identified muon and the missing transverse momentum, (b) Emiss
T , (c) leading jet pTand (d) jet multiplicity distributions in the W (→ µν)+jets control region for the inclusive SR1
selection, compared to the background expectations. The latter include the global normalization factors extracted from the data. Where appropriate, the last bin of the distribution includes overflows. The lower panels represent the ratio of data to MC expectations. The error bands in the ratios include the statistical and experimental uncertainties on the background expectations.
NWnon(→−µν),controlW/Z denote, in the control region, the number ofW(→ µν)+jets candidates in data andW/Z+jets
MC simulation, and the non-W/Z background contribution, respectively. TheNWnon(→−µν),controlW/Z term refers mainly to top-quark and diboson processes, but also includes contributions from multijet processes de-termined using data. Finally, ξℓ, ξvetoℓ , and ξtrg account for possible data–MC differences in the lepton identification, lepton vetoes, and trigger efficiencies, respectively; they typically depart from unity by less than 1%. The MC-to-data normalization factors (the (NWdata(→µν),control− Nnon
−W/Z
W(→µν),control)/N
MC
W(→µν),control
term in Eq. (1)) for each process vary between about 0.9 and 0.6 as the required minimumETmissincreases from 150 GeV to 700 GeV, and account for the tendency of the MC expectations forW/Z+jets processes to exceed the data in the control regions (see, for example, Fig.2). Similarly, bin-by-bin correction factors are used to correct the shape of the different distributions in the signal regions.
As already mentioned, the different background contributions in the signal regions fromW(→ ℓν)+jets processes (withℓ=e, µ) are constrained using correction factors obtained from the corresponding control regions. In the case of theW(→ τ ν)+jets contributions, the correction factors from theW(→ eν)+jets con-trol regions are used. For each of the signal regions, four separate sets of correction factors are considered to constrain the dominantZ(→ ν¯ν)+jets background contribution, following Eq. (2), as determined separately usingZ/γ∗
(→ ℓ+ℓ−
)+jets andW(→ ℓν)+jets control samples. The four resultingZ(→ ν¯ν)+jets background estimations in each signal region are found to be consistent within uncertainties and are statistically
com-Events / GeV -3 10 -2 10 -1 10 1 10 2 10 3 10 Data 2012 SM uncertainty ll)+jets → Z( Di-boson + single top t t )+jets ν l → W( ATLAS -1 =8 TeV, 20.3 fb s >150 GeV miss T ) CR, E µ µ → Z(
Di-muon invariant mass [GeV] 100 200 300 400 500 600 700 800 900 1000 Data/SM 0.5 1 1.5 (a) Events / GeV -3 10 -2 10 -1 10 1 10 2 10 3 10 Data 2012 SM uncertainty ll)+jets → Z( Di-boson + single top t t )+jets ν l → W( ATLAS -1 =8 TeV, 20.3 fb s >150 GeV miss T ) CR, E µ µ → Z( [GeV] miss T E 200 400 600 800 1000 1200 Data/SM 0.5 1 1.5 (b) Events / GeV -3 10 -2 10 -1 10 1 10 2 10 Data 2012 SM uncertainty ll)+jets → Z( Di-boson + single top t t )+jets ν l → W( ATLAS -1 =8 TeV, 20.3 fb s >150 GeV miss T ) CR, E µ µ → Z( [GeV] T Leading jet p 200 400 600 800 1000 1200 Data/SM 0.5 1 1.5 (c) Events -1 10 1 10 2 10 3 10 4 10 5 10 Data 2012 SM uncertainty ll)+jets → Z( Di-boson + single top t t )+jets ν l → W( ATLAS -1 =8 TeV, 20.3 fb s >150 GeV miss T ) CR, E µ µ → Z( Jet multiplicity 1 2 3 4 5 6 7 8 9 10 11 Data/SM 0.5 1 1.5 (d)
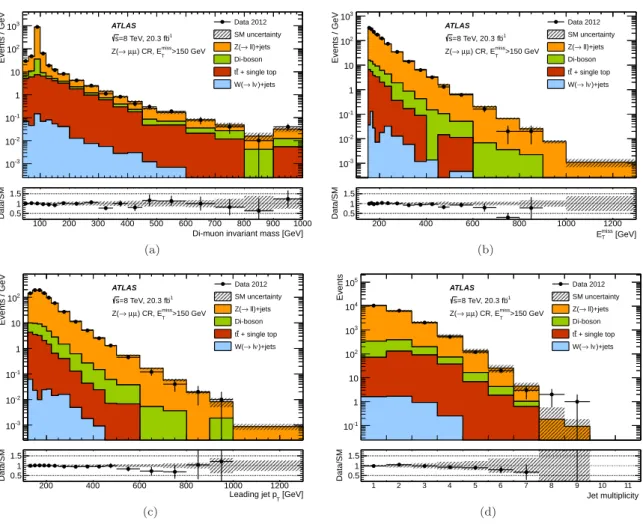
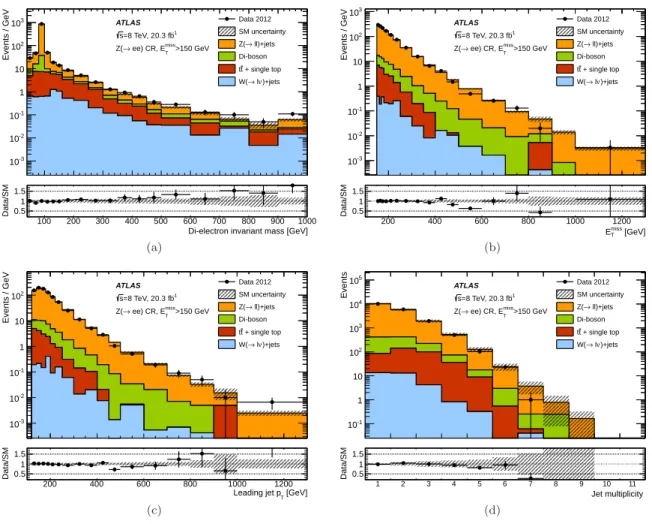
Fig. 3 Distributions of the measured (a) dilepton invariant mass, (b) Emiss
T , (c) leading jet pTand (d) jet multiplicity
distributions in the Z/γ∗(→ µ+µ−)+jets control region for the inclusive SR1 selection, compared to the background
expectations. The latter include the global normalization factors extracted from the data. Where appropriate, the last bin of the distribution includes overflows. The lower panels represent the ratio of data to MC expectations. The error bands in the ratios include the statistical and experimental uncertainties on the background expectations.
bined using the BLUE (Best Linear Unbiased Estimate) [118] method, which takes into account correlations of systematic uncertainties.
6.2 Multijet background
The multijet background with largeETmiss mainly originates from the misreconstruction of the energy of a jet in the calorimeter and to a lesser extent from the presence of neutrinos in the final state due to heavy-flavour decays. The multijet background is determined from data, using ajet smearingmethod as described in Ref. [119], which relies on the assumption that theETmissof multijet events is dominated by fluctuations in the detector response to jets measured in the data. For the SR1 and SR2 selections, the multijet background constitutes about 2% and 0.7% of the total background, respectively, and is below 0.5% for the rest of the signal regions with higherETmiss thresholds.
6.3 Non-collision background
Detector noise, beam-halo and cosmic muons leading to large energy deposits in the calorimeters represent a significant portion of data acquired byEmissT triggers. These non-collision backgrounds resemble the topology of monojet-like final states and require a dedicated strategy to suppress them. The selection described in
Events / GeV -3 10 -2 10 -1 10 1 10 2 10 3 10 Data 2012 SM uncertainty )+jets ν l → W( + single top t t Di-boson Multi-jet ll)+jets → Z( ATLAS -1 =8 TeV, 20.3 fb s >150 GeV miss T ) CR, E ν e → W(
) transverse mass [GeV]
ν (e, 0 100 200 300 400 500 600 700 800 900 1000 Data/SM 0.5 1 1.5 (a) Events / GeV -3 10 -2 10 -1 10 1 10 2 10 3 10 Data 2012 SM uncertainty )+jets ν l → W( + single top t t Di-boson Multi-jet ll)+jets → Z( ATLAS -1 =8 TeV, 20.3 fb s >150 GeV miss T ) CR, E ν e → W( [GeV] miss T E 200 400 600 800 1000 1200 Data/SM 0.5 1 1.5 (b) Events / GeV -3 10 -2 10 -1 10 1 10 2 10 3 10 Data 2012 SM uncertainty )+jets ν l → W( + single top t t Di-boson Multi-jet ll)+jets → Z( ATLAS -1 =8 TeV, 20.3 fb s >150 GeV miss T ) CR, E ν e → W( [GeV] T Leading jet p 200 400 600 800 1000 1200 Data/SM 0.5 1 1.5 (c) Events -1 10 1 10 2 10 3 10 4 10 5 10 6 10 Data 2012 SM uncertainty )+jets ν l → W( + single top t t Di-boson Multi-jet ll)+jets → Z( ATLAS -1 =8 TeV, 20.3 fb s >150 GeV miss T ) CR, E ν e → W( Jet multiplicity 1 2 3 4 5 6 7 8 9 10 11 Data/SM 0.5 1 1.5 (d)
Fig. 4 Distributions of the measured (a) transverse mass of the identified electron and the missing transverse momentum, (b) Emiss
T , (c) leading jet pTand (d) jet multiplicity distributions in the W (→ eν)+jets control region for the inclusive SR1
selection, compared to the background expectations. The latter include the global normalization factors extracted from the data. Where appropriate, the last bin of the distribution includes overflows. The lower panels represent the ratio of data to MC expectations. The error bands in the ratios include the statistical and experimental uncertainties on the background expectations.
Sect.5 is expected to maintain the non-collision background below the percent level. The rate of the fake jets due to cosmic muons surviving the selection criteria, as measured in dedicated cosmic datasets, is found negligible with respect to the rate of data in the monojet-like signal regions. The major source of the non-collision backgrounds is thus beam-halo muons. Since jets due to non-collisions are expected to be in time with the bunch crossing, an assumption is made that all events containing a leading jet within the out-of-time window are due to beam-induced backgrounds. The characteristic shape of the fake jets due to beam-halo muons is extracted from signal-region events identified as beam-induced backgrounds based on the spatial alignment of the signals in the calorimeter and the muon system [116]. The level of non-collision background in the signal region is extracted as
NNCBSR =N−SR10<t<−5× N NCB
NNCB
−10<t<−5
, (3)
where N−SR10<t<−5 denotes the number of events in the signal region with a leading jet in the range
−10 ns < t < −5 ns, N−NCB10<t<−5 is the number of identified beam-induced background events there and
NNCB represents all identified events in the signal region. The results of this study indicate that the non-collision background in the different signal regions is negligible.
Events / GeV -3 10 -2 10 -1 10 1 10 2 10 3 10 Data 2012 SM uncertainty ll)+jets → Z( Di-boson + single top t t )+jets ν l → W( ATLAS -1 =8 TeV, 20.3 fb s >150 GeV miss T ee) CR, E → Z(
Di-electron invariant mass [GeV] 100 200 300 400 500 600 700 800 900 1000 Data/SM 0.5 1 1.5 (a) Events / GeV -3 10 -2 10 -1 10 1 10 2 10 3 10 Data 2012 SM uncertainty ll)+jets → Z( Di-boson + single top t t )+jets ν l → W( ATLAS -1 =8 TeV, 20.3 fb s >150 GeV miss T ee) CR, E → Z( [GeV] miss T E 200 400 600 800 1000 1200 Data/SM 0.5 1 1.5 (b) Events / GeV -3 10 -2 10 -1 10 1 10 2 10 Data 2012 SM uncertainty ll)+jets → Z( Di-boson + single top t t )+jets ν l → W( ATLAS -1 =8 TeV, 20.3 fb s >150 GeV miss T ee) CR, E → Z( [GeV] T Leading jet p 200 400 600 800 1000 1200 Data/SM 0.5 1 1.5 (c) Events -1 10 1 10 2 10 3 10 4 10 5 10 Data 2012 SM uncertainty ll)+jets → Z( Di-boson + single top t t )+jets ν l → W( ATLAS -1 =8 TeV, 20.3 fb s >150 GeV miss T ee) CR, E → Z( Jet multiplicity 1 2 3 4 5 6 7 8 9 10 11 Data/SM 0.5 1 1.5 (d)
Fig. 5 Distributions of the measured (a) dilepton invariant mass, (b) Emiss
T , (c) leading jet pTand (d) jet multiplicity
distributions in the Z/γ∗(→ e+e−)+jets control region for the inclusive SR1 selection, compared to the background
expec-tations. The latter include the global normalization factors extracted from the data. Where appropriate, the last bin of the distribution includes overflows. The lower panels represent the ratio of data to MC expectations. The error bands in the ratios include the statistical and experimental uncertainties on the background expectations.
7 Systematic uncertainties
Several sources of systematic uncertainty are considered in the determination of the background contribu-tions. Uncertainties on the absolute jet energy scale and resolution [110] translate into an uncertainty on the total background which varies from 0.2% for SR1 and 1% for SR7 to 3% for SR9. Uncertainties on the
EmissT reconstruction introduce an uncertainty on the total background which varies from 0.2% for SR1 and 0.7% for SR7 to 1% for SR9. Uncertainties of the order of 1%–2% on the simulated lepton identification and reconstruction efficiencies, energy/momentum scale and resolution, and a 0.5%–1% uncertainty on the track isolation efficiency translate, altogether, into a 1.4%, 1.5%, and 2% uncertainty in the total background for the SR1, SR7, and SR9 selections, respectively. Uncertainties of the order of 1% on the ETmiss trigger simulation at low ETmiss and on the efficiency of the lepton triggers used to define the electron and muon control samples translate into uncertainties on the total background of about 0.1% for SR1 and become negligible for the rest of the signal regions.
The top-quark-related background contributions, as determined from MC simulations (see Sect.3), are validated in dedicated validation regions defined similarly to theW(→ eν)+jets andW(→ µν)+jets control regions with ∆φ(pTmiss,jet) > 0.5 and by requiring the presence of two b-tagged jets in the final state with jet |η| <2.4. The comparison between data and MC expectations in those validation regions leads to uncertainties on the top-quark background yields which increase from 20% for SR1 to 100% for SR7 and SR9. This translates into uncertainties in the total background expectations which vary from 0.7% for
SR1 and 2.7% for SR7 to 4% for SR9. Similarly, uncertainties on the simulated diboson background yields include uncertainties in the MC generators and the modelling of parton showers employed, variations in the set of parameters that govern the parton showers and the amount of initial- and final-state soft gluon radiation, and uncertainties due to the choice of renormalization and factorization scales and PDF. This introduces an uncertainty on the diboson background expectation which increases from 20% for SR1 to 30% for SR7 and 80% for SR9. This results in an uncertainty on the total background of 0.7%, 2.3%, and 3% for the SR1, SR7, and SR9 selections, respectively.
Uncertainties on theW/Z+jets modelling include: variations of the renormalization, factorization, and parton-shower matching scales and PDF in the SHERPAW/Z+jets background samples; and uncertainties on the parton-shower model considered. In addition, the effect of NLO electroweak corrections on theW+jets toZ+jets ratio is taken into account [120–122]. Altogether, this translates into an uncertainty on the total background of about 1% for SR1 and SR7 and 3% for SR9.
Uncertainties on the multijet andγ+jets background contamination of 100% and 50%, respectively, in theW(→ eν)+jets control region, propagated to theZ(→ νν¯)+jets background determination in the signal regions, introduce an additional 1% uncertainly on the total background for the SR9 selection. The uncer-tainty on the multijet background contamination in the signal regions leads to a 2% and 0.7% unceruncer-tainty on the total background for the SR1 and SR2 selections, respectively. Finally, the impact of uncertainty on the total integrated luminosity, which partially cancels in the data-driven determination of the SM background, is negligible.
After including statistical uncertainties on the data and MC expectations in control regions and on the MC expectations in the signal regions, the total background in the signal regions is determined with uncertainties that vary from 2.7% for SR1 and 6.2% for SR7 to 14% for SR9.
7.1 Signal systematic uncertainties
Several sources of systematic uncertainty on the predicted signal yields are considered for each of the models for new physics. The uncertainties are computed separately for each signal region by varying the model parameters (see Sect.8).
Experimental uncertainties include: those related to the jet andEmissT reconstruction, energy scales and resolutions; those on the proton beam energy, as considered by simulating samples with the lower and upper allowed values given in Ref. [123]; a 1% uncertainty on the trigger efficiency, affecting only SR1; and the 2.8% uncertainty on the integrated luminosity. Other uncertainties related to the track veto or the jet quality requirements are negligible (<1%).
Uncertainties affecting the signal acceptance times efficiency A × ǫ, related to the generation of the signal samples, include: uncertainties on the modelling of the initial- and final-state gluon radiation, as determined using simulated samples with modified parton-shower parameters, by factors of two and one half, that enhance or suppress the parton radiation; uncertainties due to PDF and variations of theαs(mZ) value employed, as computed from the envelope of CT10, MRST2008LO and NNPDF21LO error sets; and the choice of renormalization/factorization scales, and the parton-shower matching scale settings, varied by factors of two and one half.
In addition, theoretical uncertainties on the predicted cross sections, including PDF and renormaliza-tion/factorization scale uncertainties, are computed separately for the different models.
8 Results and interpretation
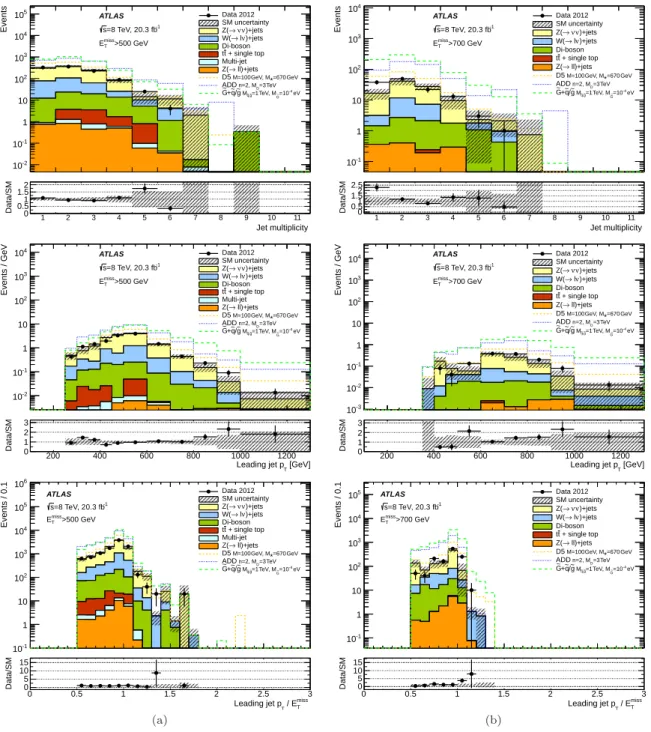
The data and the expected SM expectations in the different signal regions are presented in Tables4and5. In general, good agreement is observed between the data and the SM expectations. The largest difference between the number of events in data and the expectations is observed in the signal region SR9, correspond-ing to a 1.7σdeviation with a p-value of 0.05, consistent with the background-only hypothesis. Figures6 and7show several measured distributions in data compared to the SM expectations for SR1, and SR7 and SR9, respectively. For illustration purposes, the distributions include the impact of different ADD, WIMP, and GMSB SUSY scenarios.
The agreement between the data and the SM expectations for the total number of events in the different signal regions is translated into model-independent 90% and 95% confidence level (CL) upper limits on the visible cross section, defined as the production cross section times acceptance times efficiency σ × A × ǫ,
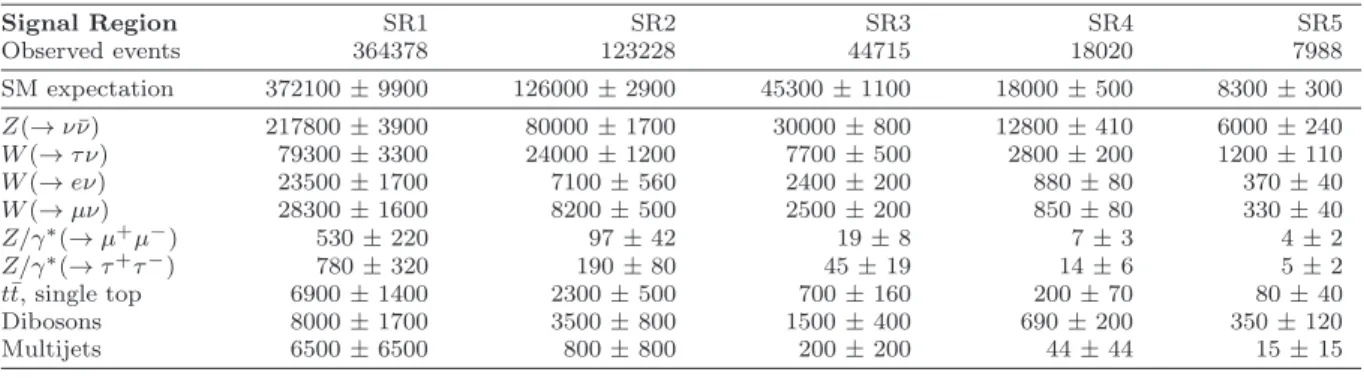
Table 4 Data and SM background expectation in the signal region for the SR1–SR5 selections. For the SM expectations both the statistical and systematic uncertainties are included. In each signal region, the individual uncertainties for the different background processes can be correlated, and do not necessarily add in quadrature to the total background uncertainty.
Signal Region SR1 SR2 SR3 SR4 SR5 Observed events 364378 123228 44715 18020 7988 SM expectation 372100 ± 9900 126000 ± 2900 45300 ± 1100 18000 ± 500 8300 ± 300 Z(→ ν ¯ν) 217800 ± 3900 80000 ± 1700 30000 ± 800 12800 ± 410 6000 ± 240 W (→ τ ν) 79300 ± 3300 24000 ± 1200 7700 ± 500 2800 ± 200 1200 ± 110 W (→ eν) 23500 ± 1700 7100 ± 560 2400 ± 200 880 ± 80 370 ± 40 W (→ µν) 28300 ± 1600 8200 ± 500 2500 ± 200 850 ± 80 330 ± 40 Z/γ∗(→ µ+µ−) 530 ± 220 97 ± 42 19 ± 8 7 ± 3 4 ± 2 Z/γ∗(→ τ+τ−) 780 ± 320 190 ± 80 45 ± 19 14 ± 6 5 ± 2 t¯t, single top 6900 ± 1400 2300 ± 500 700 ± 160 200 ± 70 80 ± 40 Dibosons 8000 ± 1700 3500 ± 800 1500 ± 400 690 ± 200 350 ± 120 Multijets 6500 ± 6500 800 ± 800 200 ± 200 44 ± 44 15 ± 15
Table 5 Data and SM background expectation in the signal region for the SR6–SR9 selections. For the SM expectations both the statistical and systematic uncertainties are included. In each signal region, the individual uncertainties for the different background processes can be correlated, and do not necessarily add in quadrature to the total background uncertainty.
Signal Region SR6 SR7 SR8 SR9 Observed events 3813 1028 318 126 SM expectation 4000 ± 160 1030 ± 60 310 ± 30 97 ± 14 Z(→ ν ¯ν) 3000 ± 150 740 ± 60 240 ± 30 71 ± 13 W (→ τ ν) 540 ± 60 130 ± 20 34 ± 8 11 ± 3 W (→ eν) 170 ± 20 43 ± 7 9 ± 3 3 ± 1 W (→ µν) 140 ± 20 35 ± 6 10 ± 2 2 ± 1 Z/γ∗(→ µ+µ−) 3 ± 1 2 ± 1 1 ± 1 1 ± 1 Z/γ∗(→ τ+τ−) 2 ± 1 0 ± 0 0 ± 0 0 ± 0 t¯t, single top 30 ± 20 7 ± 7 1 ± 1 0 ± 0 Dibosons 183 ± 70 65 ± 35 23 ± 16 8 ± 7 Multijets 6 ± 6 1 ± 1 0 ± 0 0 ± 0
Table 6 Observed and expected 90% CL and 95% CL upper limits on the product of cross section, acceptance and efficiency, σ × A × ǫ, for the SR1–SR9 selections.
Upper limits on σ × A × ǫ [fb]
Signal Region 90% CL Observed (Expected) 95% CL Observed (Expected)
SR1 599 (788) 726 (935) SR2 158 (229) 194 (271) SR3 74 (89) 90 (106) SR4 38 (43) 45 (51) SR5 17 (24) 21 (29) SR6 10 (14) 12 (17) SR7 6.0 (6.0) 7.2 (7.2) SR8 3.2 (3.0) 3.8 (3.6) SR9 2.9 (1.5) 3.4 (1.8)
using theCLsmodified frequentist approach [124] and considering the systematic uncertainties on the SM backgrounds and the uncertainty on the quoted integrated luminosity. The results are presented in Table6. Values of σ × A × ǫ above 599 fb–2.9 fb (726 fb–3.4 fb) are excluded at 90% CL (95% CL) for SR1–SR9 selections, respectively. Typical event selection efficiencies varying from 88% for SR1 and 83% for SR3 to 82% for SR7 and 81% for SR9 are found in simulatedZ(→ νν¯)+jets background processes.
Events -2 10 -1 10 1 10 2 10 3 10 4 10 5 10 6 10 7 10 Data 2012SM uncertainty )+jets ν ν → Z( )+jets ν l → W( Di-boson + single top t t Multi-jet ll)+jets → Z( GeV =670 * GeV, M M=100 D5 TeV =3 D n=2, M ADD eV -4 =10 G ~ TeV, M =1 g ~ , q ~ M g ~ / q ~ + G~ ATLAS -1 =8 TeV, 20.3 fb s >150 GeV miss T E Jet multiplicity 1 2 3 4 5 6 7 8 9 10 11 Data/SM 0.50 1 1.52 2.5 (a) Events / GeV -2 10 -1 10 1 10 2 10 3 10 4 10 Data 2012SM uncertainty )+jets ν ν → Z( )+jets ν l → W( Di-boson + single top t t Multi-jet ll)+jets → Z( GeV =670 * GeV, M M=100 D5 TeV =3 D n=2, M ADD eV -4 =10 G ~ TeV, M =1 g ~ , q ~ M g ~ / q ~ + G ~ ATLAS -1 =8 TeV, 20.3 fb s >150 GeV miss T E [GeV] miss T E 200 400 600 800 1000 1200 Data/SM0.50 1 1.52 (b) Events / GeV -2 10 -1 10 1 10 2 10 3 10 4 10 Data 2012 SM uncertainty )+jets ν ν → Z( )+jets ν l → W( Di-boson + single top t t Multi-jet ll)+jets → Z( GeV =670 * GeV, M M=100 D5 TeV =3 D n=2, M ADD eV -4 =10 G ~ TeV, M =1 g ~ , q ~ M g ~ / q ~ + G~ ATLAS -1 =8 TeV, 20.3 fb s >150 GeV miss T E [GeV] T Leading jet p 200 400 600 800 1000 1200 Data/SM 02 4 6 (c) Events / 0.1 1 10 2 10 3 10 4 10 5 10 6 10 7 10 8 10 9 10 Data 2012 SM uncertainty )+jets ν ν → Z( )+jets ν l → W( Di-boson + single top t t Multi-jet ll)+jets → Z( GeV =670 * GeV, M M=100 D5 TeV =3 D n=2, M ADD eV -4 =10 G ~ TeV, M =1 g ~ , q ~ M g ~ / q ~ + G ~ ATLAS -1 =8 TeV, 20.3 fb s >150 GeV miss T E miss T / E T Leading jet p 0 0.5 1 1.5 2 2.5 3 Data/SM0.50 1 1.5 (d)
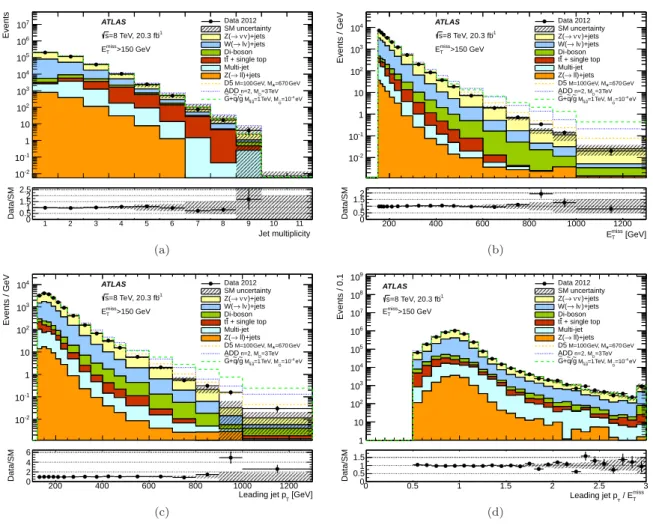
Fig. 6 Measured distributions of (a) the jet multiplicity, (b) Emiss
T , (c) leading jet pT, and (d) the leading jet pTto ETmiss
ratio for the SR1 selection compared to the SM expectations. The Z(→ ν ¯ν)+jets contribution is shown as constrained by the W (→ µν)+jets control sample. Where appropriate, the last bin of the distribution includes overflows. For illustration purposes, the distribution of different ADD, WIMP and GMSB scenarios are included. The error bands in the ratios shown in lower panels include both the statistical and systematic uncertainties on the background expectations.
8.1 Large extra spatial dimensions
The results are translated into limits on the parameters of the ADD model. The typicalA ×ǫof the selection criteria vary, as the number of extra dimensionsnincreases fromn= 2 ton= 6, between 23% and 33% for SR1 and between 0.3% and 1.4% for SR9, and are approximately independent ofMD.
The experimental uncertainties related to the jet and ETmiss scales and resolutions introduce, when combined, uncertainties in the signal yields which vary between 2% and 0.7% for SR1 and between 8% and 5% for SR9, with increasingn. The uncertainties on the proton beam energy result in uncertainties on the signal cross sections which vary between 2% and 5% with increasingn, and uncertainties on the signal acceptance of about 1% for SR1 and 3%–4% for SR9. The uncertainties related to the modelling of the initial- and final-state gluon radiation translate into uncertainties on the ADD signal acceptance which vary with increasingnbetween 2% and 3% in SR1 and between 11% and 21% in SR9. The uncertainties due to PDF, affecting both the predicted signal cross section and the signal acceptance, result in uncertainties on the signal yields which vary with increasingnbetween 18% and 30% for SR1 and between 35% and 41% for SR9. For the SR1 selection, the uncertainty on the signal acceptance itself is about 8%–9%, and increases to about 30% for the SR9 selection. Similarly, the variations of the renormalization and factorization scales introduce a 9% to 30% change in the signal acceptance and a 22% to 40% uncertainty on the signal yields with increasingnandEmissT requirements.
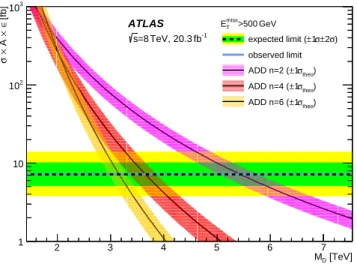
The signal region SR7 provides the most stringent expected limits and is used to obtain the final results. Figure 8 shows, for the SR7 selection, the ADD σ × A × ǫ as a function of MD for n = 2, n = 4, and
Events -2 10 -1 10 1 10 2 10 3 10 4 10 5 10 Data 2012 SM uncertainty )+jets ν ν → Z( )+jets ν l → W( Di-boson + single top t t Multi-jet ll)+jets → Z( GeV =670 * GeV, M M=100 D5 TeV =3 D n=2, M ADD eV -4 =10 G ~ TeV, M =1 g ~ , q ~ M g ~ / q ~ + G~ ATLAS -1 =8 TeV, 20.3 fb s >500 GeV miss T E Jet multiplicity 1 2 3 4 5 6 7 8 9 10 11 Data/SM 0.50 1 1.52 Events -1 10 1 10 2 10 3 10 4 10 Data 2012 SM uncertainty )+jets ν ν → Z( )+jets ν l → W( Di-boson + single top t t ll)+jets → Z( GeV =670 * GeV, M M=100 D5 TeV =3 D n=2, M ADD eV -4 =10 G ~ TeV, M =1 g ~ , q ~ M g ~ / q ~ + G ~ ATLAS -1 =8 TeV, 20.3 fb s >700 GeV miss T E Jet multiplicity 1 2 3 4 5 6 7 8 9 10 11 Data/SM0.50 1 1.52 2.5 Events / GeV -2 10 -1 10 1 10 2 10 3 10 4 10 Data 2012 SM uncertainty )+jets ν ν → Z( )+jets ν l → W( Di-boson + single top t t Multi-jet ll)+jets → Z( GeV =670 * GeV, M M=100 D5 TeV =3 D n=2, M ADD eV -4 =10 G ~ TeV, M =1 g ~ , q ~ M g ~ / q ~ + G~ ATLAS -1 =8 TeV, 20.3 fb s >500 GeV miss T E [GeV] T Leading jet p 200 400 600 800 1000 1200 Data/SM 01 2 3 Events / GeV -3 10 -2 10 -1 10 1 10 2 10 3 10 4 10 Data 2012SM uncertainty )+jets ν ν → Z( )+jets ν l → W( Di-boson + single top t t ll)+jets → Z( GeV =670 * GeV, M M=100 D5 TeV =3 D n=2, M ADD eV -4 =10 G ~ TeV, M =1 g ~ , q ~ M g ~ / q ~ + G ~ ATLAS -1 =8 TeV, 20.3 fb s >700 GeV miss T E [GeV] T Leading jet p 200 400 600 800 1000 1200 Data/SM 01 2 3 Events / 0.1 -1 10 1 10 2 10 3 10 4 10 5 10 6 10 Data 2012 SM uncertainty )+jets ν ν → Z( )+jets ν l → W( Di-boson + single top t t Multi-jet ll)+jets → Z( GeV =670 * GeV, M M=100 D5 TeV =3 D n=2, M ADD eV -4 =10 G ~ TeV, M =1 g ~ , q ~ M g ~ / q ~ + G~ ATLAS -1 =8 TeV, 20.3 fb s >500 GeV miss T E miss T / E T Leading jet p 0 0.5 1 1.5 2 2.5 3 Data/SM 0 5 10 15 (a) Events / 0.1 -1 10 1 10 2 10 3 10 4 10 5 10 Data 2012SM uncertainty )+jets ν ν → Z( )+jets ν l → W( Di-boson + single top t t ll)+jets → Z( GeV =670 * GeV, M M=100 D5 TeV =3 D n=2, M ADD eV -4 =10 G ~ TeV, M =1 g ~ , q ~ M g ~ / q ~ + G ~ ATLAS -1 =8 TeV, 20.3 fb s >700 GeV miss T E miss T / E T Leading jet p 0 0.5 1 1.5 2 2.5 3 Data/SM 05 10 15 (b)
Fig. 7 Measured distributions of the jet multiplicity, leading jet pT, and the leading jet pTto ETmissratio for (a) SR7
and (b) SR9 selections compared to the SM expectations. The Z(→ ν ¯ν)+jets contribution is shown as constrained by the W (→ µν)+jets control sample. Where appropriate, the last bin of the distribution includes overflows. For illustration purposes, the distribution of different ADD, WIMP and GMSB scenarios are included. The error bands in the ratios shown in lower panels include both the statistical and systematic uncertainties on the background expectations.
n = 6, calculated at LO. For comparison, the model-independent 95% CL limit is shown. Expected and observed 95% CL lower limits are set on the value ofMD as a function of the number of extra dimensions considered in the ADD model. TheCLsapproach is used, including statistical and systematic uncertainties. For the latter, the uncertainties on the signal acceptance times efficiency, the background expectations, and the luminosity are considered, and correlations between systematic uncertainties on signal and background expectations are taken into account. In addition, observed limits are computed taking into account the±1σ
3.27 TeV (n= 5), and 3.06 TeV (n= 6) are excluded at 95% CL, which extend significantly the exclusion from previous results using 7 TeV data [12]. The observed limits decrease by about 6%–8% after considering the −1σ uncertainty from PDF and scale variations in the ADD theoretical predictions (see Table7 and Fig.9).
As discussed in Ref. [12], the analysis partially probes the phase-space region with ˆs > MD2, where√ˆs
is the centre-of-mass energy of the hard interaction. This challenges the validity of model implementation and the lower bounds onMD, as they depend on the unknown ultraviolet behaviour of the effective theory. For the SR7 selection, the fraction of signal events with ˆs > MD2 is negligible forn= 2, but increases with increasingnfrom 1% forn= 3 and 6% forn= 4, to about 17% forn= 5 and 42% forn= 6. The observed 95% CL limits are recomputed after suppressing, with a weighting factor MD4/sˆ2, the signal events with ˆ
s > MD2, here referred to as damping. This results in a decrease of the quoted 95% CL on MD which is
negligible for n= 2 and about 3% forn= 6 (see Fig.9).
[TeV] D M 2 3 4 5 6 7 [fb] ∈ × A × σ 1 10 2 10 3 10 GeV >500 miss T E ) σ 2 ± σ 1 ± expected limit ( observed limit ) theo σ 1 ± ADD n=2 ( ) theo σ 1 ± ADD n=4 ( ) theo σ 1 ± ADD n=6 ( ATLAS -1 fb TeV, 20.3 =8 s
Fig. 8 The predicted ADD product of cross section, acceptance and efficiency, σ × A × ǫ, for the SR7 selection as a function of the fundamental Planck scale in 4 + n dimensions, MD, for n = 2, n = 4, and n = 6, where bands represent the
uncertainty on the theory. For comparison, the model-independent observed (solid line) and expected (dashed line) 95% CL limits on σ × A × ǫ are shown. The shaded areas around the expected limit indicate the expected ±1σ and ±2σ ranges of limits in the absence of a signal.
Table 7 The 95% CL observed and expected limits on the fundamental Planck scale in 4 + n dimensions, MD, as a function
of the number of extra dimensions n for the SR7 selection and considering LO signal cross sections. The impact of the ±1σ theoretical uncertainty on the observed limits and the expected ±1σ range of limits in the absence of a signal are also given. Finally, the 95% CL observed limits after damping of signal cross section for ˆs > M2
D (see body of the text) are quoted
between parentheses.
95% CL limits on MD[TeV]
n extra 95% CL observed limit 95% CL expected limit
dimensions +1σ(theory) Nominal (Nominal after damping) −1σ(theory) +1σ Nominal −1σ
2 +0.31 5.25 (5.25) −0.38 −0.59 5.25 +0.58
3 +0.25 4.11 (4.11) −0.33 −0.38 4.11 +0.36
4 +0.20 3.57 (3.56) −0.29 −0.26 3.57 +0.25
5 +0.17 3.27 (3.24) −0.25 −0.23 3.27 +0.21
Number Of Extra Dimensions
2 3 4 5 6
95% CL Lower Limit [TeV]
D M 2 3 4 5 6 7 ATLAS -1 fb TeV, 20.3 =8 s GeV >500 miss T E ) σ 2 ± σ 1 ± expected limit ( observed limit obs. limit (after damping)
TeV 7
-1
fb ATLAS 4.7
Fig. 9 Observed and expected 95% CL limit on the fundamental Planck scale in 4 + n dimensions, MD, as a function of
the number of extra dimensions. In the figure the two results overlap. The shaded areas around the expected limit indicate the expected ±1σ and ±2σ ranges of limits in the absence of a signal. Finally, the thin dashed line shows the 95% CL observed limits after the suppression of the events with ˆs > M2
D(damping) is applied, as described in the body of the text.
The results from this analysis are compared to previous results from ATLAS at 7 TeV [12] without any damping applied.
8.2 Weakly interacting massive particles
In the following, the results are converted into limits on the pair production of WIMPs. As illustrated in Fig.1, this is done both in the EFT framework and in a simplified model where the WIMP pair couples to Standard Model quarks via aZ′
boson.
For each EFT operator defined in Table1, the limits on M⋆ are extracted from those signal regions that exhibit the best expected sensitivity: these are SR4 for C1, SR7 for D1, D5, D8, and SR9 for C5, D9, D11. These are translated into corresponding 95% CL limits on the suppression scale M⋆ as a function of
mχ. To derive these lower limits on M⋆, the same CLs approach as in the case of the ADD LED model is used. The uncertainties on the WIMP signal acceptance include: a 3% uncertainty from the uncertainty on the beam energy; a 3% uncertainty from the variation of the renormalization and factorization scales and a 5% uncertainty from the variation of the parton-shower matching scale; a 1% to 10% uncertainty from uncertainties on jet andEmissT energy scale and resolution; and a 5% to 29% uncertainty due to PDF, depending on the operator and WIMP mass.
Similarly, the uncertainties on the signal cross section are: a 2% to 17% (40% to 46%) uncertainty due to the variation of the renormalization and factorization scales in D1, D5 and D9 (C5 and D11) operators; and a 19% to 70% (5% to 36%) uncertainty due to the PDF for C5, D11 and D1 (D5 and D9) operators, with increasing WIMP mass. These theoretical cross-section uncertainties are not considered when deriving limits and are not displayed in the plots. A 2% to 9% uncertainty on the cross section, due to the beam energy uncertainty, is taken into account.
The M⋆ limits for five of the operators are shown in Fig. 10 down to WIMP masses of 10 GeV, and could be extrapolated even to smallermχ values since there is a negligible change in the cross section or the kinematic distributions at the LHC for such low-mass WIMPs. The 1σand 2σ error bands around the expected limit are due to the acceptance uncertainties (experimental and theoretical). The effect of the beam-energy uncertainty on the observed limit is negligible and is not shown.
Various authors have investigated the kinematic regions in which the effective field theory approach for WIMP pair production breaks down [42–45]. The problem is addressed in detail inAppendix A, where the region of validity of this approach is probed for various assumptions about the underlying unknown new physics. Here, the EFT framework is used as a benchmark to convert the measurement, and in the absence of any deviation from the SM backgrounds, to a limit on the pair production of DM (with the caveat of not complete validity in the full kinematic phase space). These are the central values of the observed and expected limits in Fig.10. A basic demonstration of the validity issue is also included in the figure. This is done by relating the suppression scaleM⋆to the mass of the new particle mediating the interaction,Mmed,