1994 J. Fluid Mech. (1994), vol. 274, pp. 1-21 1 Copyright C 1994 Cambridge University Press
age
1
Active vorticity control in a shear flow using a
23
flapping foil
By R. GOPALKRISHNAN', M. S. TRIANTAFYLLOU',
43
G. S. TRIANTAFYLLOU
2 ANDD. BARRETT'
1Department of Ocean Engineering, Massachusetts Institute of Technology, Cambridge,
69 MA 02139, USA
93 2The Levich Institute and Department of Mechanical Engineering, The City College of New York, New York, NY 10031, USA
115 (Received 19 February 1993 and in revised form 28 February 1994)
It is shown experimentally that free shear flows can be substantially altered through
13- 4) > t direct control of the large coherent vortices present in the flow.
First, flow-visualization experiments are conducted in Kalliroscope fluid at Reynolds
number 550. A foil is placed in the wake of a D-section cylinder, sufficiently far behind 160" the cylinder so that it does not interfere with the vortex formation process. The foil
3- 2 a performs a heaving and pitching oscillation at a frequency close to the Strouhal
e19 - >(afrequency of the cylinder, while cylinder and foil also move forward at constant speed.
By varying the phase of the foil oscillation, three basic interaction modes are identified.
(i) Formation of a street of pairs of counter-rotating vortices, each pair consisting of
219 one vortex from the initial street of the cylinder and one vortex shed by the foil. The
width of the wake is then substantially increased. (ii) Formation of a street of vortices with reduced or even reverse circulation compared to that of oncoming cylinder
243 vortices, through repositioning of cylinder vortices by the foil and interaction with vorticity of the opposite sign shed from the trailing edge of the foil. (iii) Formation of 267 a street of vortices with circulation increased through merging of cylinder vortices with vortices of the same sign shed by the foil. In modes (ii) and (iii) considerable repositioning of the cylinder vortices takes place immediately behind the foil, resulting 293 in a regular or reverse Kdrmin street. The formation of these three interaction patterns is achieved only for specific parametric values; for different values of the parameters no dominant stable pattern emerges.
339 Subsequently, the experiments are repeated in a different facility at larger scale, 349 resulting in Reynolds number 20000, in order to obtain force and torque
measurements. The purpose of the second set of experiments is to assess the impact of flow control on the efficiency of the oscillating foil, and hence investigate the possibility
383 of energy extraction. It is found that the efficiency of the foil depends strongly on the
phase difference between the oscillation of the foil and the arrival of cylinder vortices. 405 Peaks in foil efficiency are associated with the formation of a street of weakened
vortices and energy extraction by the foil from the vortices of the vortex street. 406
406 1. Introduction
Flow control is currently attracting increased attention in connection with a variety 408 of applications. In flow control applications one may want to destabilize the flow, in
410 order to achieve better mixing, or to stabilize the flow in order to eliminate undesirable 411 unsteady loads. Several studies have appeared on the subject, and one can classify the
R. Gopalkrishnan and others vortic-visuali betwee experiJ on the Apa experii hydro( simula , tne ma
FIGURE 1. Sketch of the concept tested. An oscillating symmetric foil is placed in the wake of a lost in
cylinder oscillating transversely. Cylinder and foil also move forward at constant speed.
techniques used into two major categories: passive control, in which flow control is 2. De achieved by altering the geometry of the flow; and active control, in which a time- In c dependent forcing is applied to the flow, by means, for instance, of a loudspeaker. alterin
Passive control can suppress unsteadiness in a flow (as demonstrated by Chen & scale Templin 1974; Zdravkovich 1981; Strykowski & Sreenivasan 1990). In practical cylind& applications, however, no matter how careful the design is, flow separation and is tows unsteadiness behind moving bodies are often unavoidable because of manoeuvring is osci]
motions, or encountering ambient turbulence. The possibility of actively controlling a vortic(
flow has thus been studied by several researchers. cylindt
Active control can be divided into open loop schemes, in which the forcing is a observ prescribed function of time, and closed-loop schemes, in which the forcing is a function within of some real-time measurement of the response of the flow. Open-loop schemes rely on consta an accurate knowledge of the basic fluid mechanics of the problem in order to prescribe A s3
the appropriate forcing function for the controller (see Tokumaru & Dimotakis 1991 downs as a paradigm of effective use of this method). In closed-loop schemes, on the other cylindi
hand, a sensor device is placed in the flow field, and its signal, after going through a motio controller, is fed to the actuator device (see e.g. Ffowcs Williams & Zhao 1989). paralk
Closed-loop schemes thus do not necessary require the detailed knowledge of fluid transv mechanics that open-loop schemes do, but, in addition to the issue of closed-loop along stability, the very important question of observability of the flow remains open. In fact, but w
Roussopoulos (1993) has recently presented convincing evidence that, when a single cylindi sensor is used, the flow is not observable, in the sense that unsteady patterns are present oscilla
without being detected by the sensor. is thus
In this paper we investigate an active flow control concept, which relies on directly Two controlling the coherent vortices present in high Reynolds number flows. The goal here length is to reposition these vortices and change their strength in a way that is considered on the
desirable. Herein open-loop studies are reported only. In order to demonstrate the span t
concept and to study the basic fluid mechanics involved, we conducted a generic The
experiment which aimed at altering the vortex street produced by a bluff object through
the use of an oscillating foil, placed in the wake of the object. Previously, stationary
foils have been used as vortex splitting devices in boundary-layer control (see among where
others, Corke, Guezennec & Nagib 1979; Hefner, Weinstein & Bushnell 1979; Dowling chord
1985). An oscillating foil was used by Koochesfahani & Dimotakis (1988) to cancel the cylindi
effect of an externally imposed harmonic perturbation in a mixing layer. (pitch)
In the following sections we provide experimental evidence that, by appropriately
adjusting the phase of the oscillating foil, it is feasible to alter the strength and position
of the vortices of the Kirmin vortex street downstream of the foil, thus creating new where
2
Active vorticity control in a shear flow
vortical patterns in the wake. The investigation consists of two parts: (a) flow-visualization experiments, at Reynolds number 550, in which the interaction modes between the oscillating foil and the vortex street are identified, and (b) force-measuring experiments, in which the effect of the modes identified in part (a) on the forces acting on the foil and the resulting efficiency are investigated.
Apart from demonstrating the feasibility of flow control, the results of the
experiments reported in this paper can be used to interpret observations in the hydrodynamics of fish swimming, since the oscillating foil can be loosely thought of as
simulating the effect of the tail of the fish, which controls the vorticity generated by the main body of the fish (Rosen 1959), with the intent of recovering some of the energy
of a lost in forming these vortices.
rol is 2. Description of experiments
time- In order to demonstrate that vortices can be controlled directly, in the sense of cer. altering their position and strength; and also that energy can be extracted from
large-Len & scale patterns, we devised the following experimental scheme, shown in figure 1. A ctical cylinder with a D-shaped cross-section, with the flat part of the D facing downstream, t and is towed at constant speed in order to generate a Kairmain vortex street. The cylinder .vring is oscillated at a frequency close to its Strouhal number so that strong, well-correlated ling a vortices are formed in its wake. A D-section cylinder was selected, instead of a circular
cylinder, in order to avoid the large-amplitude swinging motion of the base region,
; is a observed in circular cylinders (Ongoren & Rockwell 1988). It was also found that
iction within a small range around the frequency tested, the phase of the formed vortices was ly on constant, hence providing good vortex-formation phase control.
scribe A symmetric foil is placed in the wake of the cylinder, at a sufficiently large distance
1991 downstream of the cylinder to avoid interference with the formation region of the
other cylinder. The foil oscillates in a combined transverse motion (heave) and rotational
ugh a motion (pitch). The average transverse position of the foil and the cylinder are on a line 1989). parallel to the direction of forward motion. For experimental simplicity, the same 'fluid transverse motion was imposed on the cylinder and the foil, while their relative distance [-loop along the direction of motion (longitudinally) was kept constant in each experiment,
i fact, but was allowed to vary between experiments. The longitudinal distance between single cylinder and foil determines the specific transverse position and pitch angle of the
resent oscillating foil when it encounters oncoming cylinder vortices at its leading edge, and is thus the main control parameter in the experiment.
rectly Two different tanks were used to study vorticity control, a small tank (2.44 m in .1 here length) used for visualization, and a larger tank (30 m in length) used to measure forces
dered on the foil. The apparatus used in both cases was geometrically similar, except for the
te the span to diameter ratio.
eneric The cylinder (of diameter d and span 1) is forced to oscillate with displacement y(t):
ronugh c(t) = Acsin (2rfc t), (1)
onary
mong where Ac is the oscillation amplitude, andfc is the oscillation frequency. The foil, of ,wling chord length c, and span equal to the cylinder span, is placed at a distance s behind the -el the cylinder and subjected to a combined transverse translation (heave) and rotation
(pitch). The heave displacement, yF(t), is given as: fiately
,sition yF(t) = AFsin (2rfF t+ li), (2)
g new where AF denotes the amplitude, fF the frequency and f the phase angle between the
R. Gopalkrishnan and others
motion of the foil and that of the cylinder. The pitching motion of the foil, 0(t), has
the same frequencyfFr as the heave motion, its pivot point is at a distance p from the leading edge, and it is given as:
0(t) = 0 sin (2fF t +
f
+ ), (3)where qS denotes the phase angle between the pitching and heaving motions of the foil.
The system operates in a uniform flow of free-stream velocity U. The Reynolds number
was - 550 for the flow-visualization experiments and , 20000 for the force measurement experiments.
One cylinder and two foil models were fabricated, providing foil chord to cylinder
diameter geometric ratios cid of 1 and 2, respectively. Most tests were performed with the larger foil (cid = 2), since preliminary visualization experiments showed that the smaller foil (c/d = 1) produced very weak vortex interactions.
Three values of cylinder oscillation amplitude ratio -were selected to ensure strong lock-in vortex shedding; these were AC/d = 0.500, 0.667, and 0.833. Since the same
heaving mechanism was used to oscillate both the cylinder and the foil, Ac = AF,fC =
f,,
and lf = 0. Because was fixed, the separation length ratio s/d was made highly variable (21 discrete values between 1.5 and 8.0) so as to control the arrival time ofcylinder vortices at the foil leading edge, to correspond to different phases of the foil
motion. These simplifications limited somewhat our ability for vorticity control, for example by not being able to control the strength of the foil vortices independently.
However, the phasing between the arrival of the vortices and the motion of the foil, FIGU
which is the principal control parameter, could be varied in an almost continuous (healphas(
manner. Heav
Fixed values were chosen for the model aspect ratios and foil pivot point. The mote cylinder aspect ratio, l/d, was 5.33 for the flow visualization experiments and 12.00 for
the force measurement experiments, while the larger foil aspect ratio, /c, was 2.67 for anise the flow-visualization experiments and 6.00 for the force-measurement experiments. sedii
The ratio of the distance of the foil pivot point from the leading edge to the chord Gor
length, p/c, was chosen to be 0.33 in all cases. G
The design of the foil pitching oscillator used in the flow-visualization experiments turb allowed the following discrete values of pitch amplitude 0: 0, 7°, 15°, 30°, 45° and 60°. aligr Of these allowable values, most runs were conducted with 0 at 150, 300 or 45° . Kall Based on earlier experiments on a flapping foil (Triantafyllou et al. 1991, 1993), usinl which showed that optimal efficiency is achieved when the phase angle 0 between the proF foil pitching and heaving motions is between 70°and 100°, a value of 90°was used for perfi
this phase angle throughout. In order to ensure strong lock-in vortex generation, the fluid experiments were conducted at cylinder Strouhal numbers very close to fc d/l U = 0.20. He
As a result of the simplifications noted above, the experiments were conducted with para
different combinations of the following parameters: motion amplitude to diameter shov ratio AC/d, cylinder Strouhal numberfc d/U, pitch amplitude 0, and separation length visu; s/d. The principal control parameter in the problem was found to be the separation shea
length ratio s/d. well
are I
In
3. Flow-visualization experiments cons
In order to conduct flow-visualization experiments, a small tank was used together Plex with a commercially available Kalliroscope fluid. This fluid is a very dilute colloidal was suspension of organically derived guanine flakes in water. The guanine flakes have a one typical dimension of 6 x 30 x 0.07 [tm3; thus they are very small and have a highly pros
Active vorticity control in a shearflow 5 t), has im the (3) le foil. umber force dlinder d with Lat the strong ; same
,fc =
highly ime of he foil ol, fore
foil, FIGuRE 2. The oscillating mechanism used in the Kalliroscope tank to impart the same transverse (heave) motion on the cylinder and the foil, while allowing the foil to pitch at variable amplitude and inuous phase relative to the heave motion. Pitching is produced through an oscillating 4-bar linkage. Heaving is driven by a rotating scotch yoke. Both motions are powered by a single variable-speedt. The motor.
.00 for
.67 for anisotropic shape. The specific gravity of guanine is about 1.62, and the observed ments. sedimentation velocity of Kalliroscope flakes in water is about 0.1 cm/h (Matisse & chord Gorman 1984). We added a blue aqueous dye to the water to aid in the visualization. Gorman & Swinney (1982) used Kalliroscope fluid to visualize the onset of weak iments turbulence in the circular Couette system. They found that the Kalliroscope platelets ad 60°. align with the flow, and the intensity of the scattered light measured with their
Kalliroscope fluid apparatus had the same features as earlier velocity measurements
1993), using a laser Doppler velocimeter, while the influence of the suspension on the ,en the properties of pure water was less than 0.1 % (Matisse & Gorman 1984). Sava§ (1985) sed for performed a stochastic analysis of the motion of thin, ellipsoidal particles in a viscous
on, the fluid, with a view to predicting the observed light field in flow-visualization experiments. = 0.20. He concluded that in the presence of a shear flow, the flakes align themselves to be ,d with parallel to the stream surfaces, which are thus revealed in the visualization. He also
ameter showed that this technique of using small suspended particles is unsuitable for length visualizing flows involving small-amplitude perturbations to backgrounds with high
3ration shear, e.g. Tollmien-Schlichting waves in a boundary layer. The Kalliroscope fluid was well suited to the experiments reported herein, i.e. for visualizing vortex flows, which
are large-scale, high shear perturbations over uniform background flows.
In order to utilize the Kalliroscope fluid, a smaller visualization tank was constructed. The K-tank (as we shall call it for brevity) consisted of a rectangular
)gether Plexiglas structure of dimensions 2.44 x 0.60 x 0.15 m3. A small, belt-driven carriage
)lloidal was constructed to ride over the K-tank, supported rigidly by linear ball bearings on
have a one side and a single cam follower on the other side. A d.c. motor was employed to
R. Gopalkrishnan and others 0.25 0.20 _ 0.15 Cd
0.10
0.10 v. v_ 0 *... ... ,... 0 ,... · . 0 0 ... 0 100 200 300 400 500 600 700 Reynolds numberFIGuRE 3. Measured Strouhal number for a stationary D-section cylinder moving forward at
constant speed, as function of Reynolds number. Fiu
up to 0.15 m s-1. An oscillation mechanism, similar to the experimental apparatus of
Freymuth (1990), was designed and implemented. Figure 2 is a schematic illustration
of this mechanism, which allowed for both translation (heaving) and rotation Numt
(pitching) motions to be provided by a single d.c. motor. Independently adjustable 1
settings provided for a heave amplitude of up to 3.81 cm, a pitch angle amplitude of 2 up to 60°, and an oscillation frequency of up to 0.35 Hz. A number of values for the 3 phase angle 0 could be set; we used only the setting of 90°. The oscillation mechanism 4
was installed on the towing carriage, and the cylinder and foil models were suspended 5
vertically into the fluid, via a mounting assembly that provided for close control of the 7
separation length between the models. The K-tank was illuminated by diffuse lighting 8 from overhead fluorescent sources. A high-resolution black-and-white video camera 9
was mounted on a tripod bolted to the carriage, enabling video recordings of the wake patterns to be obtained from a frame of reference moving with the carriage. Still photographs of the wake were obtained off a TV monitor while playing back the video
recordings. cylind
3.1. Experimental results to the
Little information exists in the literature on the behaviour of vortex formation behind freque
a D-section cylinder, so we first conducted a number of stationary (non-oscillating) variat tests with the D-section cylinder alone. The cylinder has diameter 1.91 cm and span numbi
10.15 cm. The model was towed at different speeds through the Kalliroscope fluid and about the vortices shed over a specific distance were counted, in order to determine the rapid Strouhal number. Figure 3 shows that the form and values of the curve depicting the The Strouhal number versus the Reynolds number for the D-section cylinder is similar to span
the corresponding curve for a circular cylinder. Hoerner (1965, p. 3.17) lists an consis average drag coefficient of 1.16 for a D-section cylinder, which is also very close to the separa
value of 1.17 listed for a circular cylinder. the nc
Tests with a D-section and hydrofoil tandem arrangement proved that the D-section indeed performed its intended role of generating strong vortices without disrupting the
flow upstream of the foil, i.e. the street vortices were formed behind the cylinder
without noticeable change compared to the case of towing the cylinder alone. When the where
0 0 ... _... I 0 ... l l I I ! ! ...··· ... -"""6""" 1 ... W.... ... ...-0 ... I... 6
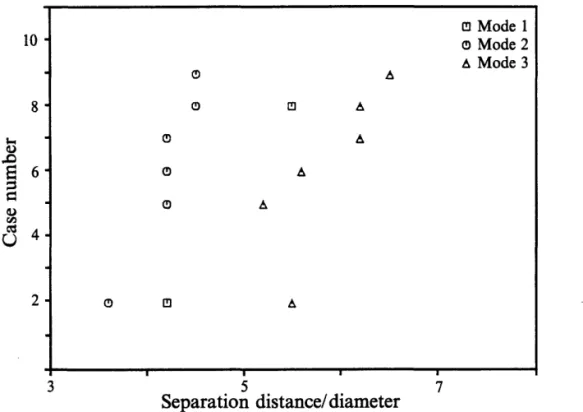
Active vorticity control in a shear flow 10 -81 -0 E 6 ) 4- 2-3 5 7 at Separation distance/diameter
FIGuRE 4. Modes 1, 2 and 3 as function of the relative spacing between cylinder and foil. The numbers at the vertical axis denote the corresponding condition described in table 1.
us of ation
ation Number Heave (Ac/d) Pitch (0) Strouhal number (SF) Angle of attack (a)
table 1 0.500 150 0.246 + 16.86 de of 2 0.500 300 0.354 +01.86 )r the 3 0.500 450 0.483 -13.14 Lnism 4 0.667 150 0.302 + 24.65 Inded 5 0.667 300 0.395 + 09.65 6 0.667 450 0.509 -05.35 ,f the 7 0.833 15° 0.358 +31.01 hting 8 0.833 300 0.441 + 16.01 mera 9 0.833 450 0.550 +01.01
wake TABLE 1. Heave and pitch amplitude combinations tested.
Still video
cylinder was forced to oscillate transversely, the phase of the vortex formation (relative to the cylinder oscillation) was found to depend very weakly on the oscillation ehind frequency, within a small range bracketing the Strouhal number of 0.20. Hence, small
iting) variations in frequency were not of importance and all runs were conducted at Strouhal span numbers close to 0.20. The Reynolds number Rn, based on the cylinder diameter, was
d and about 550 for all experiments, which is well beyond the Rn region over which there is Le the rapid Strouhal number variation, as shown in figure 3.
ig the The foil used has a NACA 0012 shape with zero camber, chord length 3.81 cm and lar to span equal to the cylinder span. Tests were conducted over a grid of parameters
;ts an consisting of three heave-amplitude settings, three pitch-amplitude settings, and twenty to the * separation lengths. For each combination of heave and pitch amplitude, we calculated
the nominal foil Strouhal number SF:
-ction
fFAg the SF = U (4)
linder
-n the where A denotes the total excursion of the trailing edge of the foil. We employ the term n Mode 1 o Mode 2 A Mode 3 o A O 9 A O A o A o A . . !l 7
--R. Gopalkrishnan and others I ' C /2 B \ E _
@
(~~~ 3®
£
(~_c F / II/
\
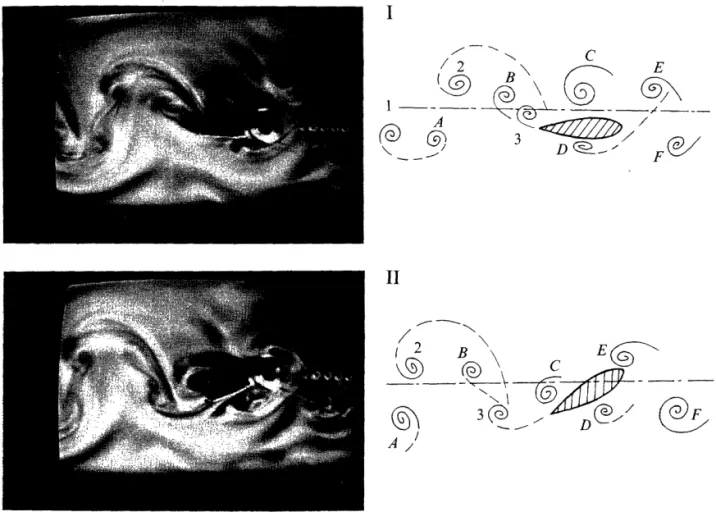
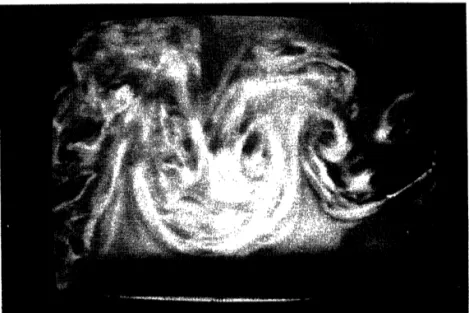
(2s B \ (&' 3 (9i AFIGURE 5. Wake interaction mode 1. Four views are presented for each mode, at time intervals equal FIGURI to one quarter the period of foil oscillation. Views I and II are shown here. The cylinder and foil are of its h moving from left to right. The cylinder is at the right-hand edge of the photograph, the foil is visible is joinc behind, attached to the carriage through a structure made of transparent plastic. The sketch beside while c the photograph depicts the principal features. Each cylinder vortex joins up with a newly formed foil Foil v vortex of the opposite sign to form a pair, thus a street of vortex pairs is formed, resulting in an 4. Pair expanding wake. In all drawings, the cylinder's Krmin vortices are labelled with letters (A, B, C, foil, vc etc.), while the foil vortices are labelled with numerals (1, 2, 3, etc.). At instant I, the foil is at the assume bottom of its heave stroke. Cylinder vortex C has been moved down from its upstream position owing
to foil suction, and foil vortex 3 is in the process of formation. The foil has just encountered cylinder the so vortex D near the leading edge. Instant II is taken when the foil is at the centreline, moving upwards. origin Foil vortex 3 has been shed into the wake, and cylinder vortex C is being rolled off the trailing edge. Fig Cylinder vortex D is now trapped by the foil suction and is moving upwards from its original position. above separ;
nominal Strouhal number since the actual flow velocity at the foil was not measured; the D
instead, the free-stream velocity U has been used in the calculations. Table lists the The v
heave- and pitch-amplitude combinations tested; each entry of the table was repeated in tab
for 20 separation length settings. for ce
It was found thai: the oscillating foil altered substantially the position and strength mode
of the incoming cylinder vortices. We note again that the effect of the foil on the We vortices was felt only near and downstream of the foil, while the near wake of the consti cylinder was not changed noticeably. We identified the following three distinct stable
modes: 3.1.1.
1. Expanding wake, when oncoming cylinder vortices pair up with vortices shed by In t the foil to form 'mushroom'-like structures, drifting away transversely to the flow. of the 2. Destructive interaction, when oncoming cylinder vortices are repositioned by the wake, foil and they interact with vorticity of the opposite sign shed by the trailing edge of the resulti foil, to form ultimately weakened vortices, or even vortices of the opposite circulation. The 3. Constructive interaction, when oncoming cylinder vortices merge with vortices of sequel
8
Active vorticity control in a shear flow III
-\ ./`3
X
D IV9
I\
4
\
E)-,
EGN
\3(0)D ~ '~
-
C/
C/3is equal FIGURE 6. Wake interaction mode 1, views III and IV. View III is taken when the foil is at the top foil are of its heave stroke. Cylinder vortex C has moved downstream from the trailing edge of the foil, and fvisible is joined with foil vortex 3 of the opposite rotational sign. Foil vortex 4 forms at the trailing edge, ibeside while cylinder vortex D has been repositioned. In view IV the foil is at the centreline, moving down. ed foil Foil vortex 4 has been shed from the trailing edge, and cylinder vortex D forms a pair with vortex g in an 4. Pair 3-C is convecting slowly downstream and away from the wake centreline. Just upstream of the , Bn Cn foil, vortex E is trapped by the foil suction and is moving downwards; at an instant !T later it will s at the assume the position of vortex C of view I of figure 5 and the cycle will repeat.
1 owing
:ylinder the same sign shed by the foil to form much stronger vortices compared to their )wards. original strength.
ig edge. Figure 4 shows the various combinations of the principal parameters at which the osition. above modes were found. The horizontal axis of the figure refers to the spacing, i.e. the separation length between the cylinder and the foil, measured between the rear face of sured; the D-section cylinder and the pivot point on the foil, divided by the cylinder diameter. sts the The vertical axis provides the case number tested, with reference to the conditions listed peated in table 1. Figure 4 shows that the spacing s/d is the most important parameter, and for certain combinations of heave and pitch, it was possible to achieve more than one rength mode by varying s/d suitably.
on the We discuss next the principal features of each of the three modes since they
of the constitute [major patterns for flow control.
stable
3.1.1. Mode 1. Expanding wake
hed by In this mode each oncoming cylinder vortex joins up with a newly formed foil vortex
flow. of the opposite sign to form a pair, slowly drifting away from the centreline of the
by the wake, owing to the mutual velocity induction. Thus a street of vortex pairs is formed, of the resulting in an expanding wake.
lation. The formation of vortex pairs is illustrated in figures 5 and 6. The figures show a
tices of sequence of photographs of the wake taken at instants of time approximately ¼T apart, )/
9
DD) F
R. Gopalkrishnan and others I I (A) / 2(B) l D F w II /2(B) 3(C__ - ( 7/ DF
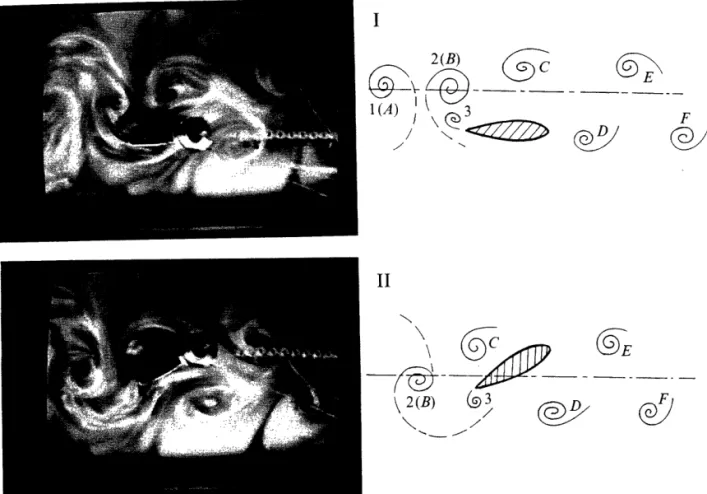
FIGURE 7. Wake interaction mode 2, views I and II. Cylinder vortices are repositioned by the foil and FIGU
FIGUI: interact with vorticity of opposite rotational sign shed by the trailing edge of the foil. In I the foil is motio at the bottom of its heave stroke, and a strong vortex is seen forming off the trailing edge (3). Cylinder of orof vo vortex C is slightly below and upstream of vortex 3. Cylinder vortex D is below the leading edge of centre the foil. View II is taken when the foil is at the centreline and moving up. Vorticity shed by the foil cylind (3) has interacted destructively with cylinder vortex C. Foil vortex 4 is being formed at the trailing vorte edge, while cylinder vortex D is being repositioned upwards. The foil is about to encounter cylinder aligne vortex E near its leading edge.
where T = I/f is the time period of the oscillation. The photographs focus on the edge, region of the wake surrounding the oscillating foil, and show the vortex patterns both show
upstream and downstream of the foil. The direction of towing is from left to right, vorte
giving an equivalent free-stream velocity from right to left. Hand-drawn figures of the a pai
vortex positions accompany the photographs, to clarify the evolution of the process. from
In all drawings, the cylinder's Kirmin vortices (coming from upstream) are labelled sucti( with letters (A, B, C, etc.), while the foil vortices are labelled with numerals (1, 2, 3, vorte etc.).
Figure 5 illustrates the instants I and II of the cycle. At instant I, the foil is at the 3.1.2 bottom of its heave stroke. In the first view, cylinder vortex C has moved down from Ml its upstream position (owing to foil suction), while foil vortex 3 is in the process of repo,
formation. In addition, the foil has just encountered cylinder vortex D near the leading oppo edge. Instant II is taken at time 4T later, when the foil is at the centreline, moving oppo
upwards. Foil vortex 3 has been shed into the wake, and cylinder vortex C is being small rolled off the trailing edge as well. Cylinder vortex D is now trapped by the foil suction stren
and is moving upwards from its original position. type
Figure 6 illustrates instants III and IV of the cycle. View III is taken at time 4T later A and the foil is now at the top of its heave stroke. Cylinder vortex C has moved in fig downstream from the trailing edge of the foil, and is joined with foil vortex 3 of the 'T ay
opposite rotational sign. Foil vortex 4 is in the process of formation from the trailing right
Active vorticity control in a shear flow III / 2(B) 3(C)> G
\ - `4
F
IVi\
3(C) / (QE)\x / ?7 /oil and FIGURE 8. Wake interaction mode 2, views III and IV. View III, shows the foil at the top of its heave foil is motion. Foil vortex 4 is seen behind the trailing edge; cylinder vortex D lies just above and in front ylinder of vortex 4. Cylinder vortex E is above the leading edge of the foil. View IV shows the foil at the wake sdge of centreline, on its way down. Vorticity shed by the foil (4) has weakened as a result of interaction with the foil cylinder vortex D and is well into the wake. Foil vortex 5 is in the process of formation, while cylinder trailing vortex E is being repositioned by the foil suction. The composite vortices 3(C) and 4(B) are nearly
ylinder aligned within the wake.
)n the edge, while cylinder vortex D has been repositioned by the suction of the foil. View IV s both shows the final instant of the sequence. The foil is at the centreline, moving down. Foil right, vortex 4 has been shed from the trailing edge, and cylinder vortex D is swept to form of the a pair with vortex 4. Downstream of the foil, the vortex pair 3-C convects slowly away :ocess. from the wake centreline. Just upstream of the foil, vortex E is trapped by the foil
Lbelled suction and moves downwards; at an instant T later it will assume the position of
2, 3, vortex C of view I of figure 5 and the cycle will repeat.
at the 3.1.2. Mode 2 Destructive interaction
1 from Mode 2 is characterized by a destructive interaction, where cylinder vortices are :ess of repositioned by the foil and they interact with vorticity shed by the foil, which is of eading opposite rotational sign. The resulting vortices have smaller circulation than, or even ioving opposite circulation to, the oncoming cylinder vortices, and form a vortex street with being small lateral spacing, and hence small induced in-line wake velocity. Depending on the .uction strength of the foil vortices, the configuration downstream of the foil was of the thrust
type (reverse Kdrmin street) or of the drag type (Kirman street).
T later A destructive interaction is illustrated by the sequence of photographs and drawings
moved in figures 7 and 8. As before, each figure contains two photographs taken at instants of the 'T apart in time, for a total sequence of four views. The free-stream velocity is from .railing right to left.
11
O
R. Gopalkrishnan and others I
2(B)
C
F /- K-1/ZZz1.)>
II 2(B) 3 \1 1/FIGURE 9. Wake interaction mode 3, views I and II. The third mode is characterized by vortex FIGURE
merging. In view I the foil is at the bottom of the heave stroke. Foil vortex 2 has merged with cylinder stroke. vortex (B). Cylinder vortex C is located above the foil. View II shows that the merged vortex 2(B)
has moved into the wake. Vortex 3 is forming at the trailing edge of the foil, which is now at the vortex centreline and moving up. Cylinder vortex C is being swept back over the foil, and will eventually previou merge with vortex 3. Cylinder vortex D is as yet too far away to be affected by the suction of the foil. shows t'From tl
foil, to e
Starting with view I of figure 7, where the foil is at the bottom of its heave stroke, next ha] a strong vortex is seen forming off and still connected to the trailing edge, labelled as
foil vortex 3. Cylinder vortex C is seen slightly below and just upstream of vortex 3, shed b' and is interacting with it and the feeding layer. Cylinder vortex D is below the leading and II] edge of the foil. View II shows the situation at at an instant of time T later; the foil is It sh now at the centreline and moving up. The cylinder vortex C has interacted destructively foil vo: with vorticity shed by the foil (3) and is now well into the wake. Foil vortex 4 forms with o-now at the trailing edge, while cylinder vortex D is trapped below the trailing edge and Visuali is repositioned upwards. Also, the foil is about to encounter cylinder vortex E near its
leading edge. 3.1.3.
The sequence is continued in figure 8, which contains views III and IV. View III, The shows the foil at the top of its heave motion. Foil vortex 4 is clearly seen forming mode f behind the trailing edge; cylinder vortex D lies just above and upstream of vortex 4. mode -Cylinder vortex E is now above the leading edge of the foil and is partly obscured by may fo the shadow of the foil in the photograph. View IV shows the foil at the wake centreline, Viea on its way down. Vortex D (which has interacted with vorticity shed by the foil, marked stroke. as vortex 4) is well into the wake. Foil vortex 5 is in the process of formation, while the cyli cylinder vortex E is being repositioned by the foil suction. A street of vortices is the me observed downstream of the foil, which are marked by the number and letter of the trailing interacting foil and cylinder vortices, respectively. Hence the vortices marked 3(C) and C is sw
4(B) are the final result of interaction between oncoming cylinder vortices and vorticity D is as
Active vorticity control in a shear flow III 2(B) ( \ G I -IV A _ A- 7"I-3 (C) 4 E //
·
~~ ~'
vortex FIGURE 10. Wake interaction mode 3, views III and IV. View III shows the foil at the top of its heave ilinder stroke. Foil vortex 3 has grown in size and has merged with the cylinder vortex C. The combined x 2(B) vortex 3(C) is seen to lie roughly on the same straight line (parallel to the average flow) as the
at the previously merged vortex 2(B), which has opposite sign and is still visible downstream. View IV itually shows the foil at the centreline and moving down. The merged vortex 3(C) is well into the wake.
e foil. From the trailing edge, foil vortex 4 is just forming. Cylinder vortex D is being swept back below the foil, to eventually merge with vortex 4. Cylinder vortex E is as yet unaffected by the foil; during the [roke, next half-cycle it will be swept back to merge with the next foil vortex, and so on.
led as
tex 3, shed by the foil; they lie nearly on a straight line in the wake (this is clear in views I :ading and III), and form a reverse Kirmin street.
foil is It should be noted that for the case shown the interaction of cylinder vortices with :tively foil vorticity results in the ultimate formation of a reverse Kirman street of vortices forms with opposite rotational sign relative to the original participating cylinder vortices.
ge and Visualization was less clear for this mode than for the other two modes. ear its
3.1.3. Mode 3. Constructive interaction
w III, The third mode is characterized by vortex merging as shown in figures 9 and 10. This rming mode forms a street of single vortices of alternating strength, like mode 2, except that :tex 4. mode 3 results in much strengthened vortices. The vortices are also repositioned and red by may form a reverse or regular Karman street.
reline, View I (figure 9) illustrates the situation with the foil at the bottom of the heave larked stroke. Clearly visible in the wake is the foil vortex 2, which has already merged with while the cylinder vortex (B). Cylinder vortex C is located above the foil. View II shows that ices is the merged vortex 2(B) has moved downstream into the wake. Vortex 3 forms at the of the trailing edge of the foil, which is now at the centreline and moving up. Cylinder vortex 7) and C is swept back over the foil, and will eventually merge with vortex 3. Cylinder vortex
)rticity D is as yet too far to be affected by the suction of the foil.
F
:D
R. Gopalkrishnan and others
FIGURE 11. Larger view of wake for mode 1 downstream of the foil. Conditions as in figure 5. FIGUF
The sequence is continued in views III and IV of figure 10. View III shows the foil
at the top of its heave stroke. Foil vortex 3 has grown in size and has merged with the the fol Karm~ cylinder vortex C. The combined vortex 3(C) is seen to lie roughly on the same straight The line (parallel to the average flow) as the previously merged vortex 2(B), which has e opposite sign and is still visible downstream. View IV shows the foil at the centreline separa and moving down. The merged vortex 3(C) is well into the wake. From the trailing point edge, foil vortex 4 is just forming. Cylinder vortex D is swept back below the foil, to consid, eventually merge 'with vortex 4. Cylinder vortex E is as yet unaffected by the foil; t n
during the next half-cycle it will be swept back to merge with the next foil vortex, and figures
so
on.
~~~~~~~~~~~~~~~~~~~~~~~figures
so on.
3.2. Discussion of flow-visualization experiments
and a
and a, The flow-visualization experiments show that the oscillating foil can reposition the 2.
vortices, and reduce, or enhance their strength. Repositioning occurs primarily vortex. through the action of the foil suction, and can turn, for example, a regular Kirman 3 Ii
vortex street (with a wake-like average velocity profile) into a reverse Kirman street positio (with a jet-like average velocity profile). The process of repositioning can be best seen Of tlOf ti
in modes 2 and 3. once fnce f
In mode 1 (figure 11) the interaction of the vortex shed by the trailing end of the foil constrt with the vortices of the vortex street seems to follow the general lines of the 'vortex were ol dissolution' process (Aref & Siggia 1981; Aref 1983), as two vortices of opposite sign which join up and move outwards from the wake centreline. Also, a similarity can be noted characicharac
between mode 1 reported herein and the '2P' pattern found for certain parametric In th
combinations behind a circular cylinder forced to oscillate harmonically at large vorticevortice
amplitude (Williamson & Roshko 1988; Coutanceau & Defaye 1991), although the a vorte
formation process is totally different in these two cases. oncom Mode 3 seems to follow the mechanism of 'vortex-pairing' (Aref 1983), as two possibpossibi vortices wrap around each other and form a single structure. Mode 2 involves the circ repositioning of the cylinder vortices by the foil and interaction of a cylinder vortex foil ch
with vorticity of the opposite sign shed behind the trailing edge of the foil. The order t
detaching shear layer wraps around the oncoming cylinder vortex, as it is repositioned sufficie:
by the foil, ultimately resulting in the formation of one principal vortex per half cycle. equal t All modes are characterized by the fact that, simultaneously with vortex interaction, airfoil
significant repositioning of the cylinder vortices takes place, because of the suction of experin 14
Active vorticity control in a shear flow
FIGURE 12. Larger view of wake for mode 3, downstream of the foil. Conditions as in figure 9. the foil the foil. For example, figure 12 shows that in a mode 3 type of interaction, a reverse vith the Karmin street with small lateral spacing is formed downstream of the oscillating foil.
straight The principal parameter governing the pattern in the wake was found to be the
Lich has separation distance s (the separation ratio s/d), as shown in figure 4. The separation ntreline distance controls the horizontal position of cylinder vortices, relative to the foil pivot
trailing point, corresponding to a specific phase in the harmonic motion of the foil. By foil, to considering as reference phase the position of the foil with zero heave motion and as ;he foil; it is moving up (which corresponds to a maximum counterclockwise pitch angle in tex, and figures 5-10), we find that:
1. In mode 1 the foil attachment point lies midway horizontally between a clockwise and a counterclockwise cylinder vortex.
tion the 2. In mode 2 the foil attachment point lies underneath a counterclockwise cylinder ,rimarily vortex. This position is + 90° out of phase with respect to mode 1.
Kfrman 3. In mode 3 the foil attachment point lies above a clockwise cylinder vortex. This
in street position is -90 ° out of phase with respect to mode 1.
)est seen Of the three modes, vortex pairing was the most sensitive and difficult to reproduce; once formed, however, it produced the clearest images. The destructive and the
f the foil constructive interaction were both found to be robust and repeatable modes, but they
'vortex were obtained only for specific values of the separation distance. For parametric values >site sign which did not produce one of the three modal patterns just described, the flow was not
be noted characterized by any stable repeatable pattern.
Lrametric In the theoretical study of Dowling (1985), a stationary foil interacts with oncoming at large vortices near a wall. A single mode of controlled flow is found, where the passage of ough the a vortex near the foil causes the foil to shed vorticity, which reduces the strength of the oncoming vortices. The present study shows that using an oscillating foil offers new ), as two possibilities, such as weakening of the circulation (or even reversing), reinforcement of involves the circulation, and repositioning of the vortices. In Dowling (1985) it is found that the er vortex foil chord must have length comparable to the dimension of the oncoming vortex in foil. The order to be effective. In the present study it was also found that the foil must have ositioned sufficiently large chord to be effective. Two foils were tested, the first with chord length lalf cycle. equal to one cylinder diameter, and the second with chord twice as long. The shorter teraction, airfoil was found to be very ineffective in controlling the vortices, and all subsequent ;uction of experiments were conducted with the longer foil. This also led to the use of a similar
R. Gopalkrishnan and others
foil in the force measurement experiments described in the next section. The lateral
spacing of the vortices formed behind the cylinder, before they are altered by the foil, was found to be equal roughly to 2.2 cylinder diameters; hence on the basis of the present results, the foil chord must have a length comparable to the lateral distance
between cylinder vortices in order to be effective.
Figures 11 and 12 show a larger part of the wake for modes 1 and 3, respectively, and they serve to demonstrate the stability of the patterns described herein downstream
from the foil. Figure. 11 shows the pairing of vortices and resulting widening of the wake. Figure 12 shows the vortex street formed downstream of the foil, with the vortices repositioned to form a reverse Kairmin street with small lateral spacing. The vortices move from right to left, and one notes that the first (counter-clockwise) vortex, just ahead of the foil, has not been repositioned yet and for this reason is out of line
with respect to other vortices of the same sign which have moved downstream from the foil.
4. Force measurement experiments
The experiments were conducted at the MIT Ocean Engineering Testing Tank
Facility. The tank has dimensions 30 m x 2.6 m x 1.3 m, and is equipped with a
computer-controlled carriage rolling on an overhead rail, capable of speeds up to C 3m s-1.
The apparatus for these force measurement tests is an extension to apparatus used FIGURE previously for forced-oscillation tests conducted at this facility (Triantafyllou et al. and the
1991, 1993; Gopalkrishnan 1993), but with considerable increase in complexity. Figure apparal 13 illustrates this apparatus, which consisted of two inverted-U yokes each pivoted at througi its upper end to the carriage. The forward yoke carried the cylinder (D-section) model,
while the aft yoke carried the rotating foil model connected via a chain and pulley measu
arrangement to a digitally controlled SEIBERCo motor that provided the pitching pitchir oscillation. The aft yoke was similar to the apparatus used by Triantafyllou et al. (1991, HR 30( 1993). Each yoke could be rotated at the pivots and held in position at any angle; thus a resis
adjustments to the separation length ratio s/d were achieved by rotating both yokes data si through equal and opposite angles either inwards (towards each other) or outwards equip;
(away from each other). used tc
Vertical oscillations of the entire assembly were obtained with the use of a second, the cai
larger SEIBERCO H3430 Sensorimotor, and a LINTECH leadscrew table of total stroke Botl
length 17.8 cm. The base of the device was mounted vertically on the test tank carriage. respect
The motor was digitally controlled. 5004) i
The cylinder was made of wood with an external layer of glass/graphite fibre for the ca,
smoothness and strength, 5.08 cm in diameter, 60 cm in span, suspended from the yoke be as c
structure by means of stainless steel pins embedded in end plugs. Circular aluminium amplif end plates were fitted, with diameter equal to five times the cylinder diameter, mounted cable c to the lower ends of the yoke arms. One of the arms contained the force transducer. the coi
The foil tested has a NACA 0012 shape with zero camber, 10 cm chord and 60 cm span. analog The foil was made of wood, with an external layer of glass/graphite fibre to ensure DEVICE uniform smoothness. Circular aluminium end plates of the same size as those for the specific
cylinder were fitted to avoid three-dimensional end effects.
Seven quantities were measured: lift and drag forces on the cylinder, lift and drag
forces and torque on the foil, the heaving motion (identical for both models), and the The st
foil pitching motion. The spacing (separation length) between the cylinder and foil experii
models was adjustable. The lift and drag forces on the cylinder and foil models were 1 and:
L
17
Active vorticity control in a shear flow / w tank carriage screw assembly )ke e distance bar End plates Heave motion Force transducers
is used FIGURE 13. Experimental apparatus for force measurement. Two inverted-U yokes carry the cylinder
i et al. and the foil. One motor drives the heaving motion for both the cylinder and the foil (and attached Figure apparatus) through a lead-screw assembly, and a second motor drives the foil pitching motion oted at through a chain and pulleys.
model,
pulley measured with KISTLER 9117 transducers, while a KISTLER 9065 was used to measure the itching pitching torque on the foil. A Linear Variable Differential Transformer (LVDT) Model
.(1991, HR 3000, with a linear range of + 7.62 cm, was used to measure vertical motion, and
le; thus a resistance potentiometer was employed to measure the angle of rotation. The seven i yokes data signals were transmitted to the control room, filtered, and then sampled by a PC itwards equipped with an A/D converter. A second PC equipped with a D/A converter was used to provide the tracking signals for both the heave and pitch SEIBERCOS as well as
second, the carriage motion.
* stroke Both KISTLER transducers and the SCHAEVITZ LVDT were operated with their
arriage. respective dedicated signal conditioning devices, the charge amplifiers (KISTLER Model 5004) in the case of the force transducers, and a detector/amplifier model ATA 101 in
ibre for the case of the LVDT. These amplifiers were located on the test tank carriage, so as to
he yoke be as close as possible to the sensors. The high-level analogue voltages output from the
minium amplifiers were sent back to the laboratory control room, through the test tank data iounted cable connecting the control room to the carriage. From the data cable termination in Isducer. the control room, the signals were passed through a set of precision matched lowpass
mn span. analogue filters so as to prevent aliasing. The filters used were built from FREQUENCY lensure DEVICES 4-pole butterworth lowpass modules with a cutoff frequency of 100 Hz, and
for the specifically rigid tolerances on phase- and amplitude-matching. 4.1. Experimental results
ad drag
and the The same experimental grid as in table 1 was used for the force measurement
and foil experiments. Tests were performed at each amplitude and pitch combination of table
els were 1 and for 14 separation lengths. The separation lengths were chosen to cover at least
lateral le foil, of the stance :tively, stream of the ith the g. The vortex, of line om the ,Tank with a up to
18 '0.40 0.35 0.30 o 0.25 0.20 0).15 0.10
R. Gopalkrishnan and others
2 3 4 5 6 7 8 9 10
Spacing in cylinder diameters
FIGURE 14. Apparent foil efficiency as function of spacing between cylinder and foil. Ald = 0.833
and 0 = 45°.
an entire wavelength in the wake (distance from one cylinder vortex to the next of the same sign), estimated to be between 3.5 diameters (cylinder oscillating with large amplitude), and 5.0 cylinder diameters (non-oscillating cylinder).
From the test data, we extracted values of the cylinder mean drag Dmc, and the foil
thrust (or drag) ThF . In addition to the in-line force, we evaluated the average power
input to the foil, P,, given by:
PF=
LF,
d)+(QF'dt
dt dyt(O d(5)
where LF(t) is the lift force acting on the foil, QF(t) is the torque on the foil, and yF(t) and (t) are the measured heaving and pitching displacements, respectively. The notation <x, y> denotes the temporal average of the product of the signals x(t) and y(t). From the measured foil thrust force and input power, we calculated the apparent
efficiency IF of the foil, defined as:
/Fr- p , (6)
PP
where ThF is the average thrust force acting on the foil. We use the term apparent efficiency, because the actual flow velocity at the foil is not measured, and instead the free-stream velocity U has been used as a reference velocity.
The following conclusions were drawn after plotting the processed data:
1. The cylinder drag force Dmc did not vary appreciably from the tare value connected with the cylinder alone, nor did it vary much as a function of separation length.
2. The foil thrust force ThF was in every case considerably higher than the tare value with the foil alone. The thrust force showed considerable dependence on the spacing. 3. The apparent efficiency of the foil was a strong function of the spacing. This is one
of the principal findings of this part of the study.
A typical plot of the experimental results for the efficiency is shown in figure 14 for
the case of heave amplitude ratio Ac/d = AF/d = 0.833 and pitch angle amplitude
0 = 45° .The foil efficiency is plotted as a function of the separation distance between foil and cylinder, with all other parameters being kept constant. One first notes an average
downy the inc owing the pri about near tl the ph; the foi distan{ is not The re separa variati. and he oscillal visuali: place, distanc downs behavi attribu Kairm Sinc appara with tf efficien appear efficien occurr previol of the The Katzm Schmi( increas small s cross-s and th, fish, substai are she that sh Rosen to reco photog strongl domin, their o ... .... ... ... 41... ... 4 ... .. .i .. .... .. .... .. .. . . .. . . .. . . .. . . .. . . .. . . .. . . . .. . . . . . .. ... ... . . .. . . .. . . . .. .. .. .. .. .. ... .. . .. .. .. .. .. .. .. .. . .. .. .. .. .. .... .. . .. .. .. .. . .. .. .. . .. .. . .. .. .. .. .. . .. . .. . .. . .. . .. . . ... .. . .. . .. . . .. . .. . .. . . .. . .. . .. . .. . . .. . .. . .. . .. . . · · ·· · · ·: · · · ····... ... .. ... ..
Active vorticity control in a shearflow
downward trend in the efficiency as the separation length increases. This is caused by the increase in the average inflow velocity with increasing distance behind the cylinder, owing to the flattening of the average velocity defect. What is remarkable, however, is
the presence of distinct peaks in efficiency (one peak at about 4.3d, and another at about 7.3d)., as well as troughs (one trough at about 6d and two additional troughs
near the ends of the plotted line in figure 14). These peaks and troughs are caused by the phasing between the arrival of the cylinder vortices and the transverse position of the foil. The distance between peaks in efficiency is roughly equal to the longitudinal distance between vortices of the same sign, estimated at about 3.3 diameters (the value is not precise since the longitudinal vortex spacing varies slowly behind the cylinder).
4.2. Discussion of the force measurement experiments
The results of figure 14 show that the apparent foil efficiency depends strongly on the separation length between cylinder and foil. More specifically, figure 14 shows that the 0.833 variation of the efficiency of the foil with the separation length presents very clear peaks and hollows. The presence of peaks and hollows suggests that interactions between the oscillating foil and the vortices of the vortex street take place, as also observed in the of the visualization experiments at lower Reynolds numbers. If no such interactions took large place, then the efficiency of the foil would monotonically decrease with the separation
distance from the cylinder, as a result of the reduction of the average velocity defect he foil downstream of the cylinder. Instead, figure 14 shows that there is a marked peaking
behaviour superimposed on this average reduction. The second effect can only be
attributed to the interactions of the foil with the vortices from the upstream cylinder
Kirmin vortex street.
Since we did not perform flow visualization together with our force measurement apparatus, we cannot definitively correlate the variation in the efficiency of figure 14 with the visualization results discussed earlier. We note, however, that the peak in the
1 YF(t) efficiency occurred at a spacing of about 4.3 diameters, corresponding roughly with the
f. The appearance of mode 2 in the visualization tests (figure 4); while the trough in the
id y(t). efficiency occurred at a spacing of about 6 diameters, corresponding roughly with the parent occurrence of mode 3 in the K-tank visualization tests (figure 4). Also, as noted in the previous section, modes 2 and 3 differ by 180°, which corresponds to half a wavelength of the street, in agreement with figure 14 (one wavelength is estimated at 3.3 diameters). (6) The possibility for energy extraction from the flow was first pointed out by
Katzmayr (1922), who considered a stationary foil within an oscillatory flow. Then parent Schmidt (1965) implemented this by putting a stationary foil behind a flapping foil to 'ad the increase the overall efficiency. Rosen (1959) visualized the flow around and behind a small swimming fish (brachydanio albolineatus, 4.13 cm in length) in a small tank with cross-section 2.54 cm x 3.8 cm, using first a bottom layer of milk with 1.6 mm height, value and then dye around the fish. He showed that vortices form around the body of the tration fish, which are convected downstream with increasing strength and are altered
substantially when they interact with the oscillating caudal fin. Similar visualizations
z value are shown in Doi (1989). We suggest, on the basis of the results of the present study,
racing. that should these vortices along the fish body be formed, as in the visualizations of , is one Rosen (1959), fish employ a vorticity control scheme similar to mode 2 reported herein,
to recover some of the energy lost in forming these vortices. Indeed, multiple sequential 14 for photographs of fish swimming show the vortices formed around the body to interact plitude strongly with the flapping tail, resulting in the formation behind the fish of a single -en foil dominant vortex street with much weakened vortices, repositioned significantly from Lverage their original position to lie in a nearly straight line (Rosen 1959).
R. Gopalkrishnan and others
5. Conclusions Doi,
Visualization and force-measurement experiments were conducted to investigate the Dow] feasibility of free shear flow control and energy extraction from the large eddies in a 1
free shear flow. FFOW
Visualization experiments on a D-section cylinder, oscillating transversely as it is 3
forced to move forward at constant speed, and a heaving and pitching foil, placed FRE
behind the cylinder, demonstrated the feasibility of changing the flow through vorticity GOPA
control. The oncoming vortices of the Ktirmdn street were repositioned and their 1
strength was changed by the foil, resulting in new stable patterns downstream from the GoRE
foil. Three distinct modes were identified. Mode 1 results in the formation of a street t
of pairs of counter-rotating vortices, each pair consisting of a vortex from the Kirmain HEFNj street and one generated by the foil. Mode 2 results in the formation of a single vortex
street downstream from the foil, each vortex in the street being the result of HOER:
repositioning by the foil and interaction between a vortex from the Karman street with KATZ
vorticity of the opposite rotational sign shed by the trailing edge of the foil. The I
vortices downstream from the foil may have smaller or even opposite circulation, Kooc compared to the circulation of the cylinder vortices before they reach the foil. Mode s:
3 results in the formation of a single vortex street downstream from the foil, each MAT
vortex in the street being the result of merging of a vortex from the Kairmain street with I
a vortex of the same sign generated by the foil, hence having higher strength than the ONGO
original cylinder vortices. The lateral spacing for the vortex streets of modes 2 and 3 R
is changed substantially downstream from the foil, and all vortices were roughly lying ROSE}
on a straight line. The principal process in the formation of modes 1 and 3 resembles
the two-vortex interaction described in Aref (1983). A
Force-measuring experiments on a similar apparatus at larger scale and Reynolds SAVA§
number 20000 demonstrated that, by keeping the excitation conditions the same, but SCHM] varying the relative spacing between the cylinder and the foil so as to change the arrival 2
time of the cylinder vortices at the foil leading edge to coincide with different phases STRYK in the heaving and pitching motion of the foil, the average efficiency of the foil can be a
altered significantly, with substantial peaks and troughs present. We associate peaks in TOKUI
the efficiency, and hence energy extraction by the foil from the cylinder eddies, with the A.
appearance of mode 2 (destructive interaction); and efficiency troughs with mode 3 TRIAN
(constructive interaction). d,
TRIAN
The financial support of DARPA, the Office of Naval Research, under contracts ti N00014-92-J-1726, N00014-93-1-0857, and N00014-93-1-0932, and the Sea Grant WILLI.
Program under Grant Number NA90AA-D-SG424 is gratefully acknowledged. ZDJ
REFERENCES
AREF, H. 1983 Integrable, chaotic, and turbulent vortex motion in two dimensional flows. Ann. Rev.
Fluid Mech. 15, 345-389.
AREF, H. & SIGGIA, E. D. 1981 Evolution and breakdown of a vortex street in two-dimensional flows. J. Fluid ,ech. 109, 435-463.
CHEN, Y. Y. & TEMPLIN, J. T. 1974 Suppression of spatial waves by distortion of jet velocity profile.
Phys. Fluids 17 (11), 2124-2125.
CORKE, T. C., GUEZENNEC, Y. G. & NAGIB, H. M. 1979 Modification in drag of turbulent boundary layers resulting from manipulation of large-scale structures. In Proc. Viscous Drag Reduction
Symp. Dallas. AIAA Prog. Astro. Aero. 72, 128-143.
COUTANCEAU, M. & DEFAYE, J. R. 1991 Circular cylinder wake configurations: A flow visualization survey. Appl. Mech. Rev. 44, 255-305.
Active vorticity control in a shear flow
DoI, J. 1989 Agriculture. In Handbook of flow visualization (ed. W. J. Yang), pp. 629-631. Hemisphere.
ite the DOWLING, A. P. 1985 The effect of large-eddy breakup devices on oncoming vorticity. J. Fluid Mech.
s in a 160, 447-463.
FFoWCS WILLIAMS, J. E. & ZHAO, B. C. 1989 The active control of vortex shedding. J. Fluids Struct.
is it is 3, 115-122.
placed FREYMUTH, P. 1990 Thrust generation by an airfoil in hover modes. Exps Fluids 9, 17-24. )rticity GOPALKRISHNAN, R. 1993 Vortex-induced forces on oscillating bluff cylinders. PhD thesis,
1 their Massachusetts Institute of Technology, Cambridge, MA.
om the GORMAN, M. & SWINNEY, H. C. 1982 Spatial and temporal characteristics of modulated waves in street the circular Couette system. J. Fluid Mech. 117, 117-123.
HEFNER, J. N., WEINSTEIN, L. M. & BUSHNELL, D. M. 1979 Large-eddy break-up scheme for -artman turbulent viscous drag reduction. In Proc. Viscous Drag Reduction Symp. Dallas. AIAA Prog.
vortex Astro. Aero. 72, 110-127.
3ult of HOERNER, S. F. 1965 Fluid Dynamic Drag. Published by the author.
et with KATZMAYR, R. 1922 Effect of periodic changes of angle of attack on behavior of airfoils. NACA
il. The TM-147.
ilation, KOOCHESFAHANI, M. M. & DIMOTAKIS, P. E. 1988 A cancellation experiment in a forced turbulent
.Mode shear layer. AIAA 88-3713-CP.
ii, each MATISSE, P. & GORMAN, M. 1984 Neutrally buoyant anisotropic particles for flow visualization. Phys. :et with Fluids 27 (4), 759-760.
han the ONGOREN, A. & ROCKWELL, D. 1988 Flow structure form of an oscillating cylinder. Part 1. 2and 3e Mechanisms of phase shift and recovery in the near wake. J. Fluid Mech. 191, 197-223. y2 and 3 ROSEN, M. W. 1959 Water flow about a swimming fish. Stat. Tech. Publ. US Naval Ordn. Test ly lying Station, California, NOTS TP 2298.
;embles RoussoPouLos, K. 1993 Feedback control of vortex shedding at low Reynolds numbers. J. Fluid
Mech. 248, 267-296.
eynolds SAVA§, 0. 1985 On flow visualization using reflecting flakes. J. Fluid Mech. 152, 235-248.
me, but SCHMIDT, W. 1965 Der wellpropeller, ein neuer antrieb fur wasser-, land- und luftfahrzeuge. arrival .Flugwiss. 13, 472-479.
phases STRYKoWSKI, P. J. & SREENIVASAN, K. R. 1990 On the formation and suppression of vortex shedding I can be at low Reynolds numbers. J. Fluid Mech. 218, 71-107.
eaks in TOKUMARU, P. T. & DIMOTAKIS, P. E. 1991 Rotary oscillation control of a cylinder wake. J. Fluid
with the Mech. 224, 77-90.
mode 3 TRIANTAFYLLOU, G. S., TRIANTAFYLLOU, M. S. & GROSENBAUGH, M. A. 1993 Optimal thrust development in oscillating foils with application to fish propulsion. J. Fluids Struct. 7, 205-224. TRIANTAFYLLOU, M. S., TRIANTAFYLLOU, G. S. & GOPALKRISHNAN, R. 1991 Wake mechanics for ontracts thrust generation in oscillating foils. Phys. Fluids A 3 (12), 2835-2837.
WILLIAMSON, C. H. K. & ROSHKO, A. 1988 Vortex formation in the wake of an oscillating cylinder.
i. Grant J. Fluids Struct. 2, 155-381.
ed. ZDRAVKOVICH, M. M. 1981 Review and classification of various aerodynamic and hydrodynamic means for suppressing vortex shedding. J. Wind Engng Indust. Aero. 7, 145-189.
Ann. Rev. nensional ity profile. boundary Reduction ;ualization 21