Addressing Equipment Set-up Time and Manufacturing Cost Through Real Time Inline Inspection in Tantalum Wire Manufacturing
by
Carlos A. Gonzilez
B. S. Metallurgical Engineering, University of Idaho (1996)
M. S. Materials Science and Engineering, University of California -Berkeley (1998) Submitted to the Department of Mechanical Engineering and the Sloan School of
Management in Partial Fulfillment of the Requirements for the Degrees of
Master of Science in Mechanical Engineering, and Master of Business Administration
In Conjunction with the Leaders for Manufacturing Program at the Massachusetts Institute of Technology
June 2004
@2004 Massachusetts Institute of Technology. All rights reserved.
Signature of Author
D art nt of_ Achanical Engineering Sloan School of Management
May 7th 2004 Certified by
C eb Roy Welsch, Thesis Supervisor Professor of Statistics and Management Science
Certified by
Thomas W. Eagar, yesis Supervisor -Professor of Materials Engineering
Certified by
David Hardt, Thesis Reader Professor of Mechanical Engineering
Accepted by
Margaret Andrews, Executive Director of Masters Program chool of Management
Accepted by
Ain Sonin, Chairman, Graduate Committee
' ETTS RTUEA1 Department of Mechanical Engineering
OF TECHNOLOGY
Addressing Equipment Set-up Time and Manufacturing Cost Through Real Time Inline Inspection in Tantalum Wire Manufacturing
by
Carlos A. Gonzalez
Submitted to the Sloan School of Management and the Department of Mechanical Engineering in Partial Fulfillment of the Requirements for the Degrees of
Master of Business Administration and
Master of Science in Mechanical Engineering
Abstract
For this study, a novel wire inspection system was developed to detect surface defects and monitor diameter real-time during the final wire drawing operation. Throughout his work, it was proven that the new inspection system was able to catch common wire defects under manufacturing conditions (wire speed). Furthermore, defect density limits were defined based on data collected during this study. A production version of the wire inspection system was jointly developed with the equipment supplier and an order was placed for three complete systems to be installed in all final draw machines.
Increased competition and poor economic conditions forced the manufacturer to place an unprecedented focus on decreasing manufacturing costs. The wire inspection system reported in this thesis was developed with the objective of increasing productivity at the most critical operation in the factory; final wire drawing.
Thesis Advisors:
Thomas W. Eagar, Thomas Lord Professor of Materials Engineering & Eng. Systems Roy Welsch, Professor of Statistics & Mgmt Science, Dir CCREMS
Acknowledgements
First, I would like to thank H. C. Starck Inc. for sponsoring this project and making this thesis possible. I particularly want to thank the following people of the wire department who went out of their way to help me and made me feel part of the team: Chris, Christian, Karl, BJ, Joan, and Susan. The success of this project and its timely completion are very much due to the complete support and guidance given to me by my company supervisors: Bob Balliett and Tony Parise.
I would like to thank the Leaders for Manufacturing program for giving me the
opportunity to go though this unique experience. This experience has opened my eyes to a bigger universe of issues, opportunities, and responsibilities. I am particularly thankful that I had the chance to interact with Bill Hanson, whose wisdom made me explore new possibilities and taught me through example what it takes to be a great leader.
I would like to thank my thesis advisors, Professors Thomas W. Eagar, and Roy Welsch. I would like to thank both, Professor Welsch, and Eagar, for their effort and time to make this project a success.
Finally, thanks to my wife Maria Andreina for sacrificing so much so I could have this opportunity. Also, I have to thank to my beautiful children, Andrea and Cristobal for putting-up with changing schools and having to make new friends twice in two years so their dad could have this incredible experience.
To my grandfather Cristobal Gonzilez, he has been, and will always be, an inspiring force in my life. He passed away the day before my midstream presentation on January 29th. The happiest person I ever met, worked with his hands all his life doing automotive upholstery work. I hope he knew how much I admired him, and how his example has guided me.
Table of Contents
A b stract ... 2
A cknow ledgem ents ... 3
T able of C ontents ... 4
L ist of Figures ... 6
Chapter 1: Introduction 1.1 T hesis O bjective ... 9
1.2 Problem Statem ent ... 9
1.3 T hesis O verview ... 10
Chapter 2: Background 2.1 T antalum ... 11
2.2 T antalum B usiness ... 12
2.2.1 Tantalum Processing Companies -Competitors ... 13
2.2.2 Tantalum Capacitors ... 14
2.2.3 Capacitor Manufacturers ... 14
2.3 Company Overview 2.3.1 H. C. Stark Company History ... 15
2.3.2 Organization of the Company ... 16
2.3.3 The Wire Department ... 17
2.3.4 Current Business Environment ... 17
Chapter 3: Analysis 3.1. Tantalum Wire Process ... 20
3.2. Current wire manufacturing process ... 21
3.3. New wire manufacturing process... 23
3.4. Wire Inspection 3.4.1. Current wire inspection at final draw... 25
3.4.2. The need for real-time continuous inspection ... 26
3.4.5. Infra-red sensor description ... ... 30
3.4.6. Evaluation of IR detector ... 31
3.4.7. Surface defect detector repeatability experiment ... 31
3.4.8. A definition of surface quality ... 33
3.4.9. Production wire inspection system ... 42
Chapter 4: Analysis of the organization ... 45
Chapter 5: Conclusions ... 48
R eferences ... 49
A ppendix 2-A ... 50
A ppendix 3-A ... 52
List of Figures
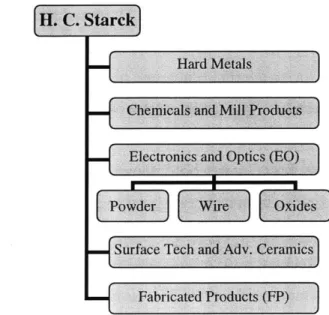
Figure 2.1. H. C. Starck business units.
Figure 2.2. Tantalum capacitor sales in the NAFTA region fro the period 1998 to 2003 Figure 2.3. Wire sales volumes for H. C. Starck
Figure 3.1. Current Wire Process Flow Figure 3.2. New Wire Process Flow
Table 3.1. Basic requirements for real-time inline wire inspection system Figure 3.3. DSS functional flow diagram.
Figure 3.4. IR sensor flaw detection schematic.
Figure 3.5. Wire speed for repeatability experiment. Run numbers correspond to the run numbers in Figures 3.6, and 3.7.
Figure 3.6. White mark repeatability experiment data.
Figure 3.7. Repeatability data collected around the 150 ft mark. Figure 3.8. Average defect density for all production spools tested.
Figure 3.9. Cumulative defect density by length of wire for representative good, bad, and questionable spools.
Figure 3.10 Defect density, data aggregated into number of defects per 100 ft segment Figure 3.11. Moving average control charts for typical production lots.
Figure 3.12. Moving average control chart and control limits for worst acceptable production lot (acceptable lot with the highest defect density).
Figure 3.13-a. Moving average control chart of rejected lot. Figure 3.13-b. Moving average control chart of rejected lot. Figure 3.13-c. Moving average control chart of rejected lot.
Figure 3.14. Correlation was found between the infra-red wire surface inspection system and the visual inspection currently used at the final draw operation.
Figure 3.15. Surface defect screening process flow with the production version of the software.
Chapter 1: Introduction 1.1 Thesis Objective
The objective of the work described in this thesis was to decrease manufacturing cost by lowering labor content at the wire manufacturing facility of H. C. Starck Inc. (a wholly owned subsidiary of Bayer AG) in Newton, Massachusetts. Specifically, the desired productivity increase was to be achieved by developing an inline wire inspection system (surface defects and diameter). This work is the product of collaboration between H. C. Starck and the Leaders for Manufacturing program at MIT. The data presented in this thesis was collected in the wire manufacturing facility of H. C. Starck in Newton Massachusetts.
1.2 Problem Statement
The factory studied for this work is organized as a batch and queue system. Also, The equipment traditionally used for wire making such as rod rollers, wire mills, and wire drawing machines involve long set-up times. Two simple ways of increasing productivity would be to either optimize the process, to decrease set-up time, or increase batch sizes to avoid set-ups. Best manufacturing practices today would suggest the first option; reduced machine set-up times to further reduce batch sizes (Womack & Jones, 2003). In this case the management of the company had already made significant investments to enable
larger batches.
It was determined that an in-line real-time wire inspection system needed to be developed to enable processing of significantly larger batches at the last wire drawing operation. Currently, the 20 pound spools of wire are inspected at the beginning, middle and end (every 10 pounds) to ensure good quality. The wire inspection consists of a diameter
check done in a laser micrometer, and a subjective surface quality check done at a
stereomicroscope at 40X. The inspection process is done offline and the machine needs to be stopped. In a 500 pound spool, this inspection frequency would defeat the purpose of
larger batches. An inline real time inspection system would allow the process to run for the entire 500 pounds of wire (25 of the old batches) with no interruption, and minimal labor content.
1.3 Thesis Overview
The scope of the thesis project was to select and test a wire inspection system,
demonstrate its repeatability, and define an optimum production wire-quality monitoring system for installation on final draw machines. The relevant background information on Tantalum, the tantalum industry, and H. C. Stack is presented in Chapter 2. The data collected to prove that the new inline system met the requirements along with the appropriate analysis is presented in chapter 3. The requirements and final design of the production version of the inspection system is discussed at the end of chapter 3. Chapter 4 is an analysis of the organization and recommendations on how to improve it. The conclusions of this work are presented in chapter 5.
Chapter 2: Background 2.1 Tantalum
Tantalum is a rare metal, gray in color, malleable, ductile, behaves mechanically similar to steel, has a very high melting point (2,996 'C), and has a resistance to corrosion superior to Titanium. These unique physical properties and high cost define its uses.
Tantalum was discovered in 1802 by Anders Gustav Ekeberg of Sweden using an ore sample from Kimito, Finland. He named the newly discovered element after King Tantalus of Phrygia, from Greek mythology, who was condemned to eternal frustration by standing up to his neck in water that receded when he tried to drink it. Ekeberg shared King's Tantalus frustration when he tried to isolate tantalum (Hunziker, 2002).
Tantalum has many uses due to its particular physical properties. Its oxide exhibits exceptional dielectric properties such as very high volumetric efficiency and reliability. Tantalum's corrosion-resistant character, similar to glass, is ideal for chemical
processing, and makes it one of the best materials for body implants. Tantalum improves the refractive index of lenses to make them thinner, and it provides X-rays with a brighter image, while reducing the radiation dosage to the patient (Hunziker, 2002).
Between 1999 and 2001, illegal tantalum mining in the Kahuzi-Biega National Park partially financed the civil war in the Congo. In response to the crisis in the Congo, the U.S. House of Representatives passed a resolution in September 2001 that banned the purchase of tantalum from the Congo. Tantalum's price skyrocketed to over $500! pound, an increase of ten-fold within several months, in the face of distorted news stories about shortages. Slogans, like "Blood Tantalum" and "No Blood on my Mobile," became haunting symbols of the scramble for tantalum among major corporations that locked in astronomically high contract prices for future delivery of the rare metal from legitimate sources. In June 2003, The UN Security Council issued a statement on the "Illegal exploitation of natural resources and others forms of wealth of the Democratic Republic of the Congo." In that statement, the panel of experts recorded the reactions of
individuals, corporations and countries involved in the tantalum business. H. C. Starck Inc. response is shown in appendix 2-A.
2.2 Tantalum Business
The business challenges faced by a tantalum wire producer are better understood once one is aware of the whole tantalum value chain. Tantalum starts off in the earth as a mineral; tantalite, microlite, and wodgilite primarily. However, it is common practice to use the name tantalite for the tantalum mineral (Tantalum-Niobium International Study Center website). Tantalum is usually bound to Oxygen forming a tantalum oxide. Sons of Gwalia Ltd., in Western Australia operates the single largest source of Tantalum.
Tantalite is also mined in Canada, Ethiopia, China, and Brazil. The central African countries of Democratic Republic of Congo, and Rwanda used to be source of significant tonnages.
Tantalite is mined, and it goes through the common beneficiation processes to separate the tantalite mineral from all the other minerals that together made the specific rock formation mined. After the tantalite is separated, it is sold to a specialty materials company such as H. C. Starck Inc., which will "upgrade" the mineral. For example, tantalum is separated from niobium by reacting the ores with a mixture of hydrofluoric and sulfuric acids at high temperatures. Tantalum is then recovered as either potassium tantalum fluoride (K2TaF7), or tantalum oxide (Ta205), and niobium is recovered as niobium oxide (Nb205).
Because of tantalum's high melting temperature and high affinity for oxygen, a number of tantalum metal products are produced through powder metallurgy methods. Tantalum powder is usually produced by reducing potassium-tantalum-fluoride with sodium in a molten salt system at high temperature. Tantalum powder is sintered (consolidated) into bars to produce wire. A significant portion of the tantalum produced, about 60%
(Tantalum-Niobium International Study Center website), is sold as capacitor grade powder. More than 90% of the tantalum wire produced is used for capacitor anodes.
feedstock; comprised of powder or high purity scrap where the elements with boiling points greater than tantalum are not present. Double and triple melt ingots achieve a very high level of purification.
2.2.1 Tantalum Processing Companies - Competitors
H. C. Starck's main competitors in the Tantalum business are Cabot Performance
Materials, and Ningxia Non-Ferrous Metals. Together with H. C. Starck Inc. they are the top players in the Tantalum business. Below is a short description of these two key competitors in the Tantalum powder and wire business (Commerce Resource Corporation. http://www.commerceresources.com).
a. Cabot Performance Materials, http://www.cabot-corp.com. In 1978 Cabot
acquired a tantalum processing facility in Boyertown, Pennsylvania. Cabot has an interest in a number of raw materials suppliers (producers of concentrate). This includes an equity investment in Sons of Gwalia, as well as the Tanco Mine. Cabot Corp. is a publicly traded company whose shares trade on the NYSE under the symbol CBT.
* Showa Cabot Supermetals produces capacitor grade tantalum powder by the sodium reduction of imported potassium flourotantalate at its plant in Kawahigashi-Machi, Kawanuma-Gun, Fukushima Prefecture in Japan. The plant produces Ta powder, Ta tubes rods and sheets. The company also acts as an agent for the marketing of imported tantalum products from Cabot Performance Materials (USA).
b. Ningxia Non-Ferrous Metals, http://www.nniec.com. Ningxia is the third largest tantalum processor. They have strong ties with one of the key tantalum capacitor manufacturers; Vishay Intertechnology. Ningxia is headquartered in the People's Republic of China and has operated for many years as a low cost producer. Tantalum powder and tantalum wire are the main products offered by Ningxia.
2.2.2 Tantalum Capacitors
Tantalum wire, along with Tantalum powder are the 2 main components of tantalum capacitors. The tantalum powder is mixed with a binder material and pressed around a small piece of tantalum wire to make a "slug." Then, the binder material is driven off by vacuum at about 1500 C. This is followed by sintering at high temperature (15000
C-2000 C) under vacuum. A very dense and high surface area tantalum anode is created. The next step is anodization, which would create a thin tantalum penta-oxide layer on the sintered powder structure. The cathode plate is produced next. This is achieved by
pyrolysis of manganese nitrite into manganese dioxide. The "slug" is dipped into a manganese nitrate solution and then baked in an oven at approximately 250' C to
produce the manganese dioxide layer. Usually several external contact layers are applied; a graphite layer, a silver coating, and a silver-loaded epoxy layer. The anode and cathode wires are dipped in solder, and finally the assembly is dipped in an epoxy resin leaving exposed the anode and cathode terminations (John Gill, AVX Ltd.).
2.2.3 Capacitor Manufacturers (Commerce Resource Corporation. http://www.commerceresources.com)
Company Name Description Website
AVX Tantalum AVX makes the world's smallest tantalum capacitor. It http://www.avxcorp.com Corporation is controlled by Kyocera.
Kemet Electronics Kemet specializes in solid tantalum and multi-layer http://www.kemet.com Corp. ceramic capacitors. The company began publicly
trading its shares in 1992, and is the largest manufacturer of solid tantalum capacitors.
NEC Corp. NEC's tantalum capacitors provide advanced http://www.necel.com technological design and performance characteristics
such as filtering, bypassing, decoupling, blocking and RC timing circuits for industrial, entertainment and medical electronics use.
Vishay Vishay makes most of the small components necessary http://www.vishay.com Intertechnology to build a typical mobile phone. Its components are in
many products including wireless devices and military products.
2.3 H. C. Stark Inc. Company Overview
2.3.1 Company History (From Gregory S. Chalker thesis)
The National Research Corporation (NRC) was founded in 1940 by Richard Morse and William Coolidge in Cambridge, Massachusetts. Their mission was the commercial
development of the use of vacuum as a process tool. Some of their early products included vacuum arc melted superalloys, lens coatings, and frozen orange juice
concentrate (later bought by Minute Maid, now owned by the Coca-Cola Company). The current H. C. Starck Inc. operates this very facility today, however, the building was
actually sold in the 1970s, but bought back in 1997 by H.C. Starck Inc. NRC began developing processes to arc melt titanium, due to its use in the chemical industry, but titanium reacts heavily with nitrogen and oxygen, and the desired purity levels were hard to reach. Thus, NRC began searching for different methods to create higher purity titanium. They developed a sodium reduction process to produce titanium (on contract with the U.S. Government) in a pilot plant in Newton, MA.
Eventually, this plant was used for the production of tantalum by sodium reduction of K2TaF7 and became the core of present day Plant 2. NRC became interested in reduction processes to produce both tantalum and niobium. Niobium was predicted to be heavily used in the defense industry, and the Department of Defense invested significant funds into projects aimed at developing this process. Many large companies, such as DuPont, Union Carbide, and CIBA (in Switzerland) invested heavily in niobium production facilities. The market for tantalum was never considered big enough to interest them. The Department of Defense project failed eventually, which left a large surplus of niobium capacity (most of which was later closed). NRC decided to enter the tantalum market in
1957, and established a small sodium reduction plant to produce tantalum powder at 70 Memorial Drive in Cambridge, Massachusetts (current site of building E51 at the
Massachusetts Institute of Technology). A melt shop for the arc melting of tantalum ingot was also established at this location. In 1958, NRC introduced a capacitor grade tantalum powder which sold rapidly; therefore a full-scale production facility was developed at the former titanium pilot plant in Newton, MA. The Norton Company in Worcester,
divisions were built and later expanded in the 1970s. Meanwhile, the Norton Company sold its Metals Division to a 50/50 partnership between H.C. Starck GmbH & Co.
(Goslar, Germany) and Samincorp, Inc. The new company was called NRC, Inc. The new name, NRC, no longer stood for National Research Corporation, however, because the rights to that name had been sold to Cabot Corp. (now H.C. Starck's biggest competitor) earlier. In the 1980s, H.C. Starck was purchased by Bayer AG (Germany), and NRC became a wholly owned subsidiary of H.C. Starck. The metallurgical processing
operations were significantly improved by the addition of an electron beam furnace, a rolling mill, and the world's first commercial plasma arc furnace. In the 1990s, NRC, Inc. changed its name to H.C. Starck Inc., which is located in Newton, Massachusetts (a wholly owned subsidiary of Bayer AG) (timeline above mostly from Fincham, 1998).
2.3.2 Organization of the Company
H.C. Starck is organized into departments aligned with the industry and customers they serve; hard metals, chemicals and mill products, electronics and optics (EO), surface technology and advanced ceramics, and fabricated products (Figure 2.1).
Two of these business units operate at the Newton site; Electronics and Optics (EO) and Fabricated Parts (FP). There is also a Site Services group in Newton that consists of all the service functions at the plant such as human resources, accounting, maintenance and engineering, quality control and safety. The EO group is primarily responsible for the production of tantalum powder, and tantalum wire. The FP group is primarily responsible for the production of fabricated tantalum parts such as alloy additives and sputtering targets.
2.3.3 The Wire Department
The wire department reports to the EO group in Newton. The wire department owns research and development as well as production of Tantalum, and Niobium wire. The Newton wire factory is the only wire manufacturing facility at H. C. Starck. Therefore it produces wire sold in North America, Europe and Asia. More that 90% of the Tantalum wire produced is sold to the capacitor manufacturers; a small quantity is sold to medical implants companies.
The wire department is operated and managed by a very small group of people. Recent company-wide layoffs reduced total headcount by about 50%. The factory runs 3 shifts Monday through Friday, and 2 shifts Saturday and Sunday.
2.3.4 Current Business Environment
The Tantalum business is experiencing a "slow recovery." The Tantalum capacitor market, along with the rest of the electronics industry collapsed at the beginning of 2001. Figure 2.2 shows Tantalum capacitor sales in the NAFTA region for the period 1998 to 2003 (H. C. Starck internal report. March 2003).
500 450 400 350 300 250 200 150 100 5 0 . . . . . . . . . . . . . . . . . . .. M-M-J- S- N-J-M-M-J- S- N-J-M-M-J- S- N-J-M-M-J- S- M-J- S- N-J-M-98989898989999999999990000 0000 00 000101010101010202020202020303
Figure 2.2. Tantalum capacitor sales in the NAFTA region fro the period 1998 to 2003
The wire part of the business has been the first to "wake-up." The wire department has lead profitability for the site for the last 3 quarters in a row, while many other
departments are loosing money. Figure 2.3 shows the recovery in wire sales volume. 2003 was already an improvement in wire sales, and 2004 seems to be trending in the same direction, all of this is good news for the wire department and H. C. Stark Inc. as a whole. 140, 120, 100 - 80- 60- 40-20 S 1999 |2000 12001 12002 2003B |2003F
The other effect of the market collapse of 2001 was a price war not seen before in the industry. Unfortunately this effect will probably not fade away. Average tantalum wire selling price has been going down consistently since 2000, and it is predicted to keep going down in the following years. This creates a tremendous pressure on wire producers to reduce cost in a way that they had not experienced before. The work in this thesis reflects one of the actions taken by the wire department to become more competitive. The main effect of the in-line inspection system develop during this work will be to reduce labor cost and increase machine utilization. The secondary effect is to give H. C. Stark a technical advantage in characterizing the wire produced to differentiate their product based on certified wire quality.
Chapter 3: Analysis
3.1. Tantalum Wire Process
Tantalum wire is produced by "stretching" a tantalum bar though subsequent rolling and drawing operations. Annealing is needed several times through the process to relieve stresses generated by the significant deformation that goes on during rolling and drawing (accumulation of dislocations in the lattice), and restore Tantalum's ductility. A process unique to Tantalum and perhaps unique to H. C. Starck is the deposition of a thin oxide layer on the surface of the wire to help the material flow through the rolling and drawing dies. Tantalum is a very malleable metal, which helps in the wire making process. It means that it can undergo significant deformation without cracking and/or breaking. On the other hand, Tantalum is a very reactive metal as well, therefore, it would react with almost any surface with which it becomes in contact. This is particularly challenging for the drawing operation where the Tantalum coil/wire is pulled through a small aperture of a tungsten carbide die. If no precautions are taken, such as coating the tantalum wire with an oxide layer, the Tantalum would react with the die material and quickly "gum-up" the die leading to a wire break.
At H. C. Starck the starting bar is 1 inches in diameter and about 28 inches long and weights 20 pounds. The processes used to convert this bar into capacitor grade tantalum
wire are shown below in Figure 3.1, and described in the text below.
A E6.:MC OA LEAN & ETCH ATCH ANNEAL C XDZ
6 o 14NlPI 9 103
CL EAN
& EUCH RATCH ANNEAL r cBATrCH
1stINALDRA 4 F-6STRE E E
H
E3.2. Current Wire Manufacturing Process
The processes currently used to make Tantalum wire at H. C. Starck involve the following process-steps (The process steps correspond to the numbers on each process
shown in Figure 3.1.):
1. Point: The two ends of the bar are "pointed" (reduction in diameter) to prevent cracks during the following rolling operation.
2. Rod Roll: The first rolling operation takes the bar from 1 inches in diameter down to 0.42 inches in diameter. This operation produces a square bar due to the shape of the rollers. Due to adiabatic heating this first rolling step is paused half-way through to let the bar cool down so it is safe to be handled by the operator. 3. Coil: The resulting bar is formed into a coil. The purpose of this operation is to
maximize the throughput of the cleaning, oxidizing baths as well as the annealing furnace.
4. Clean and Etch: The coils are cleaned to remove the lubricant used during rolling as well as any dirt from the surface of the coil. The surface of the wire is etched away in a chemical bath to remove contaminants and leave a fresh Tantalum surface.
5. Batch Anneal: The coils are then annealed at a very high temperature to relieve the stresses built up during rolling.
6. Rolling 2: This second rolling operations takes the coil and further reduces its diameter in 3 passes. The coil has still a square cross section after this operation. This mill has 3 sets of groves that are aligned for each pass, stretching the wire to smaller and smaller diameter.
7. Rolling 3: The final rolling operation takes the coil down to 0.103 inches in diameter and gives it a semi-round cross section in a single pass.
8. Clean and Etch: The coils are cleaned to remove the lubricant used during rolling as well as any dirt from the surface of the coil. The surface of the wire is etched away in a chemical bath to remove contaminants and leave a fresh Tantalum surface.
9. Batch Anneal: The coils are then annealed at a very high temperature to relieve the stresses built up during rolling.
10. Batch Oxidize: In order for Tantalum to be drawn (pulled through a small orifice) a smooth homogeneous coating is needed. At H. C. Starck, a process was
developed to grow a thin Tantalum oxide layer on the surface of the wire to accomplish this. An oxide layer is grown by exposing the coils to oxygen at high temperatures. Both temperature and time are carefully controlled to produce the right type and thickness of oxide on the surface.
11. Coarse Drawing: A wire drawing machine is used to pull the coil through a series of dies with increasingly smaller apertures. These drawing machines are typically used in every standard wire making operation such as copper, or aluminum wire. 12. Clean and Etch: The coils are cleaned to remove the lubricant used during rolling
as well as any dirt from the surface of the coil. The surface of the wire is etched away in a chemical bath to remove contaminants and leave a fresh Tantalum surface.
13. Batch Anneal: The coils are then annealed at a very high temperature to relieve the stresses built up during rolling.
14. Oxidize: To grow a thin Tantalum oxide layer on the surface of the wire.
15. Final Draw: Final draw is mechanically and conceptually the same process as
coarse draw, but the wire is taken to its final diameter. It is the most critical process step because: it determines the mechanical properties of the final product (elongation, and tensile strength), and is the only process where defects in the wire would not be erased by the next operation.
16. Strand Anneal: Annealing after final draw is necessary to achieve high elongation and ductility required by some customers. Therefore, some of the wire goes through an annealing process in which a single strand of wire is passed through a vertical heating element under inert atmosphere at very, very high temperatures. The temperature needs to be even higher than in the batch annealing process because of the short time the wire spends in the hot zone.
17. Spooling: Here the finished wire, with the right diameter and mechanical properties is re-spooled into smaller quantities, and specific spool geometries depending on the customer.
18. Inspection: Diameter, chemical composition, mechanical properties, and current surface leakage are checked on a sample of every shipment of wire.
19. Package: Each spool of wire is wrapped, bagged, and put into a box to protect the wire during travel.
3.3. New Wire Manufacturing Process
After glancing at the process flow in Figure 3.1, it is easy to recognize that set-up time is a big portion of the effort put into making wire. Each 20 pound bar, coil, or spool is processed individually though each operation. The wire department team set out to reduce set-up time by increasing batch size 25 times (to 500 pounds per spool), therefore avoiding 24 set-ups. Also, the main focus of the engineers was to combine several process steps into a single operation. A large scale rolling mill was purchased and upgraded to be able take the coil from the first rod rolling pass (step #6), and reduce its diameter down to where it can be fed into the final draw machines (step #11 completed). Not only that, but the new mill also includes an inline annealing and oxidizing process. Then, the output of the new mill will be ready to go directly to final draw. The change from the old to the new process is shown in Figure 3.2. Part of the implementation of the new rolling mill (Buhler mill), is the transition to 500 pound spools from the 20 pound spools currently used. This would allow the Buhler mill to run uninterrupted for a longer time, by significantly reducing the average set-up time per pound of wire produced.
At this point, it must be noted that increasing productivity by increasing batch size and increasing the complexity of the equipment is a dangerous proposition. Increasing batch size makes it more difficult to react to fluctuating demand and makes product
diversification more challenging. Also, although set-up time per pound of material would likely decrease, the time needed to start a new batch would significantly increase. Then, manufacturing to customer's orders would take longer and safety nets such as inventory might need to be put in place (Womack & Jones, 2003). Production has to increase or decrease in 500 pound increments instead of 20 pounds increments.
Conversations with the factory engineers, managers, and technicians, revealed two things: that this is a unique factory, and that some of the negative consequences of large batches were considered when making this decision. From the point of view of the new Buhler mill, this factory makes a small number of Tantalum wire products. Final wire diameter is defined afterwards at final draw. Temper on the other hand, is defined by the total reduction during final draw. Therefore the diameter of the wire coming out of the Buhler mill largely determines the temper of the final product. The current plan calls for 500 pound spools also used in final draw which would have a real impact on the factory's flexibility, because at this point you are committing 500 pounds of material to a single diameter and probably temper combination. Another fact that makes larger batch sizes less of an issue is that customer orders are usually 1000 pounds or more.
The Buhler mill and the conversion to 500 pounds spools might have a positive impact locally at the wire factory. Productivity measured within the factory, such as pounds of wire produced per hour, or pounds of wire produced per unit of labor are likely to
increase significantly. On the other hand, inventory levels are also likely to increase since any work in progress for each product in the factory is at least 500 pounds, and buffer between machines has to be in 500 pounds increments.
FMacbigre
R3 PointeN A ProcessMLF
(T ) ~~~EMI ROUND TO I0 A TH BTH NEL BTHODZ
O5IAL DRAW SOLN
CLETAND& NEAL
3.4. Wire Inspection
3.4.1. Current Wire Inspection at the Final Drawing Operation During final draw (step 15 in Figure 3.2), the wire is inspected for surface defects, diameter and mechanical properties. Each working spool (20 pounds) is inspected
visually for surface quality at the beginning, middle and end. After setting up the drawing machine, weaving the wire through the up to 16 dies, the operator draws a foot of wire and cuts a small piece of about 6 inches to inspect diameter and surface quality. Another piece of wire is cut to measure tensile strength and elongation on an Instron @ tensile tester. The inspection process is described below:
Surface Quality Inspection: Surface quality is checked by inspecting a small piece of wire with a stereo-microscope at 30X magnification under fluorescent light illumination. The operator then rates the surface on a scale from 1 to 5. This is a very subjective system that is difficult to replicate and hard to train the new operators. One thing that helps this system work well is that final drawing operators have on average more than 10 years of experience. Therefore, passing or rejecting wire becomes a subjective call based on years (thousands of miles of wire) of experience. This process is repeated at the middle of the spool. This time the microscope is brought close to the drawing machine, and the wire is pulled to reach the scope without cutting it. The wire is inspected once more at the end of the spool. The surface quality scoring is briefly described below:
o 1 = perfect wire surface, smooth. No cracks draw lines, etc. (not very common)
o 2 = good, and smooth wire surface with occasional pitting, and no draw lines. o 3 = good wire surface with very light draw lines that are either not too deep or
too frequent. The wire might also show some laps.
o 4 = Visible draw lines, severe pitting, holes, over-oxidation o 5 = Numerous lines, severe pitting, or draw lines.
Diameter Measurement: About 4 inches of wire are cut and taken to a bench-top laser micrometer. The laser micrometer rotates the wire and takes multiple reading of the
diameter. The operator then records the average diameter in a log-book, as well as in the computer database.
The current inspection process is time consuming and not very effective. The operator has to stop the machine and spend about 15 min total time visually inspecting the wire and measuring diameter for each 20 pound spool of wire. In addition to that
measurements are taken on a very small sample of the wire produced. For example, on a 20 pound spool of 0.0094 inch diameter wire, there are about 40,000 feet of wire. Only about ift is inspected visually and for diameter. This is sampling about 0.0025% of the wire.
3.4.2. The Need for Real-time Continuous Inspection
At final draw specifically, 500 pound spools pose a significant challenge. Currently, inspection is carried out every 10 pounds on a 20 pound spool due to the complexity and risk of errors during final draw. A real time inspection system capable of detecting surface defects as well as measure diameter is needed in order to enable the transition to 500 pounds spools at final draw. If the same inspection process used for the 20 pound spools were to be followed for the 500 pound spools, the operator would then need to stop the machine 50 times (every 10 pounds) to inspect surface quality and diameter, or run the risk of producing up to 500 pounds of scrap. It must be pointed out that the cost of raw Tantalum is about $30/pound, by the time it is purified, and sintered into a bar it is worth about $ 100/pound. Then to run a whole 20 pound spool of bad wire is to lose about $1,400 (value added). To run a whole 500 pound spool of bad wire could cost about $35,000 (value added).
3.4.3. Real-time Inspection System Requirements
Initial research had shown that there was no "real-time, continuous" wire inspection system available. The LFM internship project was defined to find the tools capable of detecting surface defects in fine wire at high speeds, to purchase one unit, and to develop a system capable of detecting such defects under manufacturing conditions. Then, use the
knowledge gained to propose a production-ready system to be installed on all of the final draw machines.
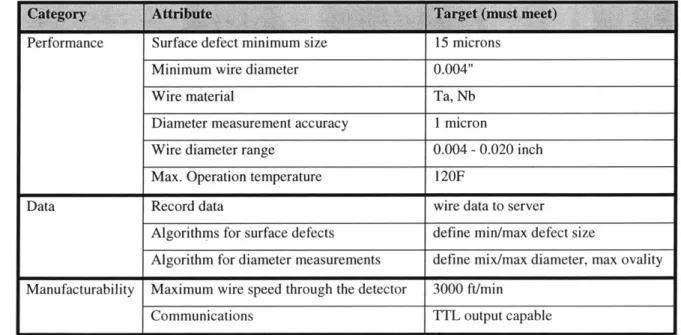
Together with the engineers and technicians at the wire factory we defined the basic equipment requirements of the new wire inspection system. Those requirements were then used to select the equipment needed to start the development of a system capable of monitoring wire quality during final draw. The first requirements are related to being able to match the performance of the current inspection system. Specifically, the new system
should find surface defects that the human eye can find at 30X magnification. This is a big challenge for an automated system for two reasons: it would need to have a high resolution to find small defects, and it would need "smart" algorithms to identify true defects among common wire irregularities. Also, a continuous, in-line inspection system would have to keep-up with the wire traveling through the wire drawing machine. This is the second key technical challenge for the new system. The new inspection system will have to be able to detect small surface defects in the wire while the wire is traveling at up to 1000 ft/min. Below is the list of basic requirements that needed to be met by the new final draw wire inspection system:
vertormance Nurtace aetect minimum size i: microns Minimum wire diameter 0.004"
Wire material Ta, Nb
Diameter measurement accuracy 1 micron
Wire diameter range 0.004 -0.020 inch Max. Operation temperature 120F
Data Record data wire data to server
Algorithms for surface defects define min/max defect size
Algorithm for diameter measurements define mix/max diameter, max ovality Manufacturability Maximum wire speed through the detector 3000 ft/min
Communications TTL output capable
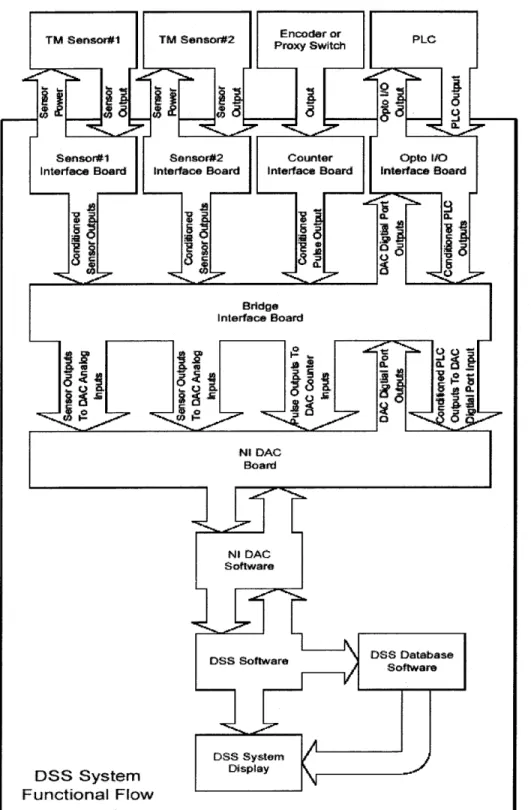
3.4.4. Surface Defect Detection (Infra-Red Sensor) Description and Capabilities The only equipment capable of detecting surface defects on a small diameter wire moving at high speeds was a newly developed infra red (IR) sensor. The sensor was developed and manufactured by Takikawa Engineering in Japan. The IR sensor is
coupled with a high-speed data acquisition system developed by its distributor here in the US, DAS distribution. The high speed data acquisition system, hardware and software, is called a DSS system. The DSS system was developed by DAS distribution to detect small flaws in fiber optic strands as they were extruded. Fortunately, the fiber optic application had many of the same tough requirements we had for fine Tantalum wire; detection of
small defects, high operating speeds, and real-time defect detection. Figure 3.3 shows how the DSS system processes the signal from a TM sensor, combines the data with the input from an encoder, and sends an electrical signal out to a PLC.
TM Sensor#1 TM Sensor#2 EnSdeth PLC
Sensor#1 Sensor#2 Counter Opto 1/0
Interface Board Interface Board Interface Board Interface Board
A3 A Bridge Interface Board U9 N DAC Board DSS System Functional Flow N1 OAC Software
oss software DSS Database
DSS System
Display
3.4.5. Infra-Red Sensor Description
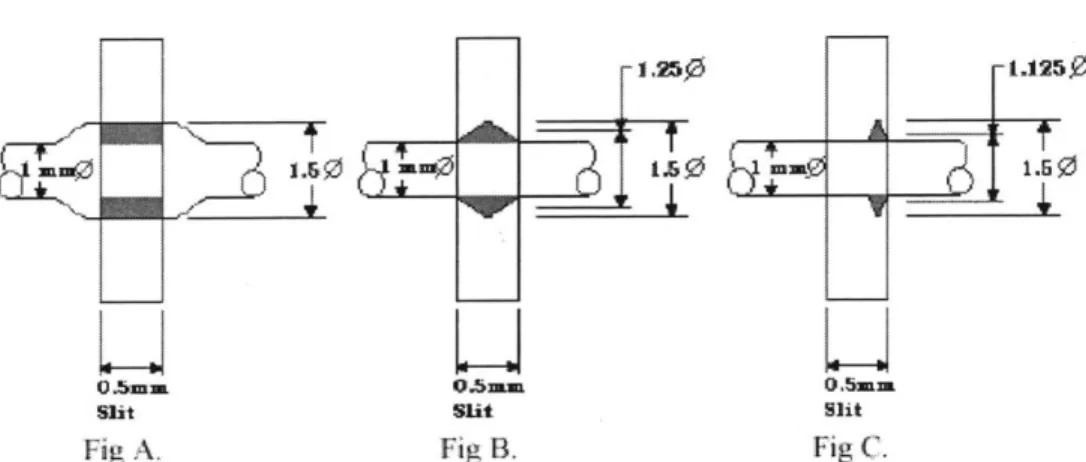
The surface defect sensor used in this study (model TM-1003W) is a high-speed defect detector, which utilizes a dual parallel photo- optic slit technique combined with infrared light source. This is used to measure rapid light volume changes created when a sudden change in product diameter occurs. The light source is a 720 nm light emitting diode (LED). This diameter change is caused by the flaw, bump, neck down, color skip, etc. The light volume received is converted to a "Real time" analog signal, which is then analyzed through a differential circuit. The actual throughput speed is limited by the design of the circuits used, i.e. light modulation and filtering techniques. However, 5 [m defects can be characterized at speeds greater than 15 m/sec.
The sketch in Figure 3.4 illustrates how a defect may appear as it passes through the defect detector's two parallel photo- optic slits. And although the defect height may be the same, the actual light volume received can be different due to defect size
characteristics. Technical specifications of the TM detector can be found in appendix 3-A. 0MM -. 0 go 1.50
LLi
O.5mm 0.5mm 0.5mm Sht Si SlitFig A Fig B. Fig C.
In fltmre A the defect creates a. sh-dow that takes up the entire photo- optic it. The defdct is detected as a 0.5 nmn high dcq ect.
In tiinr- B the def]ct is detect d as a 025 mm high defect. I fihre C the defCct is deteted as a 0. 125 mm high defect.
3.4.6. Evaluation of Infrared Detector (Surface Defects)
A series of experiments were carried out to prove the capability and reliability of the detector system, and then to characterize the wire being produced and create a baseline. The first set of experiments consisted of creating defects in known locations on a small spool of wire, then running the same spool of wire several times through the detector. The second stage of the repeatability experiments consisted of increasing the line speed to verify the capability of the system to detect surface defects at higher line speeds. After it was established that the defect detection system was accurate and reliable (repeatable), several production (20 pound) spools were run and data was collected and analyzed. The data from 156 miles of wire from different diameters was used to create a baseline of wire surface quality. Finally, a surface quality defect limit was established.
3.4.7. Surface Defect Detector (IR) Repeatability Experiment
A series of experiments was run with pre-made surface defects on a 500 ft spool of 0.995 inches diameter wire in order to establish the basic capability of the surface detection system. This was to determine if the surface defect detection system would consistently catch defects when the same spool of wire is run through it several times. Real wire defects proved to be very impractical for this purpose because they were scarce and far apart (thousands of feet in between), and more importantly invisible to the naked eye. After several different attempts, the method used to create defects on the wire that were visible was to use a marker containing oil-based white paint. By hand, small white rings (on the order of 150 Lm long and 50 gm thick) were created on the surface of the wire at various locations. An arbitrary starting point was chosen 20 feet into the spool, were the 0 mark was made, then white marks were made 50 ft, 100 ft, 150 ft, 200 ft, 300 ft, and 400 ft away.
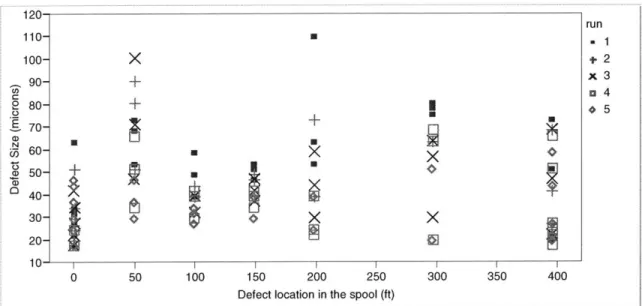
The results of the repeatability experiments just described are shown in Figure 3.6. The same spool of wire was run a total of 5 times through the IR surface defect detector. The wire speed at each run is noted in the table in Figure 3.5. Each data point in the graph on Figure 3.6 represents a white mark in the wire. Note that 3 marks spaced 1 inch apart were made at 0, 50 ft, 100 ft, 150 ft, 200 ft, 300 ft, and 400 ft.
Run Wire speed 1 100 (ft/min) 2 100 (ft/min) 3 400 (ft/min) 4 400 (ft/min) 5 800 (ft/min)
Figure 3.5. Wire speed for repeatability experiment. Run numbers correspond to the run numbers in Figures 3.6, and 3.7.
run XU + +-+
-X
+ U - U--
4
4
xU
11-. 10 0 50 100 150 200 250 300 350 400Defect location in the spool (ft)
Figure 3.6. White mark repeatability experiment data.
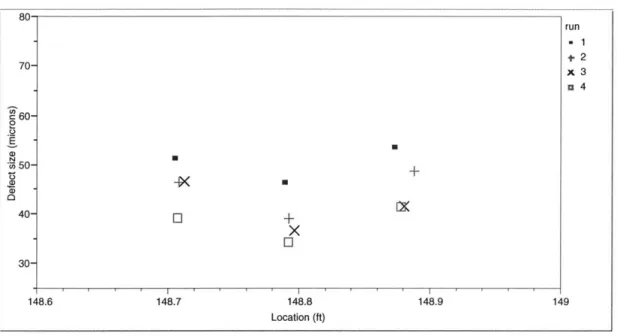
The first thing to note on Figure 3.6 is that all the white marks (21 in total) were found every time the spool ran through the detector. Although there was some degradation of the paint by the wire rubbing together when spooled between runs, the size of the defects was consistent in some areas. Figure 3.7 shows only the data collected around the 150 ft mark. The size of each of the 3 marks consistently degrades from the first to the forth run.
a 1 + 2 +5 110 100 90 C 2 8 70 0 N 05 60 ciD 50 40 30 20
* 80-run *2 70- x3 a4 60-0 E 50- a4, 40- + X 0 30-148.6 148.7 148.8 148.9 149 Location (ft)
Figure 3.7. Repeatability data collected around the 150 ft mark.
3.4.8. A Definition of Surface Quality
The software in the data analysis system that was part of the surface defect sensor (DSS plus TM sensor) used the maximum number of defects above a certain size as the metric to define bad and good wire. It was soon discovered that such a metric would be heavily dependant on the total length of wire tested. Furthermore, for it to be robust it had to allow a significant number of defects. Also, it is not the same to have 100 defects evenly spread along 10,000 ft of wire, or to have 100 defects concentrated on 1 foot of wire. It then became evident that a defect density metric was more appropriate. Defect density in this study is defined as number of defects above a given size per unit length. Specifically, most of the data collected was for defects 15 pm or larger per foot of wire (Equation 3.1).
. Total _number _of deecsntesgmn
Defect -density = fects in thesegment (Equation 3.1)
Segment - length - in _
feet
Since no one knew what the typical defect density of good wire was, the natural first step in defining defect density limits was to define a baseline defect density. Real production material was used to gather as much data as possible in the time of the internship, covering as wide as possible a range of wire diameter and temper. Appendix 3-B
about 156 miles of wire were inspected for defects 15 microns or larger. The average wire speed was 500 ft/min.
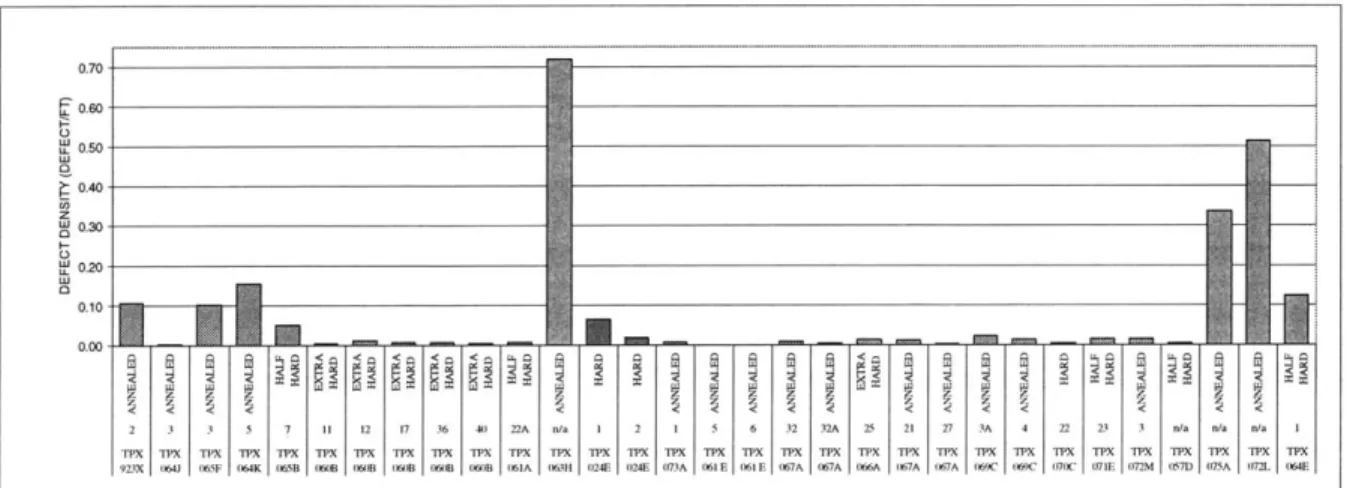
Figure 3.8 shows the average defect density for all the production spools tested. The 4 lots with hatched bars, and the 2 lots with dotted bars (TPX024E- 1, and 2) indicate lots that were rejected at the packaging operation for excessive surface defects. The rest of the lots were "good" spools that were shipped to customers. All these lots went through the current surface quality inspection process during final draw. The rejected lots (hatched bars) were caught at the packaging operation not at final draw. The first, third, and forth lots have significantly higher defect densities than the rest of the lots. Unfortunately, these were the first lots tested and no samples were taken for optical inspection. Lot TPX024E was rejected at final inspection but it shows a low defect density.
0.70-0.60 -L 0.0 0.40-0.20 0.10 0.00"
2 3 3 5 7 11 12 17 36 40 22A n0a 1 2 I 5 6 32 32A 25 21 27 3A 4 22 23 3 n/a n1a 11a 1 TPX TPX TPX TPX TPX TPX TX TPX (TX lOX TPX 35TP X I? X M T T X M 'X TOX TPX TPX M TO X 120 M (TX T M X lO X 32 (X 32 MO
923X (6 065F (64K 0B 060 B 60 B 0 ( 0 (0)6B 06A (03H ( (24 E (04E (73A 061 E ((61 ( 0 ( 07A A 060 A 06A A( ( 069C ( 0 7C 07 1E I )72M (07D (03A (72L (6E
Figure 3.8. Average defect density for all production spools tested.
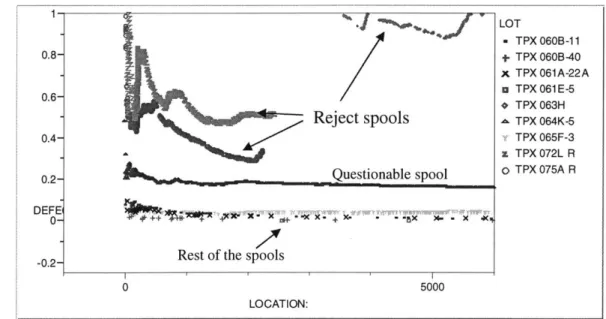
Average defect densities shown in Figure 3.8 indicate that it should be possible to segregate good and bad wire based on defect density data. For a defect density metric to be useful, it has to be a real-time running average that the defect detection system can calculate and compare against the maximum allowable value. Figure 3.9 shows the cumulative defect density for a sample of the production spools tested.
1- 0.8-0.6 0.4- 0.2-DEFE 0R -0.2-P 0 LOT - TPX 060B-11 + TPX 060B-40 x TPX 61A-22A *TPXO061 E-5 * TPX 063H TPX 064K-S5 TPX 065F-3 z TPX 072L R o TPX 075A R 5000 LOCATION:
Figure 3.9. Cumulative defect density by length of wire for representative good, bad, and questionable spools.
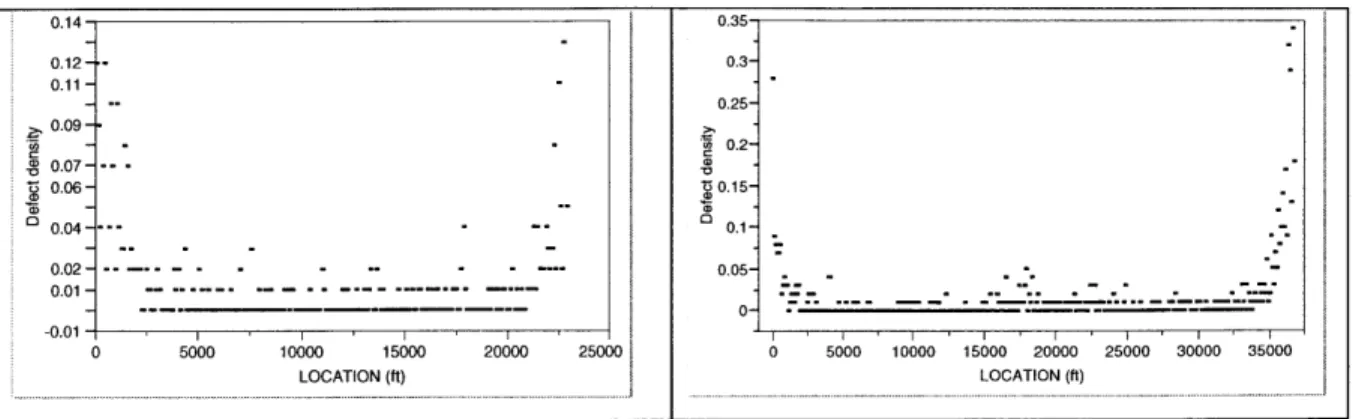
This is an adequate, but not ideal way of looking at defect density. Cumulative defect density is very sensitive at the start of the spool while it becomes very stable towards the end. The reason is that the denominator becomes increasingly larger. The data collection algorithm in the DSS system was not designed to calculate running averages; it only recorded each defect that occurred along with a location in the spool. To simulate the desired data analysis in the production system, the data was aggregated into number of defects on each 100 ft segment of the spool. Before plotting a control chart of this data, zeros where inserted were there was no defect data collected. Figure 3.10 shows defect density plots for several "good" lots after the data was lumped into number of defects per
1000 ft segment.
Reject spools
Questionable spooi
ii
X.-Xxx.K,
est of the spools
0.14 0.35-0.12-- 0.3 0.11 - 0.25-0.09 - -- - -0.2-ID0.07- ----0.06- 0.15-0.04-- 0.1 0.02 - - -- - - - 0.05- -0.01 --- --- - --- -- -0 5000 10000 15000 20000 25000 0 5000 10000 15000 20000 25000 30000 35000
LOCATION (ft) LOCATION (fi)
Figure 3.10 Defect density, data aggregated into number of defects per 100 ft segment
A bowl or U-shape is observed in the two plots in Figure 3.10. The same shape is observed in all of the production lots tested. The magnitude of these spikes in defect density at the start and end of each spool varies from lot to lot. After analyzing this data with the experts at the factory, it was concluded that the increase in defect density at the end of the run (beginning of the spool) was probably due to a "warm-up" effect. It is known that it takes some time for the lubricant to coat the small orifice in all the dies at final draw.
Also, during the set-up of the drawing machine the wire is pulled through the dies by hand potentially creating defects on the wire. Therefore, it is not surprising to see that the
surface of the wire improves rapidly for the first few hundred feet of wire drawn.
There was not a high degree of consensus on the consistently high defect density at the other end (end of spool). The most quoted theory was that the drawing speed is decreased
significantly and therefore it could be a "speed effect." An interesting point here is that with the new 500 pound spools, the ends of the spool will represent a much smaller fraction of the wire processed. Therefore, the fraction of low quality wire per pound of wire produced (spool ends) would likely be significantly reduced.
What is important, at this point is the ability of the new wire surface inspection system to characterize the process in a way that was not possible in the past. It would now be
and optimize the process. For example, it would be possible to study the effect of the following variables on wire surface quality:
* Lubricant type
* Lubricant temperature * Drawing speed
* Composition of the initial bar * Annealing temperature * Oxide thickness * Etc, ...
Figure 3.11 shows 4 moving average control charts. These control charts are constructed by averaging a group of 3 contiguous defect density data points1. As seen in Figure 3.8, there is a wide variation in average defect density from lot to lot. If the start and end effects (bowl-shape) of the control charts are ignored, then it is possible to estimate a maximum allowable moving average defect density to be used by the DSS software.
'Moving average: Uniformly Weighted Moving Average (UWMA) is the average of the w most recent subgroup means, including the present subgroup mean. When you obtain a new subgroup sample, the next moving average is computed by dropping the oldest of the previous w subgroup means and including the newest subgroup mean. The constant w is called the span of the moving average. There is an inverse relationship between w and the magnitude of the shift to be detected. The larger the span (w), the smoother
0.00 2: 0.09- -S0.07- .D i 5 - t50.05- ,0.05-0.03 UCL0.03- UCL < 0.01 Avg=0.0040 0.Avg=0 0060 LCL LCL 0.01 - - - - ----.- 1 -0.03 -0.03 1 1 LOCATION (ft) LOCATION (100s) 0.16 0.30-i 0.12 0.20- 0.08 0.0 UCL L-.Avg=0.0120 Avg=0.0139 0) 0.00- LCL 0.00- LCL 00000000000000 -0.0610 0000000
LOCATION (1\ Ds) LOCATION (It)
Figure 3.11. Moving average control charts for typical production lots.
The production lot, of acceptable quality, with the highest defect density was chosen to determine the defect density control limits. Figure 3.12 shows the moving average control chart and control limits for such lot. Although the JMP ® software calculates upper and lower control limits2, the only relevant one, in this case, is the upper control limit. The
upper control limit (UCL) is the maximum allowable defect density moving average. This number then can be used by the DSS software to make an instantaneous decision regarding the quality of the wire just inspected.
2 JUMP ® allows specification of control limits in terms of a multiple of the sample standard error. The control limits are generated at k sample standard errors above and below the expected value, which shows as the center line. Three standard deviations (3 sigma) was used to generate the control limits on the
0.35- 0.30- I0.25- 00.20-0 .15-0 .10--0.10: o 0 0 Co 0D 0 0 0 0 0) 0) 0 0 oD 0 0 0) 0 01 0 0 0) 0) 0 0 C0 C\J co qt '41 LO (D t'- co 00 i) 0 LOCATION (ft) UCL Avg=O.0502 LCL
Figure 3.12. Moving average control chart and control limits for worst acceptable production lot (acceptable lot with the highest defect density).
The Best way to test the proposed maximum running defect density is to apply it to known bad lots. Figure 3.13 shows moving average control charts for 3 rejected lots using the control limits generated from the worst acceptable production lot in Figure 3.12. CD (D C. 0 0) 0) 0 4- 3.5- 3- 2.5- 2- 1.5- 1- -0.5-6 -01/01/1904 C\ C') 0 LOC 0 0 - C )C C0 ) C'J C) C)J - (0 CO 0 C) 0- C) C)0 CO 0 a) V- N M ct LO WN W M 0-r--cN LOCATION (ft)
0.8 C 0.6- 0.4-0.2- .UCL_ Avg=0.050 LCL >0.0-0. o) D 0) 0) 0 0 0 0 0 0 0 0 0- C) C) 0 N - C) C) o) N N It 0 0 C\JIc ( 0 NC N LOCATION (100s)
Figure 3.13-b. Moving average control chart of rejected lot.
1.00 CD 0.75-0 0.50-> .UCL A=0.0502 0.00 L-0.2G 00 0D 0 0 0 0 0 0) 0 0 C0 N It ( WO 0 N It CO C N 't LOCATION (100s)
Figure 3.13-c. Moving average control chart of rejected lot.
The three rejected lots showed in Figures 3.13-a, b, and c would have been stopped very quickly if the surface inspection equipment was installed in the wire drawing machine. Defect density is considerably higher for rejected lots than for acceptable lots. It is interesting to note that Figure 3.13-a shows two distinct advantages of the surface inspection system: a) it would be possible to easily and quickly identify defects and stop the machine, or b) if the defects were not caught during processing, it would be possible
15,000 ft of the spool had a very high defect density, the rest of the spool, over 10,000 ft was acceptable.
One of the original goals of the project was to correlate the new surface inspection system with the current visual inspection system. No correlation was found between the infra-red inspection system and the visual inspection currently used at the final draw operation (Figure 3.14). Furthermore, none of the four lots rejected at packaging for excessive surface defects was caught at the visual inspection at final draw. The three rejected lots in Figure 3.13 had among the best visual scores at final draw of all the lots tested.
Figure 3.14. Correlation and the visual
was found between the infra-red wire surface inspection system inspection currently used at the final draw operation.
In manufacturing environments it is common to point to the operator of the equipment or metrology when the data is not consistent. In this case, the reason there is no correlation between the visual method and the new infra-red inspection system probably has nothing to do with operator error. It is an extremely big assumption that the surface quality of a 20,000 ft spool of wire could be accurately assessed by inspecting one inch of wire from the start, middle, and end of the spool. To test this statement, a stereo microscope was mounted directly on top of the wire-line on a final draw machine to visually inspect good
CORREALTION VISUAL VS TM DETECTOR
3.1 . + 2.9 -i 2.7 -0 0 c) 2.5 -2.3 Rejected spools ; 2.1 ->1.9 1.7 -1.5 --0.10 0.10 0.30 0.50 0.70 0.90
and bad wire at 30 X magnification. After staring at wire passing though the field of view of the microscope at low speed for hours, it was evident that it is not possible to detect defects inspecting even on a spool of wire with a very high defect density. From the data collected with the new infra-red sensor system, the worst spools of wire, at the worst places in the spools had one defect every foot. Another advantage of the IR inspection detector is that is collects information from all around the wire surface (3600), while the human eye is only able to collect information from the top surface (about 1200).
3.4.9. Production Wire Inspection System
The final goal of this project was to define and recommend a complete wire inspection system to be installed in all production final draw machines. The data presented up to this point demonstrated that the equipment selected together with the data processing
algorithms developed was able to detect real surface defects on the wire as it was processed at production speeds. The next step was to combine this technical capability into a robust, production ready system that could be installed in all of the final draw machines in the factory. There were a few issues we needed to address for this system to be ready for production. Together with the supplier's engineers we addressed all the issues and designed a wire inspection system for a manufacturing environment. Below is a list of issues and how they were addressed in designing the production version of the wire inspection system:
" Both surface defects and diameter signals should go to a common data processing unit: This was accomplished by feeding the laser diameter (LDM) signal through the RS232 port in the DSS processing unit.
" The operator should only need to input the product information once and the system should automatically load the limits: The signal coming through the RS232 port will be processed by the same software program indexing the data stream with the same attributes as the surface defect data. Those attributes are selectable, and most likely will be lot number, wire diameter, customer, and temper. Diameter and surface defect density limits will be associated with a