https://doi.org/10.4224/12340975
READ THESE TERMS AND CONDITIONS CAREFULLY BEFORE USING THIS WEBSITE.
https://nrc-publications.canada.ca/eng/copyright
Vous avez des questions? Nous pouvons vous aider. Pour communiquer directement avec un auteur, consultez la première page de la revue dans laquelle son article a été publié afin de trouver ses coordonnées. Si vous n’arrivez pas à les repérer, communiquez avec nous à [email protected].
Questions? Contact the NRC Publications Archive team at
[email protected]. If you wish to email the authors directly, please see the first page of the publication for their contact information.
NRC Publications Archive
Archives des publications du CNRC
For the publisher’s version, please access the DOI link below./ Pour consulter la version de l’éditeur, utilisez le lien DOI ci-dessous.
Access and use of this website and the material on it are subject to the Terms and Conditions set forth at
A Method for Determining Ice Cover Thickness and Strength in the
Canadian Arctic Archipelago
Frederking, Robert
https://publications-cnrc.canada.ca/fra/droits
L’accès à ce site Web et l’utilisation de son contenu sont assujettis aux conditions présentées dans le site LISEZ CES CONDITIONS ATTENTIVEMENT AVANT D’UTILISER CE SITE WEB.
NRC Publications Record / Notice d'Archives des publications de CNRC: https://nrc-publications.canada.ca/eng/view/object/?id=e7de922a-ba81-44ad-8408-5af5195ae74b https://publications-cnrc.canada.ca/fra/voir/objet/?id=e7de922a-ba81-44ad-8408-5af5195ae74b
Strength in the Canadian Arctic Archipelago
R. Frederking
TECHNICAL REPORT
CHC-TR-034
A METHOD FOR DETERMINING ICE COVER THICKNESS
AND STRENGTH IN THE CANADIAN ARCTIC
ARCHIPELAGO
R. Frederking
Canadian Hydraulics Centre
National Research Council of Canada
Ottawa, ON K1A 0R6
Canada
Report prepared for
Canadian Ice Service
Technical Report
CHC-TR-034
ABSTRACT
During the 1980s extensive offshore geophysical surveys yielded over 100,000 measured ice thicknesses in one area of the Arctic Archipelago. The date and location of these measurements are known and can be compared with ice regime information on Canadian Ice Service ice charts from the same time period. Air temperature data are available from Arctic Weather Stations at Mould Bay and Isachsen, from which ice strength can be calculated. It has been demonstrated that ice cover strength decreases by a factor of 10 from mid-winter to just before break-up. A methodology has been proposed for using all the aforementioned data to make adjustments to the strength factor p* in the CIS Ice Forecast Model for application in aiding ice forecasting in the Canadian Arctic Archilelago.
TABLE OF CONTENTS
Abstract ...i
Table of Contents ... iii
1. Introduction...1
2. Data Sources ...1
2.1 Ice Thickness Data ...1
2.2 Ice Charts ...4
2.3 Climatology Data ...8
2.4 Direct Observations...9
3. Ice Strength ...9
4. Characterizing Ice Cover Strength...11
5. Approach to Characterizing Ice Cover Strength ...11
AN OVERVIEW OF ICE COVER THICKNESS AND
STRENGTH IN THE CANADIAN ARCTIC ARCHIPELAGO
1. INTRODUCTION
There is a renewed interest in the ice conditions of the Canadian Arctic Archipelago. In the context of marine transportation this applies to shipping through various routes of the Northwest Passage and access to natural gas reserves in the High Arctic in the area known as the Sverdrup Basin. As a consequence, the Canadian Ice Service is looking at developing ice models to aid in ice forecasting in these regions. This report will identify sourcee of historical ice thickness data that merit analysis and demonstrate their use to predict ice cover strength for eventual inclusion in a CIS Ice Forecast Model for the Arctic.
2. DATA SOURCES
Four sources of ice datawill be examined here; ice thickness measurements from drill holes, CIS ice charts, climatological information and direct observations. Each of these data sources will be described in turn.
2.1 Ice Thickness Data
During the 1970s extensive seismic surveys were conducted in the High Arctic in the search for hydrocarbon resources. The ice cover between the islands is landfast for the winter and early spring, so these seismic surveys were carried out on the ice cover in the March to May period of the year. To conduct the surveys, “shot” holes were drilled at regular intervals, typically 165, 220 or 440 feet apart. Over 600 lines of length 10 to 60 km were surveyed, for a total of about 25,000 km. Altogether over 100,000 holes were drilled and, at the request of Sun Oil, ice thickness to the nearest foot (0.3 m) was logged for each hole. The hole spacing was uniform for each line with no deviations so the measurements represent an excellent sample of unbiased ice thickness data. Ice thickness data for the years 1971 through 1980 are available. The general area of the measurements is shown in Figure 1 and corresponds to a hydrocarbon rich geological province known as the Sverdrup Basin.
2 CHC-TR-034
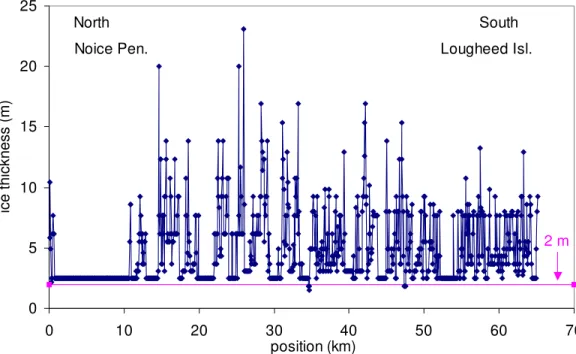
To illustrate the data in more detail the location of measurement lines in a spring 1978 survey between Lougheed Island and the Noice Peninsula on Ellef Ringnes Island are shown in Figure 2. While not exact, the approximate coordinates of the ends of the lines can be determined from Figure 2. Knowing the spacing of the “shot” holes, in this case 220 ft or 67 m, a profile of ice thickness can be determined. The thickness profile for line #22 is plotted in Figure 3. There is an area of level ice near the north end of the line, which, from the evenness, one would expect it to be first year ice. The thickness of 2.5 m, however, suggests it is most likely second year ice. The rest of the ice was 5 to 10 m thick with a few thicknesses greater than 20 m, indicating heavily ridged multiyear ice. Expanding a part of line #22 from 20 to 30 km (Figure 4), it is possible to distinguish floes, one from 22 to 24 km, and another from 25 to 26 km and a third from 27 to 29 km. Profile line #22 comprised almost 1000 thickness measurements. A simple exceedance plot of ice thickness is presented in Figure 5. The distribution appears to be logarithmic. There are a few thickness values less than 2 m, and referring to Figure 3, suggest the presence of a refrozen leads, at 35 km and 47 km. Also Figure 5 shows a clustering of thicknesses at 2.5, 7.5 and 9.2 m. While not presented here, line #21 also had one ice thickness less that 2 m at 35 km. In fact all except one of the profile lines had a few thicknesses less 2 m. This suggests the presence of leads, which would be zones of ice cover weakness in the spring and summer. A summary of the thickness data from the 10 survey lines is presented in Table 1.
0 5 10 15 20 25 0 10 20 30 40 50 60 7 position (km) ice t h ickness (m) North South
Noice Pen. Lougheed Isl.
2 m
0
Figure 3 Ice thickness profile for line #22, starts in north and extends south
0 5 10 15 20 25 20 22 24 26 28 30 position (km) ice thickness (m) 2 m
4 CHC-TR-034 0.001 0.01 0.1 1 0 5 10 15 20 25 ice thickness (m) exceedance probability 2 m ice thickness
962 ice thickness measurements
Figure 5 Ice thickness probability exceedance plot for profile line #22
Table 1 Summary of ice thickness data from seismic survey lines
line # length (km) number of "shot" holes "leads" average thickness (m) 14 11.2 165 1 2.48 15 26.1 385 0 2.94 16 26.1 385 1 6.09 17 35.6 526 14 4.86 18 35.7 528 1 5.02 19 27.6 488 1 5.29 20 22.7 336 22 4.63 21 59.3 877 1 4.98 22 65.1 962 7 4.69 23 30.5 450 3 5.86 2.2 Ice Charts
The ice thickness information is localized to the axis of the survey lines, but can be used to verify information on ice charts. CIS maintains an archive of digital Ice Charts extending over the same time period as on-ice ice thicknesses were measured. To compare with the measured ice
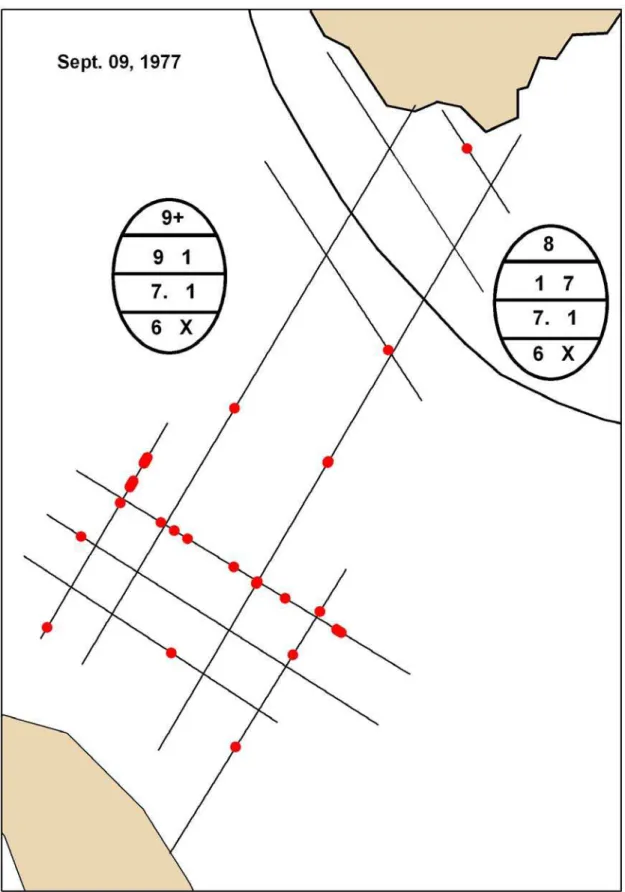
thicknesses, ice charts from autumn 1977 and spring 1978 were examined. An ice chart for September 9, 1977 is shown in Figure 6 and an expansion of the area around Lougheed Island is presented in Figure 7. The area northeast of Lougheed Island is 9 tenths old ice, however there is a region close to the Noice Peninsula with 1 tenth old ice and 7 tenths new ice. This new ice could correspond to the level ice area at the north end of line #22 (see Figure 3). The ice charts are geo-referenced and it is possible to superimpose ice thickness information from the 10 profile
lines, which are also geo-referenced, on a section of the ice chart. This has been done in Figure 8. The width of the ice thickness profile lines corresponds to the ice thickness, as indicated in the legend of Figure 8. The thinner ice adjacent to the Noice Peninsula is evident in the profile line thicknesses of Figure 8. It is possible to use ice thickness data to identify “leads”. This is done by assuming a lead to be wherever there was an ice thickness less than 2 m and plotting this condition as a red dot in Figure 9. It can be seen that there were “leads” intersecting 9 of the 10 profile lines. This example illustrates that the ice thickness measurement data can be compared with ice charts in a systematic and quantitative fashion.
Figure 6 CIS Ice Chart from 09 Sept. 1977
6 CHC-TR-034
8 CHC-TR-034
2.3 Climatology Data
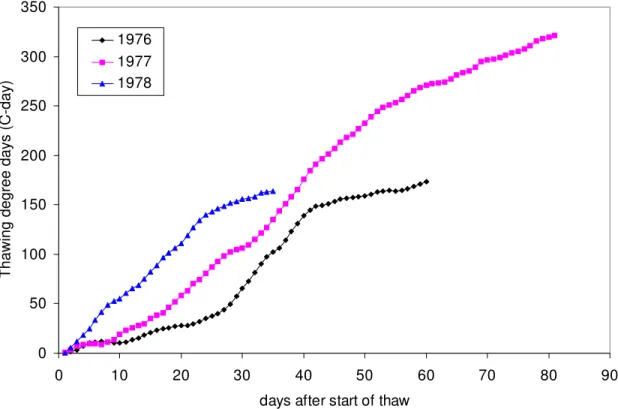
The climatology, particularly air temperature plays a major role in growth of ice over the winter and weakening of the ice cover in the spring and summer. Break-up and movement of the ice cover is also affected by wind. The CIS weather stations at Mould Bay and Isachsen, which were in operation during the time period of this study, provide such data. Cumulative freezing degree days and thawing degree days, relative to 0o C, were calculated for several seasons. Plots of cumulative freezing degree days for two winters of air temperature data from Mould Bay are plotted in Figure 10. Both winters were consistent with about 6500 freezing degree days, which would grow a first year ice sheet to about a 2.0 m thickness. Cumulative thawing degree days, mean daily temperature above 0oC accumulated from when air temperatures go above freezing, are plotted in Figure 11. In this case there is considerable difference between the three years, 1976, 1977 and 1978. The summer of 1977 was considerably warmer and longer. As will be demonstrated subsequently, not only the length, but also the start time of the thaw season is important for determining ice strength.
-7000 -6000 -5000 -4000 -3000 -2000 -1000 0 0 50 100 150 200 250 300 350
days after freeze-up
FDD (C-day)
1977-78 1976-77
0 50 100 150 200 250 300 350 0 10 20 30 40 50 60 70 80 90
days after start of thaw
Thawing degree days (C-day)
1976 1977 1978
Figure 11 Accumulated thawing degree day from Mould Bay air temperatures
2.4 Direct Observations
While no data from direct observations have been presented in this report, such data are available from the Round Robin Flights made in the Arctic. An example is the visual images shown by Bea Ault and Don Lindsay (presentation at CIS on March 30, 2005). Having access to these images would provide more detail than is provided in the CIS digital ice charts and broaden the very localized data from the ice thickness profile lines. Such observations also provide
information on floe size and the presence of leads. Time of ice break-up and movements might also be obtained from the direct observations. Any other source of summer ice movements would be very helpful.
3. ICE STRENGTH
Field measurements carried out by Johnston et al (2002, 2003) have shown that ice strength decreases progressively from a maximum in mid-winter to a minimum in mid-summer. These investigations revealed that the ice cover had already lost most of its strength by the time air temperatures went above freezing (0o C). Work of Timco and Johnston (2002) and Johnston and Timco (2002) related ice cover strength to warming of the ice cover, which was observed to actually start in March in the Resolute region. CIS has used this work to produce a prototype ice strength chart (Gauthier et al, 2002). The ice cover strength is related to Accumulated Warming Degree Days (AWDD) defined by Timco and Johnston (2002) as
10 CHC-TR-034
where Tmean is the mean daily air temperature and Tcutoff is a baseline temperature in relation to which warming is taken to occur. Ice strength and air and ice temperatures were measured in the Resolute area, and based on them a cut off temperature of – 30o C was determined and the
accumulation of warming days taken to start on April 1. The following expression for normalized strength was obtained
STnor = 1.0643 exp (-0.001 AWDD) (2)
This is an empirical expression and it was suggested that in other regions of the Arctic different parameters for equation (1) and coefficients for equation (2) would have to be determined. For Resolute a seasonal maximum of 2500 AWDD was reached after about 3 ½ months. Using the same cut-off temperature and starting date as for Resolute, AWDD for three seasons were determined, based on Mould Bay air temperatures (see Figure 12). What is noteworthy here is that on the basis of AWDD there is very little difference between the three seasons, however the 2500 degree-day threshold was reached 1 week earlier in 1977 than in 1978. Note also that it took almost 4 months to reach the 2500 AWDD threshold at Mould Bay, as compared to about 3 ½ months for Resolute. This emphasized the desirability of validating ice strength expressions for the Lougheed Island area of the Sverdrup Basin. Also, keep in mind that these expressions apply for first year sea ice and much of the ice in the High Arctic is second year or multi-year. Weakening of the sea ice occurs initially in the thinner first year sea ice, and it is expected this will have a controlling influence on the overall ice cover strength.
0 500 1000 1500 2000 2500 3000 3500 4000 0 20 40 60 80 100 120 140 160
days from April 1
Accumulated Warming degree days (C-day)
1976 1977 1978
Figure 12 Accumulated warming degree days (AWDD) from Mould Bay air temperatures
While not discussed here, there is also a strengthening of the ice cover that occurs in the autumn. NRC-CHC is undertaking work in this direction and, as it progresses, it will become a part of describing ice cover strength on a year-round basis.
4. CHARACTERIZING ICE COVER STRENGTH
One line of investigation that has been undertaken is to relate parameters in the Ice Forecasting Model to physically observable, measurable or predictable properties of the ice cover (Kubat and Frederking, 2004). A study of strength parameters in their report showed that only Hibler’s (1979) strength parameter p* had much affect on ice forecast properties of thickness,
concentration and pressure. Changing this parameter by a factor of 10 did have a significant affect on the forecast properties. The NRC-CHC work on ice strength has shown that ice cover strength decreased by a factor of 10 from mid-winter to mid-summer. This ice strength is at the scale of the ice thickness, that is about 2 m. The challenge is to relate this strength to the p* strength used in the Ice Forecast Model.
5. APPROACH TO CHARACTERIZING ICE COVER STRENGTH
It has been shown that the range of ice strength at small scale decreases by about a factor of 10 from a maximum in mid-winter to minimum just before the ice disintegrates. Integrating the four historical sources of ice data; ice thickness measurements from drill holes, CIS ice charts, climatological data and direct observations, together with CWDD calculations of ice strength would form the basis for developing scenarios of evolution of ice cover strength. This would provide data on ice strength, number and location of “leads”, ice thickness, ridging, floe size, etc. Such quantitative data could be used to search for a means to strength p* in an Ice Forecast Model.The following steps could be taken to develop quantitative scenarios:
1. Select 3 summer scenarios to follow the evolution of ice conditions in the Lougheed Island area by looking at sequential ice charts archived by CIS. The years 1976 to 1979 are suggested.
2. Carry out an analysis of average ice thickness and number of leads per km for each survey line.
3. Superimpose survey line thickness and “lead” distributions on late season ice charts from previous autumn.
4. Look at climatological data from Mould Bay and Isachsen weather stations for air temperatures and wind.
5. Calculate CWDD to determine ice strength degradation.
6. Obtain ice movement information from CIS for the period 1971-80 and compare it with ice strength and wind data.
7. Determine whether the date of break-up and start of ic emovements is a function of the partial concentration of first year ice and whether this can be related to p*.
8. Exercise the Ice Forecast Model with a simplified Lougheed Island area geometry and seasonal adjustments of strength p* to see if forecast results compare with observed ice conditions evolution.
Depending on data availability, effort level and resources this sequence of steps is proposed as a basis for planning future work in to ultimately developing and testing an Ice Forecast Model for the Arctic Island Archipelago.
12 CHC-TR-034
Gauthier, M-F., De Abreu, R., Timco, G.W. and Johnston, M.E. 2002. Ice Strength Information
in The Canadian Arctic: From Science To Operations. Proceedings of the 16th IAHR
International Symposium on Ice, pp 203-210, Dunedin, New Zealand.
Johnston, M., Frederking, R. and Timco, G. 2002. Properties of Decaying First Year Sea Ice:
Two Seasons of Field of Field Measurements. Proceedings 17th International on Okhotsk Sea and
Sea Ice, pp 303-311, Mombetsu, Hokkaido, Japan.
Johnston, M. and Timco, G.W. 2002. Temperature Changes in First Year Arctic Sea Ice During
the Decay Process. Proceedings of the 16th IAHR International Symposium on Ice, Vol., 2, pp
194-202, Dunedin, New Zealand
Johnston, M., Frederking, R. and Timco, G.W. 2003. Properties of Decaying First-year Sea Ice at
Five Sites in Parry Channel. Proceedings 17th International Conference on Port and Ocean
Engineering under Arctic Conditions, POAC’03, Vol. 1, pp 131-140, Trondheim, Norway. Kubat, I and Frederking, R. 2004 Ice Forecasting Model - Parameterization of Ice Cover
Properties, National Research Council of Canada, Canadian Hydraulics Centre Technical Report
CHC-TR-022, April 2004
Timco, G.W. and Johnston, M.E. 2002. Sea Ice Strength During the Melt Season. Proceedings of the 16th IAHR International Symposium on Ice, Vol. 2, pp 187-193, Dunedin, New Zealand