THYROID HORMONES, BLOOD PLASMA METABOLITES AND
HAEMATOLOGICAL PARAMETERS IN RELATIONSHIP TO MILK YIELD
IN DAIRY COWS
J. W. BLUM, P. KUNZ AND H. LEUENBERGER
Institute for Animal Production, Swiss Federal Institute of Technology, 8092 Zurich
K. GAUTSCHI
Department of Clinical Chemistry, University Hospital, 8091 Zurich
AND M. KELLER
F. Hoffmann-La Roche, Diagnostica, 4133 Schweizerhalle, Switzerland
ABSTRACT
To study their relationship to milk yield, the concentrations, in jugular venous blood, of thyroxine iodine (T4I),
thyroxine (T4), 3,5,3'-tri-iodothyronine (T3), glucose, non-esterified fatty acids (NEFA), triglycerides,
phospholipids, cholesterol, total protein, albumin, urea, haemoglobin and packed cell volume (PCV) have been measured in 36 cows (Simmental, Swiss Brown, Holstein and Simmental x Holstein) of different ages during a full lactation, pregnancy, dry period, parturition and 150 days of the ensuing lactation. Thyroid hormones and triglycerides were negatively, and total protein, globulin, cholesterol and phospholipids were positively, correlated with uncorrected or corrected milk yield during several periods of lactation, whereas glucose, NEFA, albumin, urea, haemoglobin and packed cell volume were not correlated with milk yield. The 10 animals with the highest milk yield (18-9 to 23-5 kg/day) exhibited significantly lower values of T4I, T4, T3 and glucose, significantly higher levels of total
protein and globulin and tended to have higher levels of NEFA than the 10 cows with the lowest milk yield (10-9 to 14-3 kg/day) throughout or during certain periods of lactation, whereas concentrations of triglycerides, phospholipids, cholesterol, albumin, haemoglobin and PCV did not differ. Changes in T4I, T4, T3, glucose and total
jprotein during lactation were also influenced by age, presumably associated with an increase in milk production with age. T3 was consistently lowest and cholesterol and phospholipids, during later stages of lactation, were highest in
Holsteins, which had the highest milk yields of all breeds. Changes of blood parameters were mainly caused by shifts in energy and protein metabolism in association with level of milk production.
INTRODUCTION in milk production, are presumed to act mainly through their stimulation of metabolic rates and in
CONSIDERABLE research has been done to further concert with other hormones. The present study the basic understanding of physiological and was undertaken to investigate the behaviour of biochemical . mechanisms responsible for thyroid hormones (T4I, thyroxine iodine; T4,
differences in milk production, and to identify thyroxine; T3, 3,5,3'-triiodothyronine) in
cows differing in milk yield by measuring blood association with milk yield. In addition, blood plasma concentrations of hormones and plasma concentrations of glucose, non-esterified metabolites (Hart, Bines, Roy and Morant, 1978a; fatty acids (NEFA), triglycerides (TG), Hart, Bines and Morant, 1979). Thyroid phospholipids (P-lipids), cholesterol, total protein hormones, which are known for their importance (TP), albumin and urea have been measured and
haemoglobin (Hb) and packed cell volume (PCV) have been determined. Several of these parameters can be affected by thyroid activity and so act as indicators of metabolic changes, particularly of shifts in energy metabolism.
MATERIAL AND METHODS
Animals
Thirty-six cows (Swiss Brown, Simmental, Holstein and Simmental x Holstein), of different ages have been studied for an entire lactation period, the ensuing dry period and for 150 days of the following lactation. The animals were kept at the experimental station of the Institute at 400 m above sea level.
Feeding
Summer feeding was from April to October, winter feeding from November to March. The animals were fed from 06.00 to 09.30 h and from 14.30 to 17.30 h. The average quality of the feed is shown in Table 1.
Animals with their 1st and 2nd lactations during the summer received grass (ad libitum) and maize silage (whole plant; 8 to 10 kg). During the winter period they were fed maize silage (ad libitum), hay (6 kg) and grass cubes (2-5 kg). For a 600-kg cow with a roughage intake of 13 kg (dry matter), this feeding regime allowed a maximal milk production potential of 16-8 and 11-4 kg during the summer and winter respectively. For each kg of milk (corrected) produced above this limit the animals received 0-4 kg of concentrates. For growing
animals concentrates corresponding to a production of an extra 2 kg milk were allowed.
Animals with three and more lactations during the summer received grass (ad libitum) and maize cubes (whole plant, artificially dried; 0 to 3 kg). During the winter they were fed hay (7 kg), grass silage (8 kg), maize silage (ad libitum) and grass cubes (1 kg). For a 650-kg cow with a roughage intake of 14 kg (dry matter) this feeding regime allowed a milk production potential of 15-2 and 13-3 kg during the summer and winter respectively. For each kg of milk (corrected) above this limit the animals received 0-35 kg of concentrates (up to 3 and 6 kg per animal during the summer and winter respectively).
A mixture of salt and minerals was given ad
libitum.
Milk yield and handling of milk samples
The animals were milked between 04.30 and 06.00 h and between 15.30 and 17.00 h. Milk yield was measured at least every second week. Forty ml of milk (taken in the morning and in the afternoon) were used for the determination of fat, protein and lactose by standard procedures (Swiss Brown Breeding Association, 6300 Zug, Switzerland). Corrected milk yield was calculated by use of the following formula:
Corrected milk yield (kg) =
(0-387 x gfatdl-1) + (0-245 x g protein dl"1) + (0-155 x g lactose dl~') / 3-14
In most cows the dry period before the second lactation studied lasted for 2 months.
TABLE 1
Feed quality
Summer period Winter period
Digestible Net energy Digestible Net energy Dry matter protein for lactation Dry matter protein for lactation
(g/kg) (g/kgDM) (MJ/kgDM) (g/kg) (g/kgDM) (MJ/kgDM) Grass Hay Maize silage Grass silage Maize cubes Grass cubes Concentrates 135 312 865 876 142 36 45 162 6-21 6-21 6-42 7-79 866 313 300 884 869 101 38 110 97 162 5-47 6-39 5-70 5-34 7-80
Handling of blood samples
Blood samples (40 ml) were obtained every 2 weeks from a jugular vein by means of single-use needles and polypropylene tubes containing 50 U (USP) of heparin per ml of blood. To minimize the effect of diurnal variations they were taken between 13.00 and 14.30 h, i.e. immediately before the cows received the afternoon ration. Five ml of blood were added to tubes containing fluoride and oxalate (Milian SA, Geneva, Switzerland). Heparinized and fluoride-oxalated tubes were kept on ice until they were centrifuged at 4°C for the separation of plasma, within 2-h of collection. In addition, 8-ml of blood were transferred to acid-washed glass tubes, another 10-ml to normally-cleaned glass tubes. After clot retraction, these tubes were centrifuged for the separation of serum. The remaining 5-ml of blood were transferred to tubes containing ethylene-diamine-tetraacetate (Becton Dickinson, Rutherford, NJ). Plasma and serum were kept at —20°C until analyzed. Heparinized plasma was used for the determination of NEFA, TG, P-lipids, cholesterol and urea, fluoride-oxalated plasma for the determination of glucose, serum from acid-washed tubes for the determination of T4I and serum from normally-cleaned glass tubes
for the determination of T4, T3, TP and albumin.
Blood samples containing ethylene-diamine-tetraacetate were used for the determination of haemoglobin (Hb) and packed cell volume (PCV). Measurement of T4I was according to
Rosenmund and Schneider (1974), T4 and T3 was
by radioimmunoassay (Abbot Laboratory, Radiopharmaceuticals, N. Chicago). Glucose, NEFA, urea and TP were determined as recently described by Blum and Kunz (1981), albumin according to Doumas, Watson and Biggs (1971) and P-lipids according to Hoeflmayr and Fried (1966). Enzymatic methods were used to measure cholesterol (Bohringer Mannheim GmbH, Biochemica, Mannheim) and TG (Hoffmann-La Roche, Diagnostica, Basle). Hb was determined by the cyanmethaemoglobin method (Merz and Dade AG, Berne), and PCV by use of a microhaematocrit centrifuge. Globulin concentrations were calculated by substracting concentrations of albumin from those of TP.
Statistical analysis
Data from three periods of lactation (0 to 40, 40 to 150 and 150 to 305 days post partum; lactation periods I, II and III, respectively) were analysed separately. Within each period, total milk yields and average values of blood parameters for each cow were estimated by the trapezium rule.
The effects of breed, parity, calving interval and calving season in these data were estimated by the method of least squares. After removing these effects, relationships between the remaining variation of milk yield and blood parameters were measured by calculation of the partial regression coefficients. Parity effects represent the difference between animals in their 1st lactation (heifers) and those in the 4th and subsequent lactations; the effect of calving intervals represents the difference between animals with calving intervals less than or greater than 400 days; and the effect of calving season represents the difference between animals calving between November and March and those calving between April and October.
Using Student's 'r' test, blood parameters of the 10 cows with the lowest milk yield were compared to the 10 cows with the highest milk yield.
RESULTS
Milk yield
Uncorrected milk yield increased rapidly after parturition, was maximal between 20 and 40 days and then decreased slowly (Figures 1 to 3). Uncorrected and corrected milk yield, protein yield and fat yield behaved similarly. During the 1st lactation, daily corrected yield ranged from 10-8 to 23-5 kg and during the 2nd lactation from 16-8 to 32-5 kg. Milk yield throughout lactation was significantly different in the various breeds, with Holsteins having the highest and Swiss Brown the lowest yields in this study (Table 2). Uncorrected milk yield was significantly
(P < 0 001) higher in cows with four or more
lactations than in heifers (Table 2). Calving season and calving interval had no significant effects on milk yield.
TABLE 2
Effects of breed and parity on uncorrected milk
Overall mean Breeds Simmental Swiss Brown Holstein yield (kg/day) Number of cows 36 7 13 9 Simmental x Holstein 7 Significance of effect (P) Lactations One Four or more 13 10 Significance of effect (P) Days of lactation 0- 40 21-6 22-4 18-1 25-4 20-7 * * * 18-3 25-0 ** * 40-150 19-1 190 15-7 23-0 19-5 * * * 17-1 21-6 * * * 150-305 14-4 14-8 11-7 16-2 14-9 * *# 13-7 151 NS
Blood parameters during different stages of lactation, dry period and in relationship to milk yield
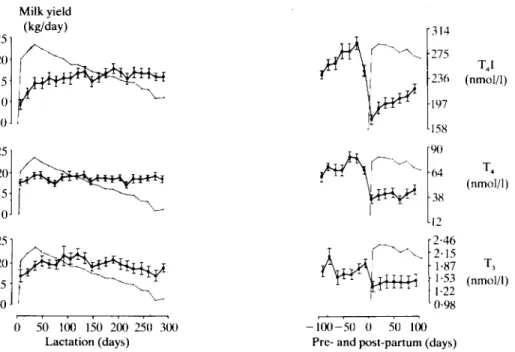
Thyroid hormones. Plasma thyroxine iodine (T4I)
increased rapidly at first and then more slowly up to about 200 days of lactation (Figure 1). An additional increase was noted until about 20 days
251 20 15 10 0 25 20 15 10 25 20 15 10 Milk yield (kg/day)
^ ^ v
50 100 150 200 250 300 Lactation (days)before the next parturition, followed by a marked decrease around parturition. T4I was lower during
the 2nd lactation than the 1st (P < 0-05). Changes in thyroxine (T4) at the onset, during and at the
end of lactation, as well as around parturition, were similar to those in T4I, but less marked
(Figure 1). T4 was lower during the 2nd lactation
than during the 1st (P < 0-05). Plasma 3,5,3'-tri-iodothyronine (T3) increased significantly until
120 days of lactation and then decreased (Figure 1). A sharp fall was noted immediately before parturition. T4I, T4 and T3 were consistently
negatively correlated with milk yield (Table 3). Cows with four or more lactations had lower levels of T4I (-63 and -55 nmol/1 during lactation
periods I and II, respectively; P < 0-001), of T4
(—16-7 and —6-4 nmol/1 during lactation periods I and II, respectively; P < 0-05) and of T3 (-0-31,
—0-77 and -0-15 nmol/1 during lactation periods I, II and III, respectively; P < 0-05 for period II) than first-calving heifers. Throughout lactation, T3
levels were lowest in Holsteins. There were no significant breed effects on T4I and T4 levels and no
uniform effects of calving season and calving interval on T4I, T4 or T3. T4I 236 (nmol/1) (nmol/1) (nmol/1) - 1 0 0 - 5 0 0 50 100 Pre- and post-partum (days)
FIG. 1. Blood plasma concentrations of T4I, T4 and T3 ( J ^ ) during a 305-day lactation period and
100 days before and after the ensuing parturition in relationship to uncorrected milk yield (• »). measured in 36 animals at 2-week intervals. The bars represent the standard errors.
Milk yield (kg/day) 24- 18-12' 6-(I 3-30 2-75 2-20 Glucose (mmol/1) 24 18-12 6 0
*"vV*V
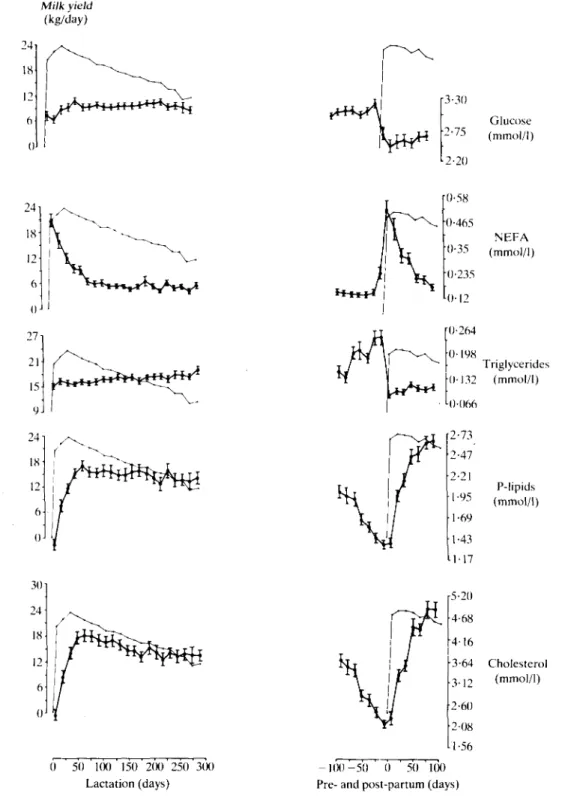
301 24 18 12 6 0 NEFA °"3 5 (mmol/1) Triglycerides 0-132 (mmol/1) P-lipids (mmol/1) 5-20 4-68 4 1 6 3-64 3-12 2-60 2-08 1-56 Cholesterol (mmol/1) 0 50 1(X) 150 200 250 3(K) Lactation (days) - 1 0 0 - 5 0 0 50 100 Pre- and post-partum (days)FIG. 2. Blood plasma concentrations of glucose, NEFA, triglycerides, P-lipids and cholesterol (f 5) during a 305-day lactation period and 100 days before and after the ensuing parturition in relationship to uncorrected milk yield (• • ) , measured in 36 animals at 2-week intervals.
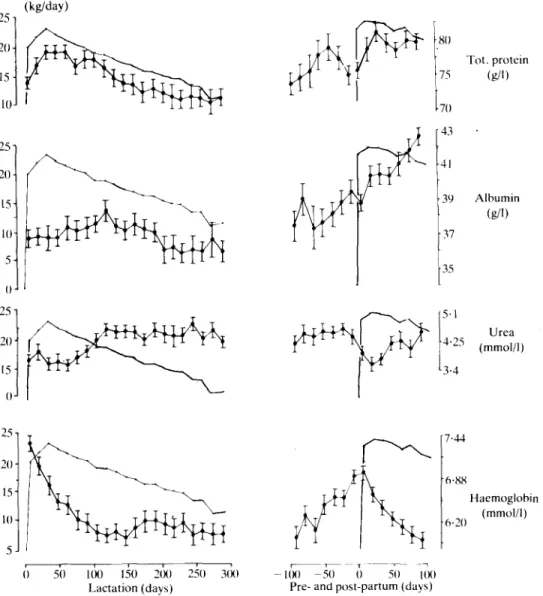
25- 20- 15-10 25-20 15 10 5 0 25 20 15 0 Milk yield (kg/day) Tot. protein 75 (g/l)
tC^vM
Urea (mmol/1) 25-1 20- 15- 10- 5-7-44 6-88 6-20 Haemoglobin (mmol/1) 50 100 150 200 250 3(X) Lactation (days) -KX) - 5 0 0 50 UK) Pre- and post-partum (days)FIG. 3. Blood plasma concentrations of total protein, albumin, urea and haemoglobin (J J ) during a 305-day lactation period and 100 days before and after the ensuing parturition in relationship to uncorrected milk yield (• • ) , measured in 36 animals at 2-week intervals.
Glucose and lipids. In the first lactation, plasma
glucose was relatively low during the initial 20 days and in the period of peak milk yield, then increased slightly up to 60 days post partum and remained stable afterwards (Figure 2). Glucose was unaltered during the last 100 days of the succeeding pregnancy, but after parturition was lower than during the preceding lactation. It did not follow lactation curves, was not changed
during milk production in the 1st lactation and was not significantly correlated with milk yield.
Plasma non-esterified fatty acids (NEFA) were highest at parturition and during the first stages of lactation, then continuously decreased up to about 60 days post partum, remained at relatively low levels for the rest of lactation and increased sharply immediately before the next parturition to levels similar to those at the onset of the preceding
TABLE 3
Relationships between milk yield and blood parameters Milk parameter (y) Milk yield (kg) Blood parameters
to
TJ T4 T, Triglycerides Triglyce rides Total protein Total protein Correlation coefficient (rxy) -0-50*** -0-42** - 0 - 3 0 * -0-33 * -0-29 * 0-39** 0-30 * Days post partum 150-305 150-305 0- 40 40-150 150-305 0- 40 40-150lactation (Figure 2). NEFA did not follow lactation curves and were not significantly correlated with milk yield. Plasma triglycerides (TG) increased slightly during lactation in association with decreasing milk yields, markedly during the last 2 months of pregnancy (dry period), then rapidly fell immediately before the onset of the next lactation (Figure 2). There were significant negative correlations between TG and milk yield throughout lactation (see also Table 3). Plasma phospholipids (P-lipids) and cholesterol both increased during the first 50 to 60 days of
lactation, then remained elevated and decreased rapidly during the dry period (Figure 2). However, both compounds only partially followed the lactation curves. There were no significant correlations of P-lipids and cholesterol with milk yield.
Glucose was lower (-0-57 and -0-21 mmol/1 during lactation periods I and II, respectively;
P < 0-05) in cows with four or more lactations than
first-calving heifers. Breed, calving interval and calving season had no significant effects on glucose. NEFA were affected by breed during lactation period II (P < 0-01) and were highest in Holsteins, but were not affected by calving season and calving interval. Triglycerides, although not significantly affected by breed, were numerically lowest in Holsteins throughout lactation, but were not affected by age, calving season and calving interval. Cholesterol (during lactation period II) and P-lipids (during lactation period III) were significantly affected by breeds (P < 0-05), again highest in Holsteins. Cows with calving intervals >400 days had higher levels of cholesterol and P-lipids throughout lactation (significant during lactation period II and III for cholesterol and during lactation period III for P-lipids; P < 0-05)
TABLE 4
Mean values of blood parameters at three stages of lactation in the 10 animals with the lowest milk yields and the 10 animals with the highest milk yieldX in a group of 36 animals
Days of lactation Yield group
Milk yield (kg/day) T4I (mmol/1) T4 (nmol/1) T3 (nmol/1) Glucose (mmol/1) NEFA (mmol/1) Triglycerides (mmol/1) P-lipids (mmol/1) Cholesterol (mmol/1) Total protein (g/1) Albumin (g/I) Urea (mmol/1) Haemoglobin (mmol/1) PCV (1/1) Low Mean 16-46 0-24 6706 1-89 3-24 0-30 0 1 3 1-85 3-28 72-0 3 6 0 3-52 6-94 0-32 0-40 s.e. 0-02 7-02 0 1 7 0-02 0 0 6 0 0 1 0-13 0-16 1-2 1 0 0-20 0-29 0 1 1 High Mean 27-89 0 1 9 50-97 1-60 2-74 0-35 0 1 1 1-78 3-22 80-5 36-1 3-40 6-93 0-32 s.e. 0-01* 4-33 0 1 9 0-11** 0 0 4 0 0 1 0-09 0-22 2-4** 0-6 0-36 0-15 0 0 1 Low Mean 14-88 0-24 63-33 2-10 3-22 0 1 6 0 1 4 2-33 4-09 73-9 37-5 4-20 6-29 0-30 40-150 s.e. 0 0 1 2-71 0-17 0 0 8 0 0 1 0 0 1 0-12 0-23 1-2 0-7 0-31 0-27 0 0 1 High Mean 24-77 0-21 49-17 1-66 2-96 0 1 9 .0-12 2-18 4-24 80-6 37-0 4-00 6-30 0-30 s.e. 0-01* 2-02*** 0-13* 0-06* 0-02 0 0 1 0 1 1 0-26 1-8" 0-5 0-20 0-18 0 0 1 Low Mean 10-87 0-25 57-54 1-97 3-17 0-15 0-14 2-19 3-68 69-3 36-3 4-31 6-15 0-30 150-305 s.e. _ 001 0 1 9 0 1 1 0 0 6 0 0 1 0 0 1 0-09 0 1 6 1 0 0-7 0-19 0-22 0 0 1 High Mean 16-66 0-22 49-56 1-57 3-02 0-15 0 1 3 2-10 3-68 75-0 34-0 4-30 6 1 9 0-30 s.e. _ 0-01* 0-27*** 0-15*** 0-05 0 0 1 0-01 0-12 0-27 2-1* 0-5 0-20 0-13 001 t Average age: 3-2 ± 0-4 years; breeds: 7 Brown Swiss, 1 Simmental, 2 Simmental x Holstein.
than cows with calving intervals <400 days. Calving season and age had no significant effects on P-lipids and cholesterol during lactation. Cholesterol and P-lipids were closely correlated (/• = 0-77, 0-82 and 0-78 during lactation periods I, II and III, respectively; P < 0-001).
Proteins, urea, haemoglobin and packed cell volume. After parturition total protein (TP)
increased rapidly, reaching its highest levels between 30 and 100 days of lactation and then decreasing slightly (Figure 3). There was also a transient increase 30 to 40 days before the next parturition. TP closely followed the milk yield curve, which is also expressed by significant positive correlations between TP and milk yield (Table 3). Albumin increased during the first 100 days of lactation, especially during the second lactation, and then decreased (Figure 3). There were no significant correlations between albumin and milk yield. Urea levels decreased during the first weeks of lactation, then increased and remained steady for the duration of lactation (Figure 3). There were no significant correlations between plasma urea levels and milk yield.
Haemoglobin concentrations were high at parturition and then decreased until 100 days post
partum (Figure 3). Haemoglobin concentrations
increased during the last 2 months before parturition and were not correlated with milk yield. PCV exhibited the same type of response during lactation, dry period and parturition as Hb, which is shown by close relationships between both parameters (r = 0-93; P < 0-001). PCV was not significantly correlated with milk yield and PCV responses during lactation were not significantly modified,by breed, age, calving season and calving intervals.
In cows with two or more lactations total protein was higher (by 4-0 g/1 during lactation period I;
P < 0-001) throughout lactation than in heifers.
Albumin, urea and haemoglobin were not affected during lactation by breed, calving season and calving interval. Whereas albumin and haemoglobin were not affected by age, urea was always higher (by 0-88, 0-80 and 0-39 mmol/1 during lactation periods I, II or III, respectively;
P < 0-01 for period II) in cows with two or more
lactations than in heifers.
Blood parameters in high- and low-yielding dairy cows (Table 4)
Animals with a high milk yield lost significantly more weight during the first 3 months of lactation (0-23 ± 0-03 of the weight measured during the 9th month of pregnancy) than animals with a low milk yield (0-14 ± 0-03 of the weight measured during the 9th month of pregnancy) (P < 0-05).
Concentrations of T4I, T4 and T3 were
consistently lower in high- as compared to low-yielding cows. Differences were statistically significant for T4I during the whole lactation and
for T4 and T3 from 40 to 305 days post partum.
Plasma glucose levels in cows with a high milk yield were significantly lower (P < 0-05) during the first 150 days of lactation (but not during later periods) than in cows with a low milk yield. Plasma NEFA levels in cows with a high milk yield were higher during the first 50 to 60 days of lactation (but not during later periods) than in cows with a low milk yield, but the differences were not statistically significant. From 150 to 305 days post
partum TG were significantly lower (P < 0-05) in
high- as compared to low-producing animals. Plasma P-lipids and cholesterol were not significantly different between low- and high-producing cows.
Concentrations of TP were significantly higher
(P < 0-05) throughout lactation in cows with high,
compared to low, milk yield. The changes of TP in cows with a relatively low milk yield were more marked than in cows with a high milk yield. Concentrations of albumin, urea, Hb and PCV were similar in low- and high-producing cows throughout lactation.
DISCUSSION
When investigating the effects of blood parameters on milk yield, account must also be taken of the many, possibly inter-relating, factors which affect them both. In this study the results were corrected for variation due to breed, age, calving interval and calving season. There were marked differences in milk yield between breeds; however, the effects of breed on blood
parameters, possibly due to the relatively low numbers of animals studied, were only rarely significant. Age affected milk yield and seemed to have important effects on several of the blood parameters measured. Calving season and calving interval had only a minor influence on milk yield and blood parameters. Differences between herds, probably due mainly to differences in nutrition and climate, which for certain parameters may be significant (Payne, Dew, Manston and Faulks, 1970), were not considered in our study. Animals were fed according to requirements, except for the highest-yielding animals in the early stages of lactation. Changes of some blood parameters were, therefore, the result of relatively insufficient food intake.
The total (protein-bound plus free) thyroid hormone concentrations measured are likely to reflect changes of free hormone levels, since protein binding is not changed during late pregnancy, the parturient period and during the first 4 months of lactation in cows fed various amounts of energy (Kunz and Blum, 1981) or in lactating cows (Hart, Bines, Roy and Morant, 1978b). Concentrations of T4I (which correspond
to measurement of protein-bound iodine, PBI), T4
and T3 exhibited a marked decrease around
parturition. T4I then increased continuously
during the first weeks of lactation, as initially shown for PBI by Mixner, Kramer and Szabo (1962). T4I and T4 levels were closely correlated
with each other. However, relative changes of T4
during lactation as well as during the dry period were less marked than those of T4I.
Such negative relationships between T4, PBI or
T3 levels and milk yield have been described
previously (Cappa and Bertoni, 1971; Vanjonack and Johnson, 1975; Hart et al, 1978a; Walsh, Veseley and Mahadevan, 1980). The relatively low thyroid hormone levels in high-yielding, as compared to low-yielding, cows is surprising in view of reports indicating an enhanced secretion rate of T4 with increasing milk production
(Anderson, 1971), and since the administration of thyroid hormones is well known to stimulate milk production.
Vanjonack and Johnson (1975) have suggested that, because thyroid hormones are excreted by
the mammary gland, cows with high milk production lose greater amounts of these hormones through the udder, thus resulting in lower plasma concentrations. These authors also discussed the possibility of an enhanced uptake of thyroid hormones by target organs. The relatively low levels of T4I, T4 and T3 could also be an
expression of differences in energy metabolism between low- and high-yielding cows. A low energy intake and negative energy balances were associated with a decrease of T4, and especially T3,
levels in pregnant and lactating cows, growing steers and mature sheep (Blum, Kunz, Schnyder, Thomson, Vitins, Blom and Bickel, 1979; Blum, Gingins, Vitins and Bickel, 1980; Blum and Kunz, 1981; Kunz and Blum, 1981). Low T4 levels have
previously been found in cows with acetonemia (Heitzmann and Mallinson, 1972). The association of low circulating thyroid hormone levels in high-yielding cows with a reduction of maintenance requirements remains to be clarified. In view of the enhanced wastage of energy induced by the administration of T4 or T3 to lactating cows,
possibly leading to clinically overt acetonemia (Emery and Williams, 1964; Hibbitt and Baird, 1967) elevated circulating thyroid hormone levels and an enhanced thyroid activity are unfavourable in situations of precarious energy intake, e.g. the first weeks of lactation in high-yielding cows.
Since T4I, T4 and T3 consistently remained at
lower levels in cows with two or more lactations than in heifers, thyroid hormone responses during lactation were also influenced by age. Because milk yield increased with age, it cannot be decided which factor was the more important in modifying the hormone during lactation.
Plasma glucose exhibited its well-known increase at parturition. The decrease of glucose levels during the first weeks after parturition may be interpreted as mainly the consequence of the high demand for this substance, primarily for lactose synthesis (Bickerstaffe, Annison and Linzell, 1974). Relatively low glucose levels in high- as compared to low-yielding cows have also been found by Pehrson (1971) and Hart et al. (1978a). However, differences were small in all these studies, thus explaining the absence of significant relationships between glucose levels
and milk yield, but because Schwalm and Schultz (1976) reported a small positive correlation between plasma glucose levels and milk yield, the situation remains controversial. The lower glucose levels at the onset of lactation of cows with two or more lactations as compared to heifers may be interpreted as failure with increasing age to normalize plasma concentrations rapidly.
The sharp rise of NEFA levels before and at parturition, followed by a gradual decline during the first 2 months of lactation, represents a typical response pattern (Grigsby, Oxender, Hafs, Britt and Merkel, 1974; Parker, 1977). At the onset of lactation the increase of energy-yielding NEFA is presumably the result of enhanced lipolysis and reduced re-esterification in adipose tissue to cope with the high demand for energy, when the availability of glucose is reduced (Metz and van den Bergh, 1977). In this period food intake usually lags behind milk yield (Bines, 1976) and body fat has to be mobilized. This was mirrored by a greater decrease of body weight in high-yielding cows during the first 3 months of lactation. In later periods of lactation, energy intake is mostly sufficient and marked lipolysis is unnecessary, which could explain the relatively low NEFA levels despite persistent high milk production, and the absence of significant correlations between both measurements. Presumably because of considerable individual variability, NEFA levels only tended to be higher (but were not significantly so) at the onset of lactation in high- as compared to low-yielding cows. Other workers have described significant differences between low and high producers (Pehrson, 1971; Hart etal., 1978a). Of all the breeds studied, Holsteins produced the highest milk yields and had consistently higher NEFA levels throughout lactation, suggesting a prolonged need for fat mobilization. It is important to note that, in contrast to glucose, the reaction of NEFA to lactation was clearly not age-dependent.
A similar pattern of changes of TG has been described by Pehrson (1971) and Schwalm and Schultz (1976). TG are an important source of long-chain fatty acids for milk fat synthesis (Bickerstaffe et al, 1974) and are mainly concentrated in the very low density lipoprotein
fraction, which is higher in dry than in lactating cows (Palmquist, 1976). Also, TG are taken up by the mammary gland which could explain the negative relationship between milk yield and plasma TG concentrations in our study. In contrast, Schwalm and Schultz (1976) reported positive correlations between milk yield and plasma TG concentrations. However, in this study only data of the first 7 weeks of lactation were included.
Plasma concentrations of P-lipids and cholesterol were closely correlated, but their concentration curves did not completely follow those of milk yield. There was a lag in the response to lactation, peak concentrations being reached later than maximal milk yield and both lipids remaining elevated despite a continuously decreasing milk production. This explains why both lipids were not significantly correlated with milk yield. Furthermore, we found no difference in P-lipids and cholesterol between cows with a high and those with a low milk yield. This may, in part, be explained by studies of Varman and Schultz (1968) and Bickerstaffe etal. (1974), who found no evidence for uptake of P-lipids and cholesterol by the mammary gland. The relatively high concentrations of these lipids in Holsteins as compared to other breeds in our study may also have been due to genetical differences, as suggested by studies of Henricson, Jonsson and Pehrson (1977), and not necessarily due to differences in milk yield.
Total protein was lower around parturition and increased at the onset of lactation, as was also found by Oldham, Broster, Napper and Siviter (1979). Because albumin levels did not change, the transient fall must have been due to the globulin fraction, part of which is known to be taken up by the udder when colostrum is formed. TP had a high correlation with milk yield. Moreover, there were significantly higher levels of TP in high- as compared to low-yielding animals. High-yielding cows were, on average, older than low-yielding animals. Since TP, but not albumin, levels increased with age, the globulin fraction must have accounted for these differences. This is in agreement with Kitchenham and Rowlands (1976), who reported an increase of globulins with
increasing age. In contrast to Little (1974), albumin level barely decreased at the onset of the first lactation and even increased during the first months of the ensuing lactation, as found by Oldham et al. (1979). Albumin was the same in high- and low-yielding animals, except for a numerically small difference in the second half of lactation. Moreover, albumin was not correlated with milk yield. It was, therefore, plasma globulins which were changed in association with changes in milk yield. Variations of TP were numerically very small, but as only small amounts of the total nitrogen in milk are derived from plasma globulins and albumin (Clark, Spires and Davis, 1978), large differences would not be expected.
Plasma urea concentrations also showed a typical response to parturition and lactation (Oldham et al., 1979). They were not significantly related to milk yield and there were no significant differences between high- and low-yielding cows. Differences in the intake of protein and its digestion in the intestinal tract, changes of tissue protein breakdown, utilization of amino acid N at the cellular level and the urinary excretion rate may have accounted for the changes of plasma concentrations.
Alterations of Hb and PCV during lactation, the dry period and in the periparturient period, and the close relationship between Hb and PCV have also been described by Stirnimann, Stampfli and Gerber (1974). However, in contrast to Payne et
al. (1970) and Whitlock, Little and Rowlands
(1974), no association was found between milk yield and Hb or PCV. Since most changes of Hb and PCV were opposite to those of total protein, fluid balance changes do not appear to be a common cause for modifications of these parameters.
In conclusion, this study shows that several blood parameters are correlated with milk yield and that differences exist between high- and low-yielding cows. It appears that, to a considerable extent, thyroid hormone and metabolite differences were both imposed by the enhanced energy, and possibly protein, requirements of lactation. Breed and age difference with respect to blood parameters seem also to be due largely to differences in the level of milk production.
ACKNOWLEDGEMENTS
This work has been supported by a grant of the Zentenarfonds of the Swiss Federal Institute of Technology (Project Nbr. 208-75). We are grateful to the late Prof. H. Rosenmund, Department of Clinical Chemistry, University Hospital, 8091 Zurich, whose support enabled us to measure T4I.
REFERENCES
ANDERSON, R. R. 1971. Secretion rates of thyroxine and tri-iodothyronine in dairy cattle. J. Dairy Sci. 54: 1195-1199.
BICKERSTAFFE, R., ANNISON, E. F. andLINZELL, J. L. 1974. The
metabolism of glucose, acetate, lipids and amino acids in lactating dairy cows. /. agric. Sci., Camb. 82: 71-85. BINES, J. A. 1976. Regulation of food intake in dairy cows in
relation to milk production. Livest. Prod. Sci. 3: 115-128.
BLUM, J. W., GINGINS, M., VITINS, P. and BICKEL, H. 1980.
Thyroid hormone levels related to energy and nitrogen balance during weight loss and regain in adult sheep.
Actaendocr. Copnh. 93: 440-447.
BLUM, J. W. and KUNZ, P. 1981. Effects of fasting on thyroid hormone levels and kinetics of reverse triiodothyronine in cattle. Ada endocr. Copnh. 98: 234-239.
BLUM. J. W., KUNZ, P., SCHNYDER, W., THOMSON, E. F., VITINS, P., BLOM, A. and BICKEL, H. 1979. Changes of
hormones and metabolites during reduced and compensatory growth of steers. Annls. Rech. Vet. 10: 391-392.
CAPPA, V. and BERTONI, G. 1971. [Variations in protein-bound iodine levels in cattle during lactation.] Folia vet. lat. 1: 552-559.
CLARK, J. H., SPIRES, H. R. and DAVIS, C. L. 1978. Uptake and
metabolism of nitrogenous components by the lactating mammary gland. Fedn. Proc. 37: 1233-1238.
DOUMAS, B. T.. WATSON, W. A. and BIGGS, H. G. 1971.
Albumin standards and the measurement of serum albumin with bromcresol green. Clinica chim. Ada 31: 87-96. EMERY, R. S. and WILLIAMS, J. A. 1964. Incidence of ketosis.
other diseases and some postpartum reproductive ailments in normal and triiodothyronine-treated cows. J. Dairy Sci. 47: 879-881.
GRIGSBY, J. S., OXENDER, W. D., HAFS, H. D., BRUT, D. G.
and MERKEL, R. A. 1974. Serum insulin, glucose and free fatty acids in the cow and fetus during gestation. Proc. Soc.
exp. Biol. Med. 147: 830-834.
HART, I. C , BINES, J. A. and MORANT, S. V. 1979. Endocrine
control of energy metabolism in the cow: correlations of hormones and metabolites in high and low yielding cows for stages of lactation. J. Dairy Sci. 62: 270-277.
HART, I. C , BINES, J. A., MORANT, S. V. and RIDLEY, J. L.
1978a. Endocrine control of energy metabolism in the cow: comparison of the levels of hormones (prolactin, growth hormone, insulin and thyroxine) and metabolites in the plasma of high- and low-yielding cattle at various stages of lactation. J. Endocr. 77: 333-345.
HART, I. C , BINES, J. A., ROY, J. H. B. and MORANT, S. V.
1978b. Plasma thyroxine and free thyroxine index in high-and low-yielding cattle high-and in calves of different breeds. J.
HEITZMAN, R. J. and MALLINSON, C. B. 1972. A comparison of thyroxine levels in the plasma of healthy, starved and acetonemic dairy cows. Res. vet. Sci. 13:591-593.
HENRICSON, B . , JONSSON, G. and PEHRSON, B. 1977. "Lipid pattern", glucose concentration, and ketone body level in the blood of cattle. Variations with age, stage of lactation, and between groups of half-sisters. Zentbl. VetMed. A. 24: 89-102.
HIBBITT, K. G. and BAIRD, G. D. 1967. An induced ketosis and
its role in the study of primary spontaneous bovine acetonaemia. Vet. Rec. 81:511-520.
HOEFLMAYR, J. and FRIED, R. 1966. [A method for routine
determination of lipid phosphorus and of phosphatides],
Medizin Erndhr. 7: 9-10.
KITCHENHAM, BARBARA A. and ROWLANDS, G. J. 1976. Differ-ences in the concentrations of certain blood constituents among cows in a dairy herd. / . agric. Sci., Camb. 86: 171-197.
K U N Z , P. and BLUM, J. W. 1981. Effect of pre- and
post-parturient energy intake on blood plasma levels of hormones and metabolites. In Metabolic Disorders in Farm Animals. Proc. 4th int. Conf. on Production Disease in Farm Animals, pp. 49-54. Institut fur Physiologic Physiologische Chemie und Ernahrungsphysiologie, Tierarztliche Fakultat der Universitat Miinchen.
LITTLE, W. 1974. An effect of the stage of lactation on the concentration of albumin in the serum of dairy cows. Res. vet.
Sci. 17: 193-199.
MIXNER, J. P., KRAMER, D . H. and SZABO, K.-T. 1962. Effects of breed, stage of lactation and season of year on thyroid secretion rate of dairy cows as determined by the chemical thyroxine turnover method. J. Dairy Sci. 45: 999-1002. M E T Z , S. H . M. and VAN DEN BERGH, S. G. 1977. Regulation of
fat mobilization in adipose tissue of dairy cows in the period around parturition. Neth. J. agric. Sci. 25: 198-211. OLDHAM, J. D . , BROSTER, W. H., NAPPER, D. J. and SIVITER, J.
W. 1979. The effect of a low-protein ration on milk yield and plasma metabolites in Friesian heifers during early lactation.
Br. J. Nutr. 42: 149-162.
PALMQUIST, D. L. 1976. A kinetic concept of lipid transport in ruminants. A review. J. Dairy Sci. 59: 355-363.
PARKER, B. N. J. 1977. Plasma glucose and non-esterified fatty acids in relation to dietary energy in the dairy cow. In Proc.
3rd int. Conf. on Production Disease in Farm Animals, pp.
34-36. Centre for Agricultural Publishing and Documenta-tion, Wageningen.
PAYNE, J. M., D E W , S. M., MANSTON, R. and FAULKS, M. 1970. The use of a metabolic profile test in dairy herds. Vet. Rec. 87: 150-158.
PEHRSON, B. 1971. Studies of the blood lipid pattern in healthy dairy cows. Ada vet. scand. 12: 230-242.
ROSENMUND, H. and SCHNEIDER, F. 1974. [The determination of protein-bound iodine in cattle]. Zentbl. VetMed. A 21: 142-148.
SCHWAI.M, J. W. and SCHUI.TZ, L. H. 1976. Relationship of insulin concentration to blood metabolites in the dairy cow.
J. Dairy Sci. 59:255-261.
STIRNIMANN, J., STAMPFLI, G. and GERBER, H. 1974. [Blood serum iron and copper concentration and red cell parameters in Simmental cows during pregnancy and puerperal period].
Schweizer. Arch. Tierheilk. 116:231-243.
VANJONACK, W. J. and JOHNSON, H. D. 1975. Effects of moderate heat and milk yield on plasma thyroxine in cattle. / . Dairy Sci. 58:505-511.
VARMAN, P. N. and SCHUI.TZ, L. H. 1968. Blood lipids of cows at different stages of lactation. J. Dairy Sci. 51: 1971-1974. W A L S H , D . S., VESELEY, J. A. and MAHADEVAN, S. 1980.
Relationship between milk production and circulating hormones in dairy cows. J. Dairy Sci. 63: 290-294.
WHITLOCK, R. H . , LITTLE, W. and ROWLANDS. G. J. 1974. The incidence of anaemia in dairy cows in relation to season, milk yield and age. Res. vet. Sci. 16: 122-124.